Troubleshoot common health problems of Kubernetes workloads
- Latest Dynatrace
- Tutorial
- 5-min read
Even with a reliable infrastructure, issues can arise, leading to service degradation or, in worst-case scenarios, user-facing errors. Kubernetes experience offers a suite of tools to visualize and troubleshoot issues, helping to catch problems before they escalate.
This guide is tailored for Ops, DevOps, and DevSecOps professionals managing Kubernetes clusters. A basic understanding of Kubernetes concepts such as resource requests/limits, pods, and nodes is assumed, though expertise in Dynatrace or cluster management is not required.
Scenario
- Error or warning indicators appear for clusters and workloads in the Kubernetes app.
- The Dynatrace Intelligence health status displays yellow or red for certain workloads, nodes, or clusters.
Prerequisites
- Access to a Kubernetes cluster.
- New Kubernetes experience configured.
Identify and troubleshoot health issues
The following steps will guide you through the phases of identifying problematic workloads on your clusters and the process of remediation.
1. Identify problematic workloads
Select the red number within the workload tile to apply a filter displaying all currently unhealthy workloads across your monitored clusters.
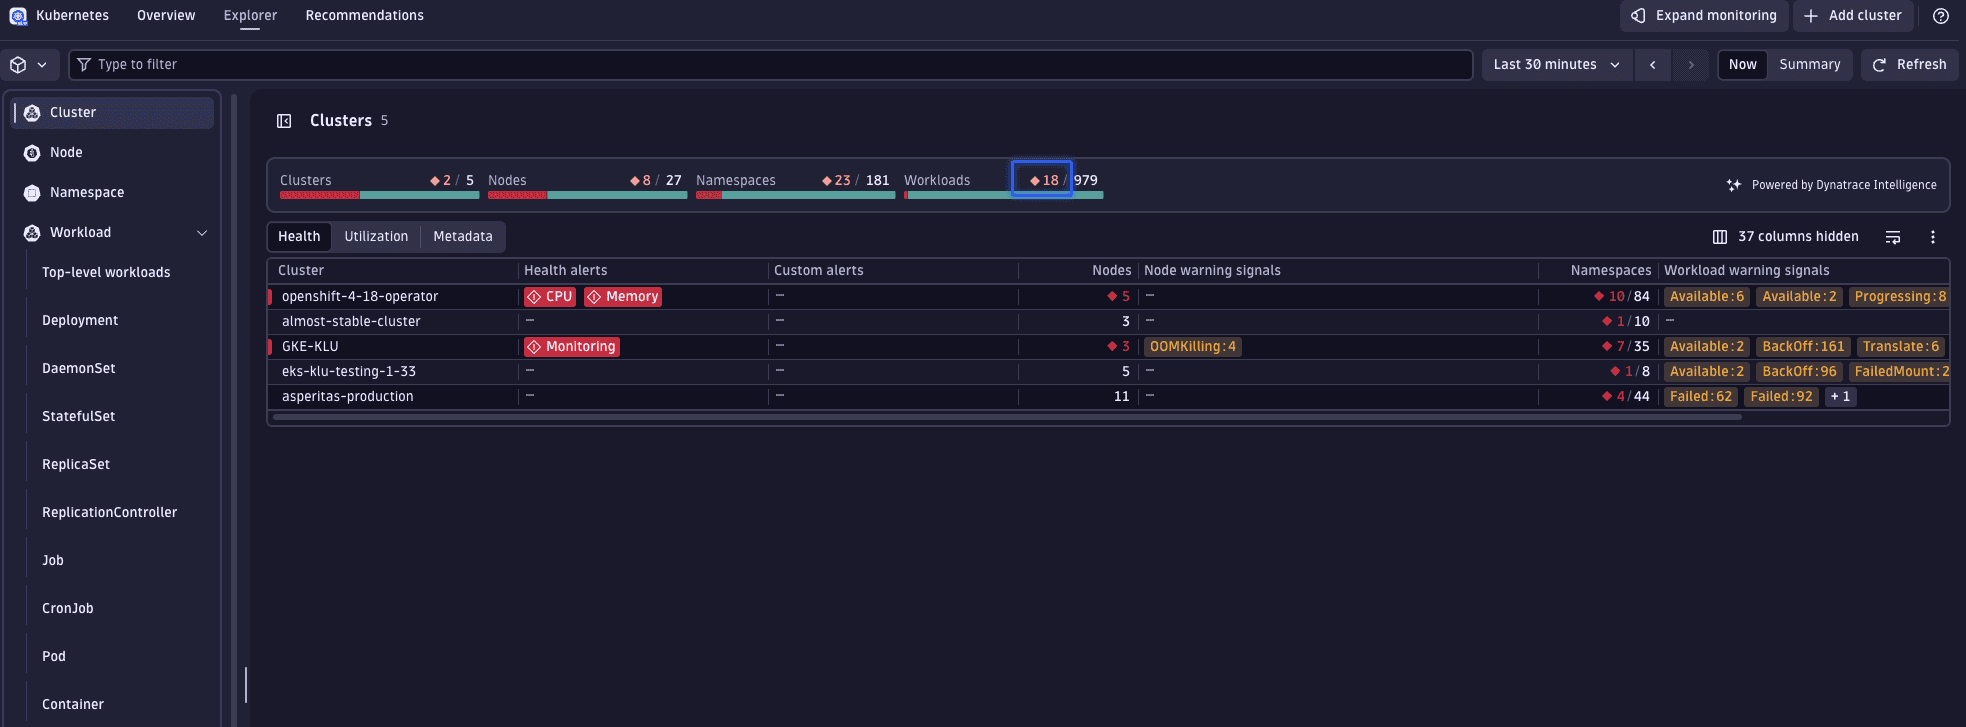
Among the listed workloads, you can see that the prom-problem-sim workload is displaying signs of trouble.
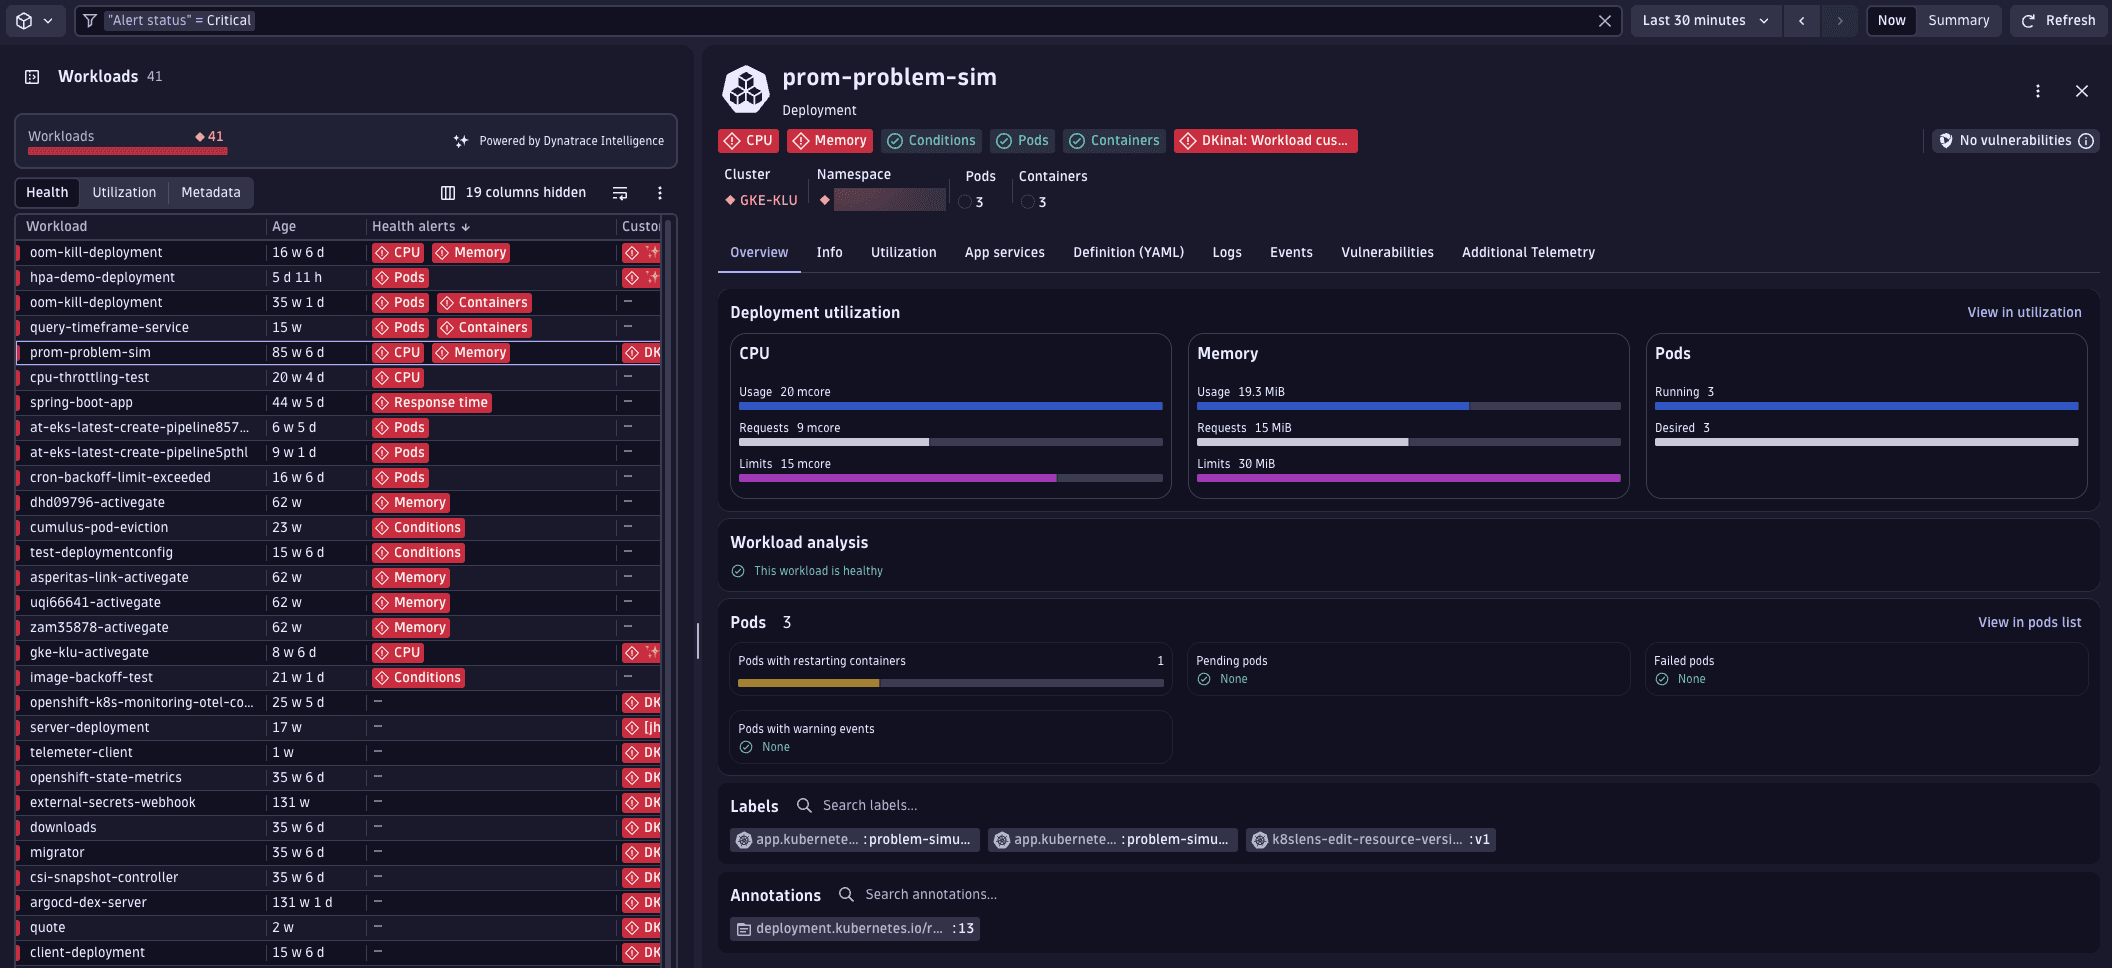
2. Analyze workload problems
We've identified an important workload displaying problems that are causing it to be unhealthy. To understand the underlying issues better, we'll take a closer look at this workload.
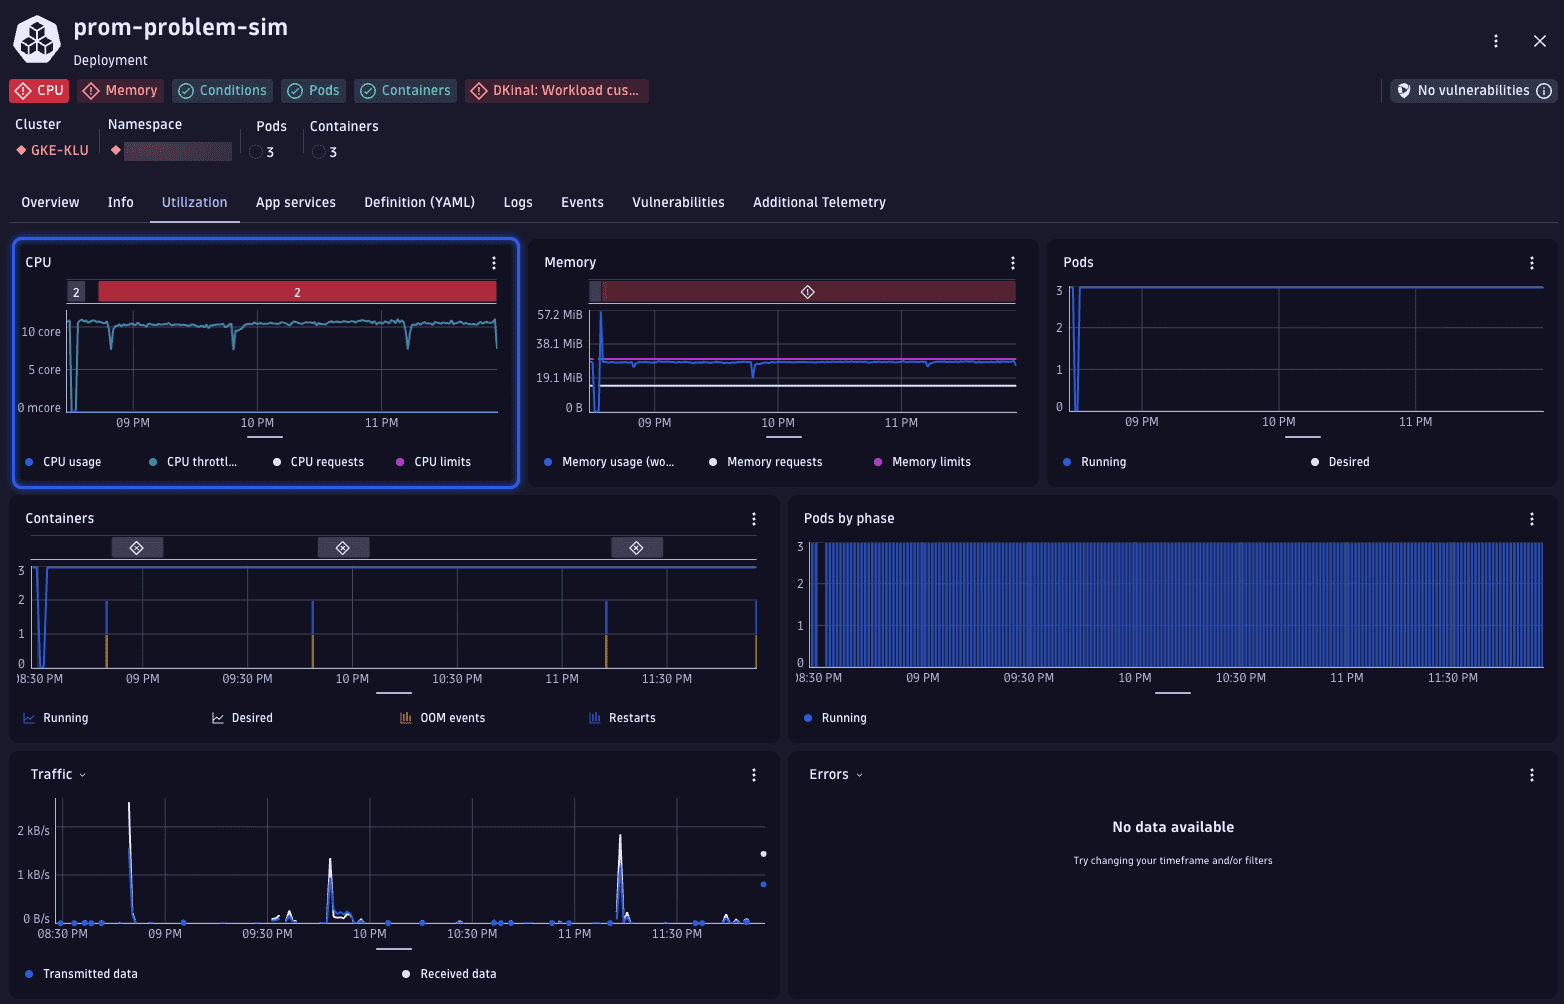
On the workload page, review the Problems indicators displayed at the top (for example, CPU usage close to limits).
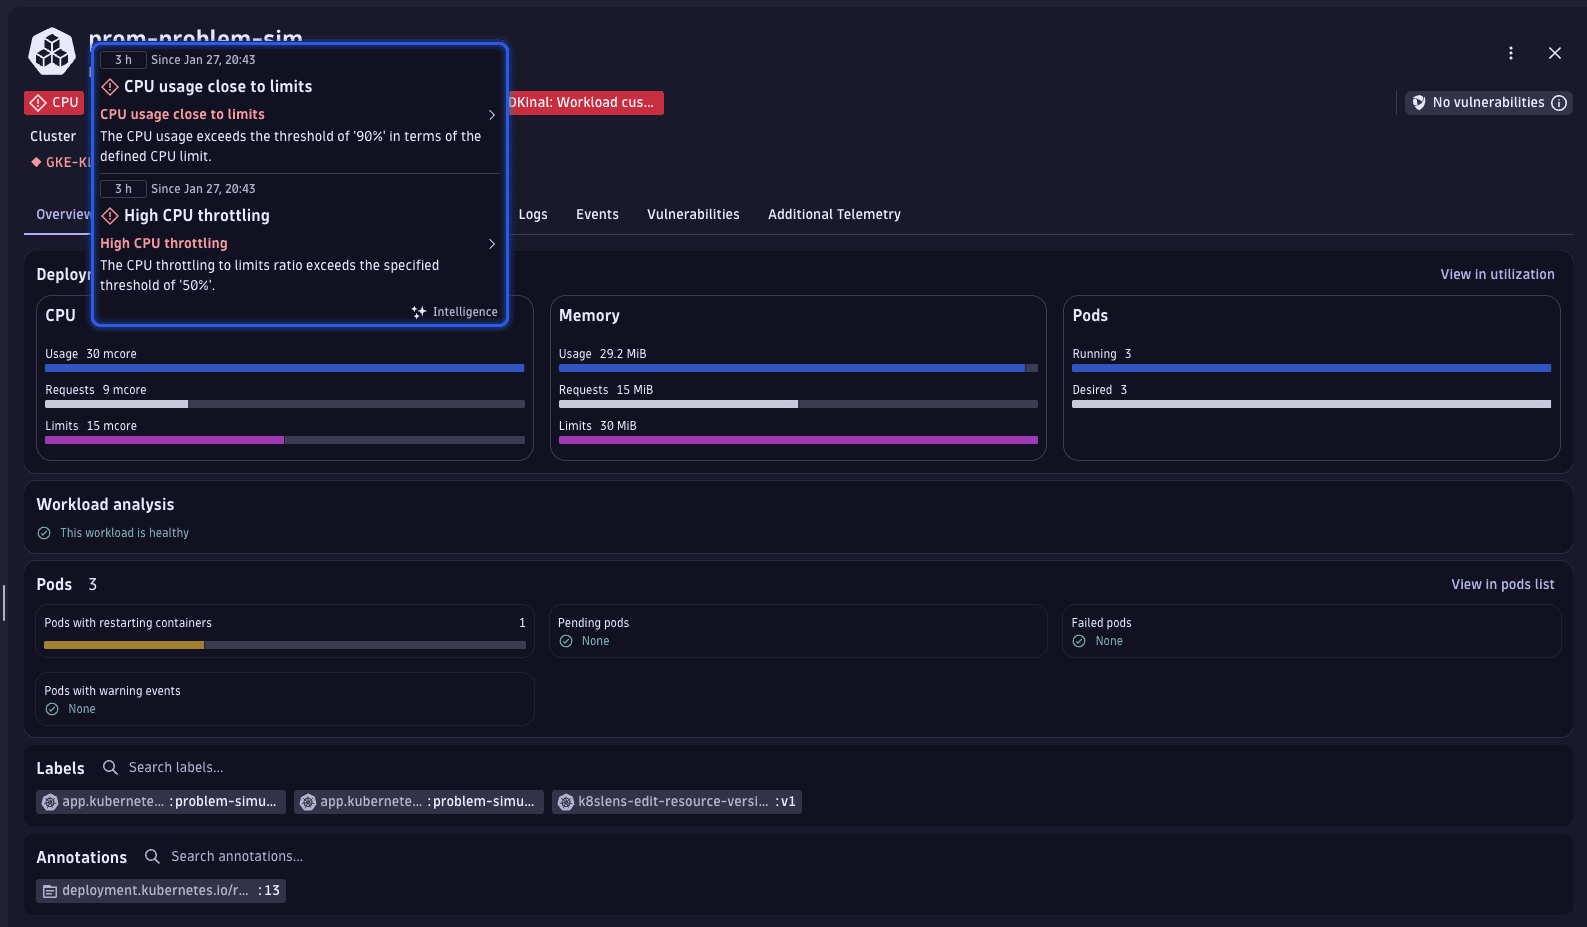
Select CPU usage close to limits to enter problem mode. Dynatrace opens a dedicated problem view where you can:
- See the exact problem statement and duration.
- Understand why the workload is affected (for example, CPU limits exceeded or throttling detected).
- Correlate resource usage (for example, CPU and memory) with the problem.
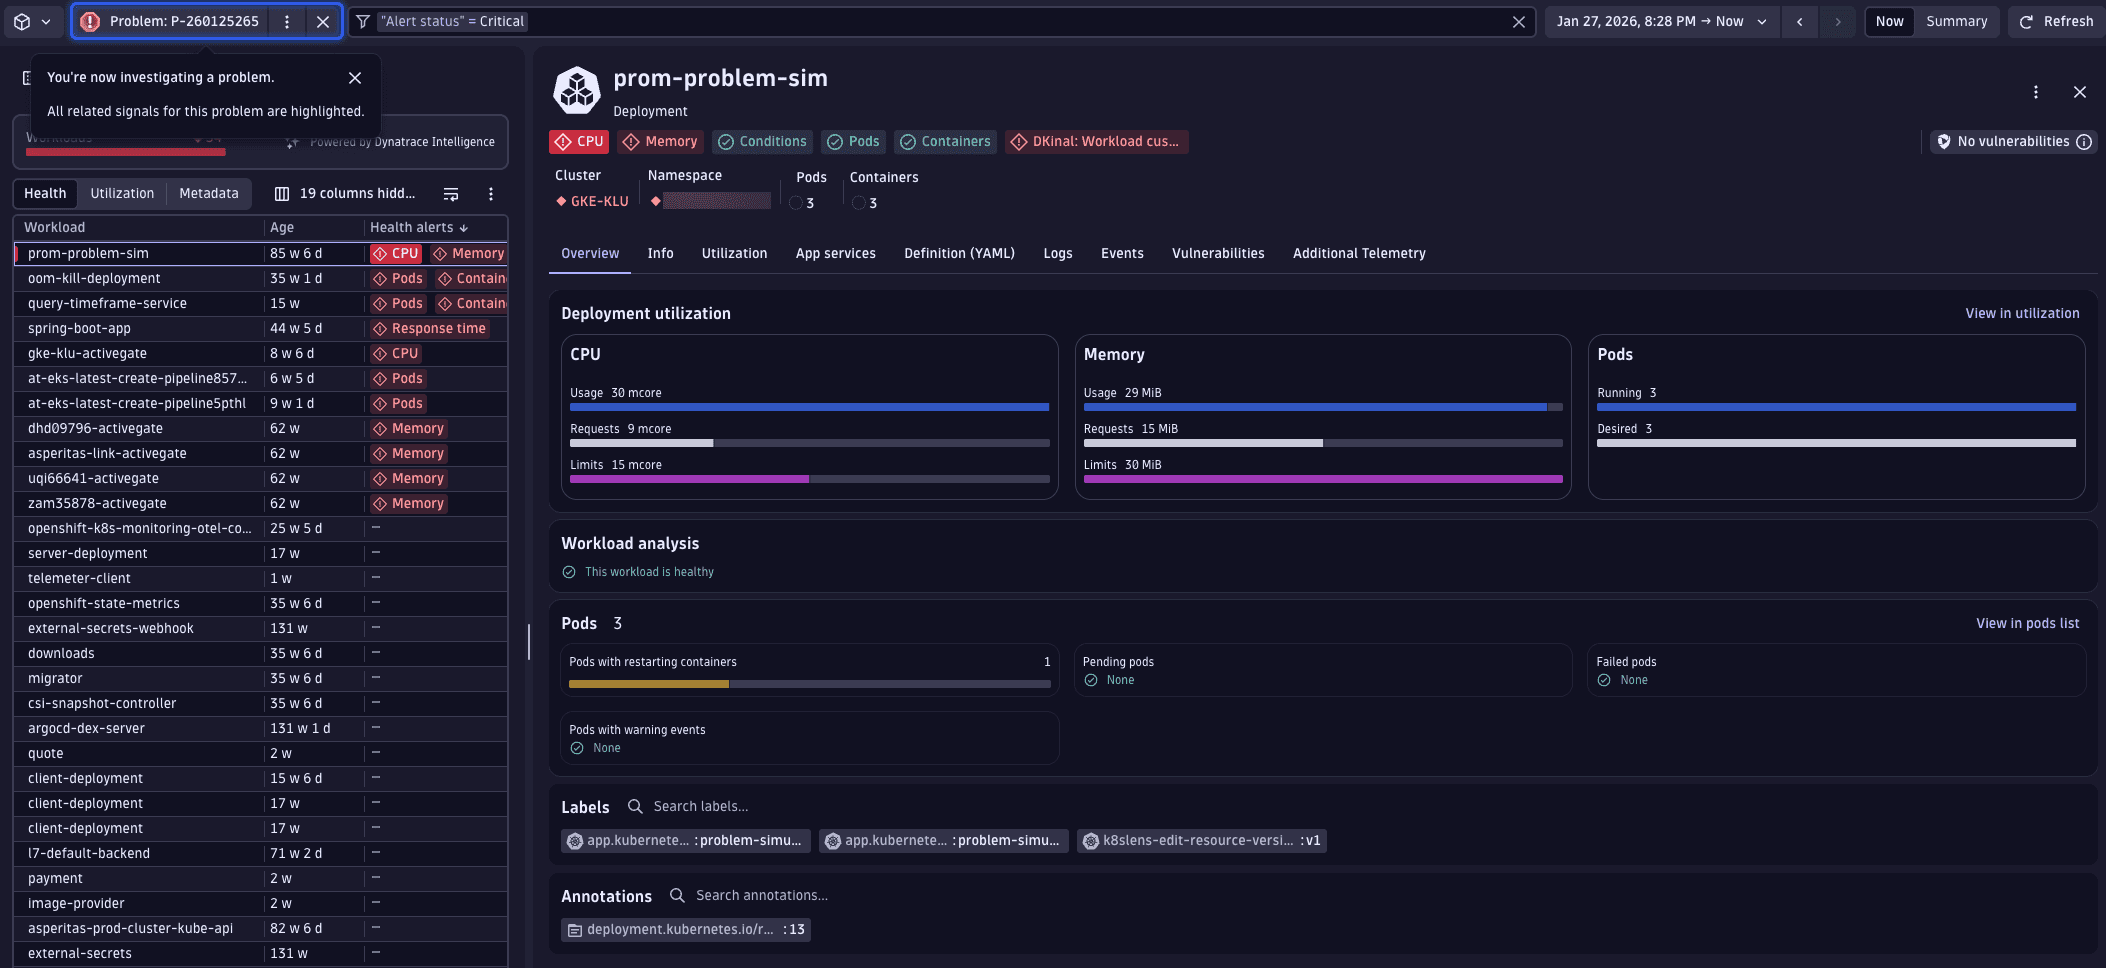
While in problem mode, go to Utilization. Dynatrace automatically highlights the affected resource (for example, CPU) and overlays the problem on the corresponding chart. This helps you see how resource usage relates to the active problem.
The Events tab presents a graph displaying the number of recent events by type, alongside a table detailing these events.
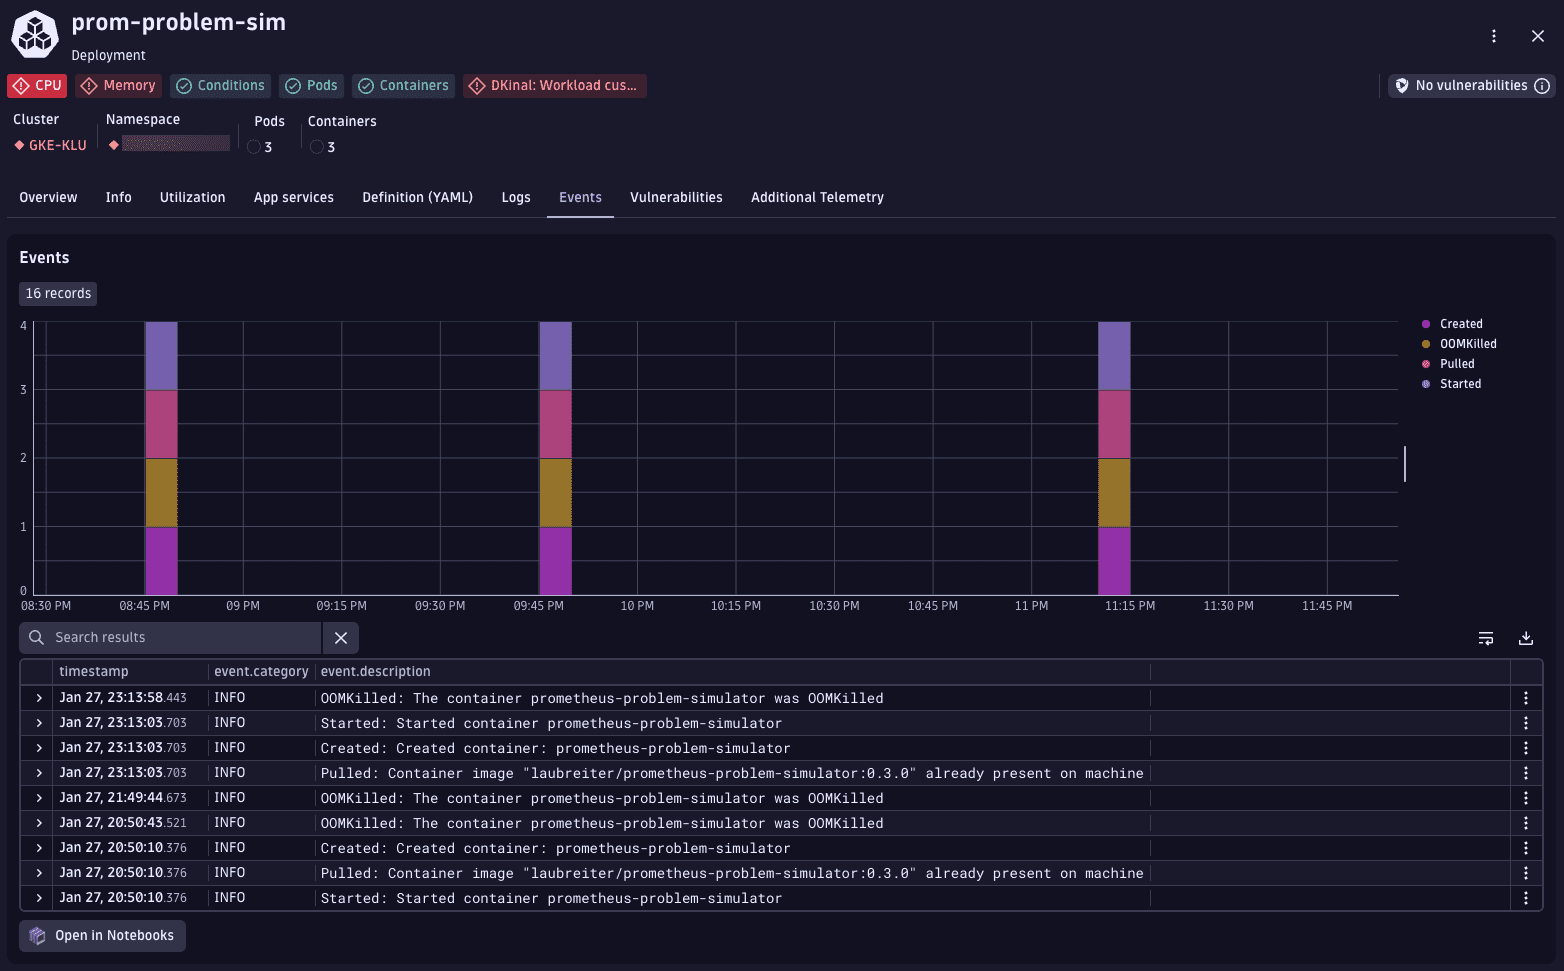
Below the chart, the event list provides detailed platform messages such as OOMKilled, followed by the Created and Started container events. This sequence indicates that the container exceeded its memory limit and was terminated by Kubernetes.
3. Resolve workload problems
The event timeline shows repeated grouped events that represent container restarts. In the event list, OOMKilled entries are followed by the Created and Started events for the prometheus-problem-simulator container. This sequence indicates that the container exceeded its memory limit, was terminated by kubelet, and then automatically recreated by Kubernetes.
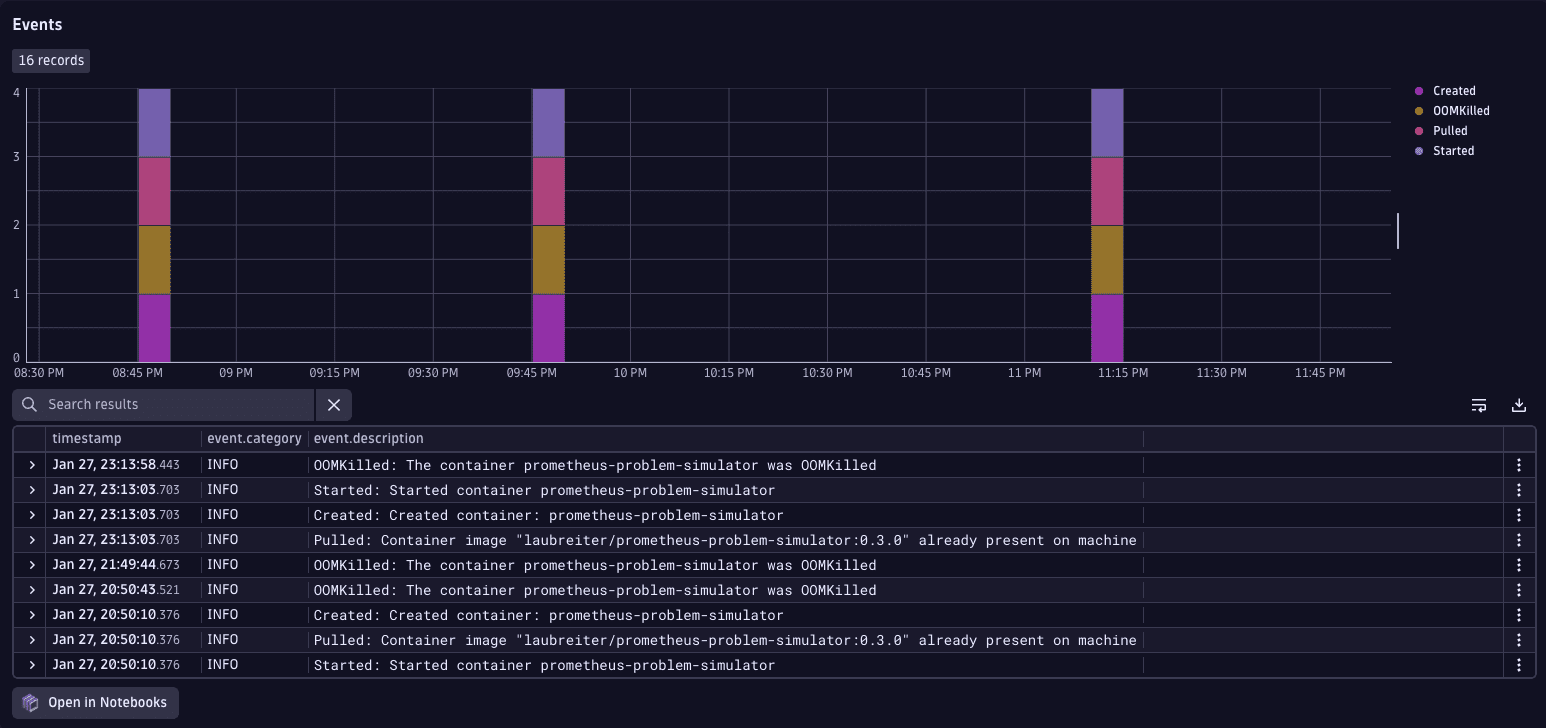
Use this information to understand how the workload behaves over time and identify recurring container lifecycle events that contribute to the problem.
4. Investigate infrequent workload problems
Most problems can be found and investigated by following the steps outlined above. However, some issues might be more complex because they don't happen regularly or occur far apart. Dynatrace helps in overcoming these challenges by highlighting key metrics and providing insightful highlights in ") Kubernetes.
Kubernetes.
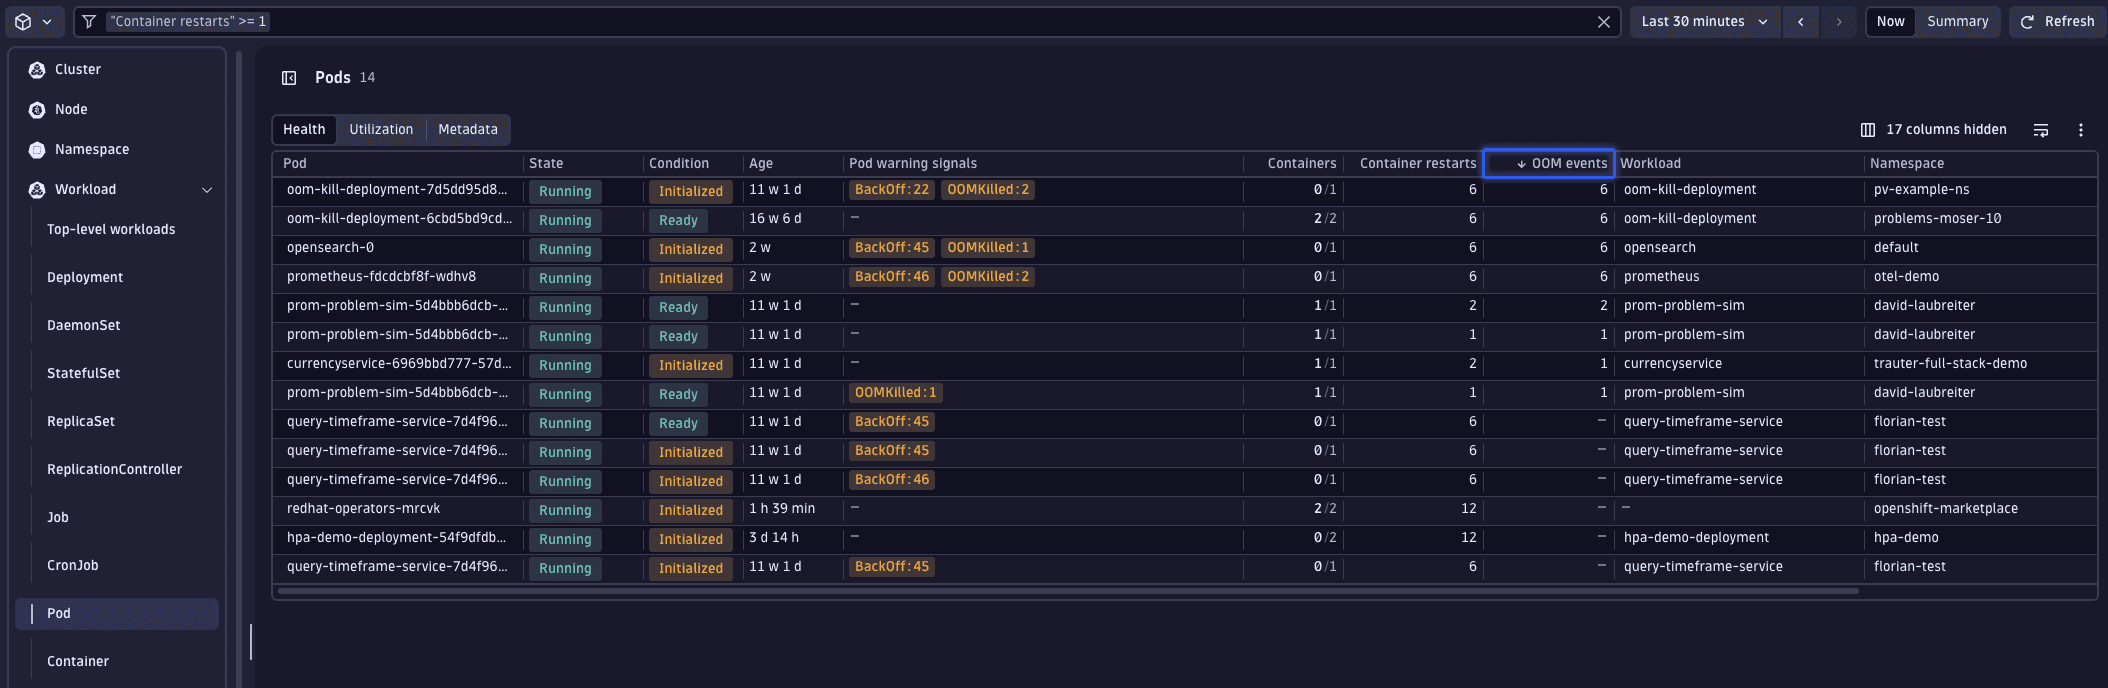
A common and potentially troublesome issue involves containers being OOM killed. Dynatrace can help you detect such incidents. Within the workload list's health perspective, there's a specific column displaying OOM kill events for each workload.
Given that Kubernetes displays the current state of your Kubernetes environment, we can leverage the power of DQL for identifying workloads with OOM kills over any selected timeframe.
This is achieved using  Notebooks, where the following DQL query is added.
// Aggregate OOM kills per pod over timetimeseries values = sum(dt.kubernetes.container.oom_kills, rollup:sum),by:{ dt.smartscape.k8s_pod },filter: isNotNull(dt.smartscape.k8s_pod)// calculate total OOM kills and retain pod id for lookup| fieldsAdd container_oom_kills = toLong(arraySum(values)), dt.smartscape.k8s_pod// fetch pod metadata| lookup [smartscapeNodes { K8S_POD }], sourceField: dt.smartscape.k8s_pod, lookupField:id, fields:{k8s.workload.name, k8s.workload.kind, name, type}, executionOrder:leftFirst// select fields for the result| fields dt.smartscape.k8s_pod, type, k8s.workload.name, k8s.workload.kind, name, container_oom_kills// order by OOM kill count in descending order| sort container_oom_kills desc
This query generates a table listing workloads that had OOM kills within the last 7 days, including details on whether they have memory limits set and if those limits have changed during the timeframe.
Related topics
Kubernetes