OS services monitoring
- Latest Dynatrace
- How-to guide
- 14-min read
- Published Sep 30, 2026
OS services monitoring gives you visibility into the status and availability of Windows and Linux operating system services, such as system daemons and other background processes that keep your hosts running. Dynatrace monitors OS service availability automatically, without additional configuration, and you can define custom alerting policies to detect failures, such as a service unexpectedly stopping or failing to start.
You can monitor hosts in Full-Stack monitoring mode or Infrastructure monitoring mode. In Discovery mode, you get only the OS service status, which you can use for basic alerting but not for the availability metric. For details, see OneAgent monitoring modes.
Prerequisites
- Linux systemd version 230+ is required on the monitored host to monitor relations between processes and OS services.
- Linux systemd version 250+ is required on the monitored host for improved OS service detection performance by less frequent refreshes.
Monitor a service
Access OS services monitoring
- Settings are defined at the environment level by default.
- The host group level inherits all settings from the environment. Additionally, you can add configurations for specific host groups.
- The host level inherits all settings from the host group. Additionally, you can add configurations for specific hosts.
-
Go to
 Settings > Analyze and alert > Alerts > OS services monitoring.
This opens the environment-level settings by default.
-
Optional To configure a specific host group or host instead, select Go to scope, and then select the host group or host you want to configure. To return to the environment-level settings from a host group or host, select Go to environment.
Add service monitoring policy
A service monitoring policy defines how Dynatrace monitors your service, based on the service state and the detection rules you configure. By default, Dynatrace comes with Auto-start Windows OS Services and Auto-start Linux OS Services policies for auto-started Windows and Linux services with failed status.
Policy order matters as Dynatrace evaluates policies from top to bottom and stops at the first match, so place more specific policies above broader ones. For example, a policy that excludes non-Microsoft manufacturers above a broader policy that monitors all auto-started services.
The default limit of OS Service entities is 100,000 per cluster. See Limitations for details on staying within this limit.
-
On OS services monitoring for the level you are configuring, select New policy.
-
Fill in the General section:
-
Rule name
Enter the name that will be displayed in the Summary field.
-
Operating system
Select your operating system.
-
Monitor
Decide whether to monitor service availability using the OS service availability (
builtin:osservice.availability) metric. If available, the metric sends the service status every ten seconds. The Service status (os_service.status) dimension carries the status.The metric consumes data points. For details, see Metrics powered by Grail.
The Monitor option is not available for hosts in Discovery mode.
-
Alert
Decide whether you want alerting for your policy. The following fields are shown only when Alert is turned on.
-
Alert if service is not installed
Whether you want to receive alerts about OS services that are not installed on the host.
-
Service status condition for alerting
Set the service status for which an alert should be triggered.
You can use logic operations to monitor the service status. For example,
$eq(running)monitors the running service state.Available logic operations:
$not($eq(paused))– Matches services that are in state different from paused.$or($eq(paused),$eq(running))– Matches services that are either in paused or running state.
These are the service statuses you can monitor. Use one of the following values as a parameter for this condition:
runningstoppedstart_pendingstop_pendingcontinue_pendingpause_pendingpaused
-
Optional Alerting delay
The number of 10-second measurement cycles for a service to be in configured state before an event is generated. Each unit equals 10 seconds (value × 10s), for example,
1is 10 seconds (fastest) and30is 5 minutes. This doesn't apply to alerts for services that are not installed.
-
To add detection rules, see Configure detection rules.
To add properties, see Add properties.
Configure detection rules
You can add up to 100 alerts. At least one alert is required, and at least one non-host scope detection rule must be defined.
-
Select Add rule, and then select Host or OS Service for the scope of the detection rule.
-
Rule scope: Change the scope of the rule between Host and OS Service, if needed.
If you selected Host:
-
Resource attribute used for matching:
-
Key specifies the metadata key you want to match
-
Condition in which you can define a string that:
- Dynatrace version 1.310+
$match(ver*_1.2.?)– Matches string with wildcards. Use*for any number of characters (including zero) and?for exactly one character. $contains(production)– Matches if production appears anywhere in the host metadata value.$eq(production)– Matches if production matches the host metadata value exactly.$prefix(production)– Matches if production matches the prefix of the host metadata value.$suffix(production)– Matches if production matches the suffix of the host metadata value.
Available logic operations:
$not($eq(production))– Matches if the host metadata value is different from production.$and($prefix(production),$suffix(main))– Matches if host metadata value starts with production and ends with main.$or($prefix(production),$suffix(main))– Matches if host metadata value starts with production or ends with main.
When including special characters such as brackets
(and)within your matching expressions, escape these characters with a tilde~. For example, to match a metadata value that includes brackets, likemy(amazing)property, you would write$eq(my~(amazing~)property).Conditions are case insensitive.
- Dynatrace version 1.310+
-
If you selected OS Service, proceed according to your operating system.
-
Service property used for matching:
- Display name visible for system user.
- Path to the binary used by OS service.
- Manufacturer from the binary file of the service.
- Service Name
- Startup Type
A monitoring rule may consist of multiple detection rules. All detection rules must be satisfied for the OS Service to match, because a logical AND operation applies across all specified conditions.
Additional information on Display name, Path, Manufacturer, and Service Name
Use these properties to define the services to monitor based on:
-
Display name visible to a system user
-
Path to the service binary
-
Manufacturer of the service
-
Service name representing the name or ID under which OS service is recognized
-
Condition in which you can define a string that:
- Starts with – use
$prefixqualifier, for example$prefix(ss). - Ends with – use
$suffixqualifier, for example$suffix(hd). - Equals – use
$eqqualifier, for example$eq(sshd). - Contains – use
$containsqualifier, for example$contains(ssh). - Dynatrace version 1.310+ Matches – use
$matchqualifier, for example$match(ip?tables*), where*matches any number of characters (including zero) and?matches exactly one character.
Available logic operations:
$not($eq(sshd))– Matches if the service's property value is different fromsshd.$and($prefix(ss),$suffix(hd))– Matches if service's property value starts withssand ends withhd.$or($prefix(ss),$suffix(hd))– Matches if service's property value starts withssor ends withhd.
When including special characters such as brackets
(and)within your matching expressions, escape these characters with a tilde~. For example, to match a property value that includes brackets, likemy(amazing)property, you would write$eq(my~(amazing~)property).Conditions are case insensitive.
- Starts with – use
Additional information on Startup Type
Use this property to define which services to monitor based on their startup type.
-
Condition in which you can define a string that:
- Equals – use
$eqqualifier, for example$eq(manual).
Available logic operations:
$not($eq(auto))– Matches services with startup type different from Automatic.$or($eq(auto),$eq(manual))– Matches if service's startup type is either Automatic or Manual.
Use one of the following values as a parameter for this condition:
manualfor Manual - the service starts only if needed or if you invoke something to start the service.manual_triggerfor Manual (Trigger Start) - the service starts along with the startup of another service.autofor Automatic - the service starts automatically.auto_delayfor Automatic (Delayed Start) - the service startup is delayed until the system has finished booting.auto_triggerfor Automatic (Trigger Start) - the service starts automatically on startup and may be started or stopped due to certain operating system events.auto_delay_triggerfor Automatic (Delayed Start, Trigger Start)disabledfor Disabled
- Equals – use
Add properties
Optional
-
Select Add property.
-
Specify a custom key-value property for the policy.
For example, you can use a property to add a custom message in the Event details.
Deprecated:dt.osservice.*fieldsOneAgent version 1.341+ The
dt.osservice.*fields are deprecated. Use the equivalentos_service.*fields instead.The deprecated
dt.osservice.*fields will eventually be removed.For example, a property with a Key set to
custom.messageand Value set toThe {os_service.name} is with status {os_service.status}(including placeholders{os_service.name},{os_service.status}, and{os_service.display_name}) will extract the OS service name and status values once the rule is triggered. If the placeholder substitution fails, both the key and the value will be unavailable.Additionally, you can use specific dt flags in the Key field to tailor the behavior of problem notifications and Davis AI analysis:
dt.event.title: Customizes the title of the problem.dt.event.description: Provides a detailed description for the problem.dt.event.allow_davis_merge: Controls how Davis AI decides to merge events, based on your settings.
-
Select Save.
Manage monitored OS services
-
Go to OS services monitoring for the level you want to manage. For details, see Access OS services monitoring.
-
Your policies are displayed in a table under the New policy button. Use Search or the Status filter to find a policy.
- To stop monitoring the services matched by a policy, turn its Status toggle off.
- To edit or delete a policy, select in its row, and then select Edit or Delete.
Configure at scale using Settings API
You can use the Settings API to configure your service availability monitoring at scale.
- To learn the schema, use GET a schema with
builtin:os-services-monitoringas the schemaId. - Based on the
builtin:os-services-monitoringschema, create your configuration object. - To create your configuration, use POST an object.
Learn more about alerting options
Depending on your monitoring requirements, you can choose between basic or advanced alerting of OS services. The Discovery mode allows only basic alerting, while the Full-Stack and Infrastructure monitoring modes also allow advanced alerting.
Basic alerting (Service status)
Basic alerting provides insight only into the service status. The system monitors an OS service's current status and alerts you when it changes from running to failed.
With the os_service.status field on OS_SERVICE nodes in  Smartscape, you can query the current status of the service.
Example
smartscapeNodes OS_SERVICE| fields os_service.name, os_service.status

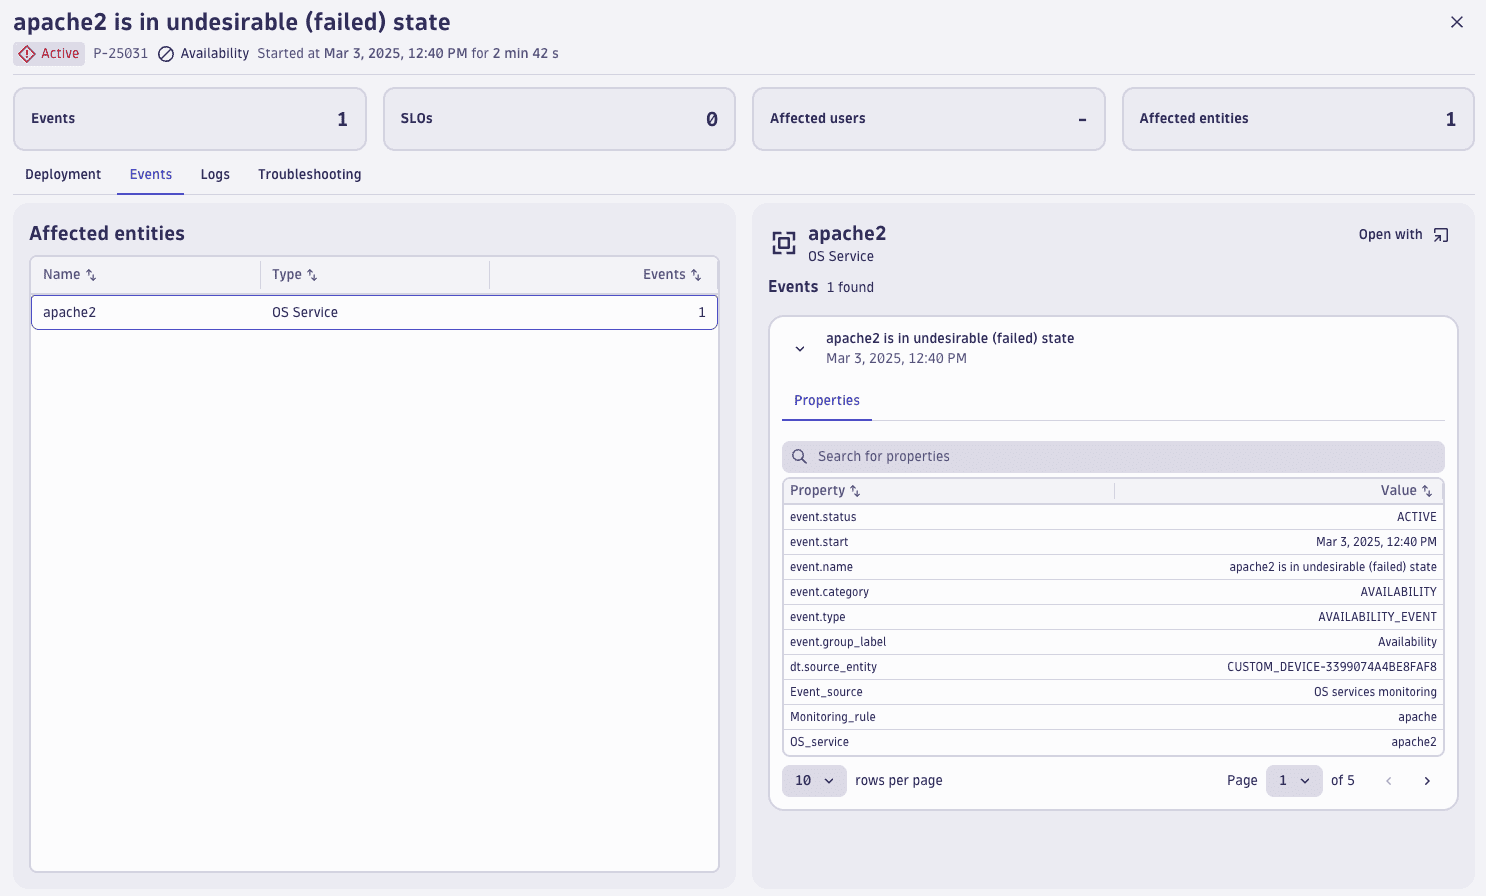
If the alert is enabled, events and problems are created when a service status changes, such as when a service goes from running to failed.
Failed service alert
Advanced alerting (Service availability metric)
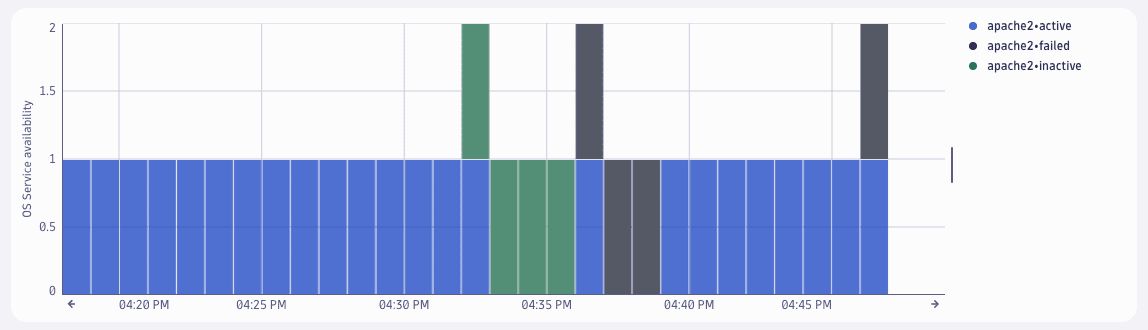
Advanced alerting provides access to the service status and the service availability metric. In addition to OS service status changes, you get more granular information about service availability on a per-minute basis. This enables more complex business logic, for example, if you want to be notified if a service is stopped for longer than 10 minutes. You can create alerting rules to monitor availability and trigger an alert when needed.
Example
dt.osservice.* fieldsOneAgent version 1.341+ The dt.osservice.* fields are deprecated. Use the equivalent os_service.* fields instead.
The deprecated dt.osservice.* fields will eventually be removed.
timeseries count(os_service.availability),by:{os_service.display_name, os_service.status}| filter os_service.display_name=="apache2"
Limitations
On Linux, systemd OS services with the following startup types are supported:
enabledenabled-runtimestaticdisabledindirectlinkedlinked-runtime
The default limit of OS Service entities is 100,000 per cluster. In larger environments with many hosts, create precise detection rules that match only the important services for your infrastructure. Rules that are too general (for example, matching all services on thousands of hosts) may reach this limit (entity explosion), causing OS services to disappear from Dynatrace. Use Auto-start Windows OS Services and Auto-start Linux OS Services as a starting point for refining your policies.
 Infrastructure & Operations