SNMP Traps extension
- Latest Dynatrace
- Extension
Supplement network monitoring with event-based data reported via SNMP traps.
Get started
Overview
Use SNMP traps to gain more details about the health state of your network devices.
Add event-based data to all metrics reported in combination with dedicated SNMP extensions. This lets you diagnose performance and availability issues even better.
Use cases
- Topology for SNMP trap devices, derived from the IP address of the agent that send the traps.
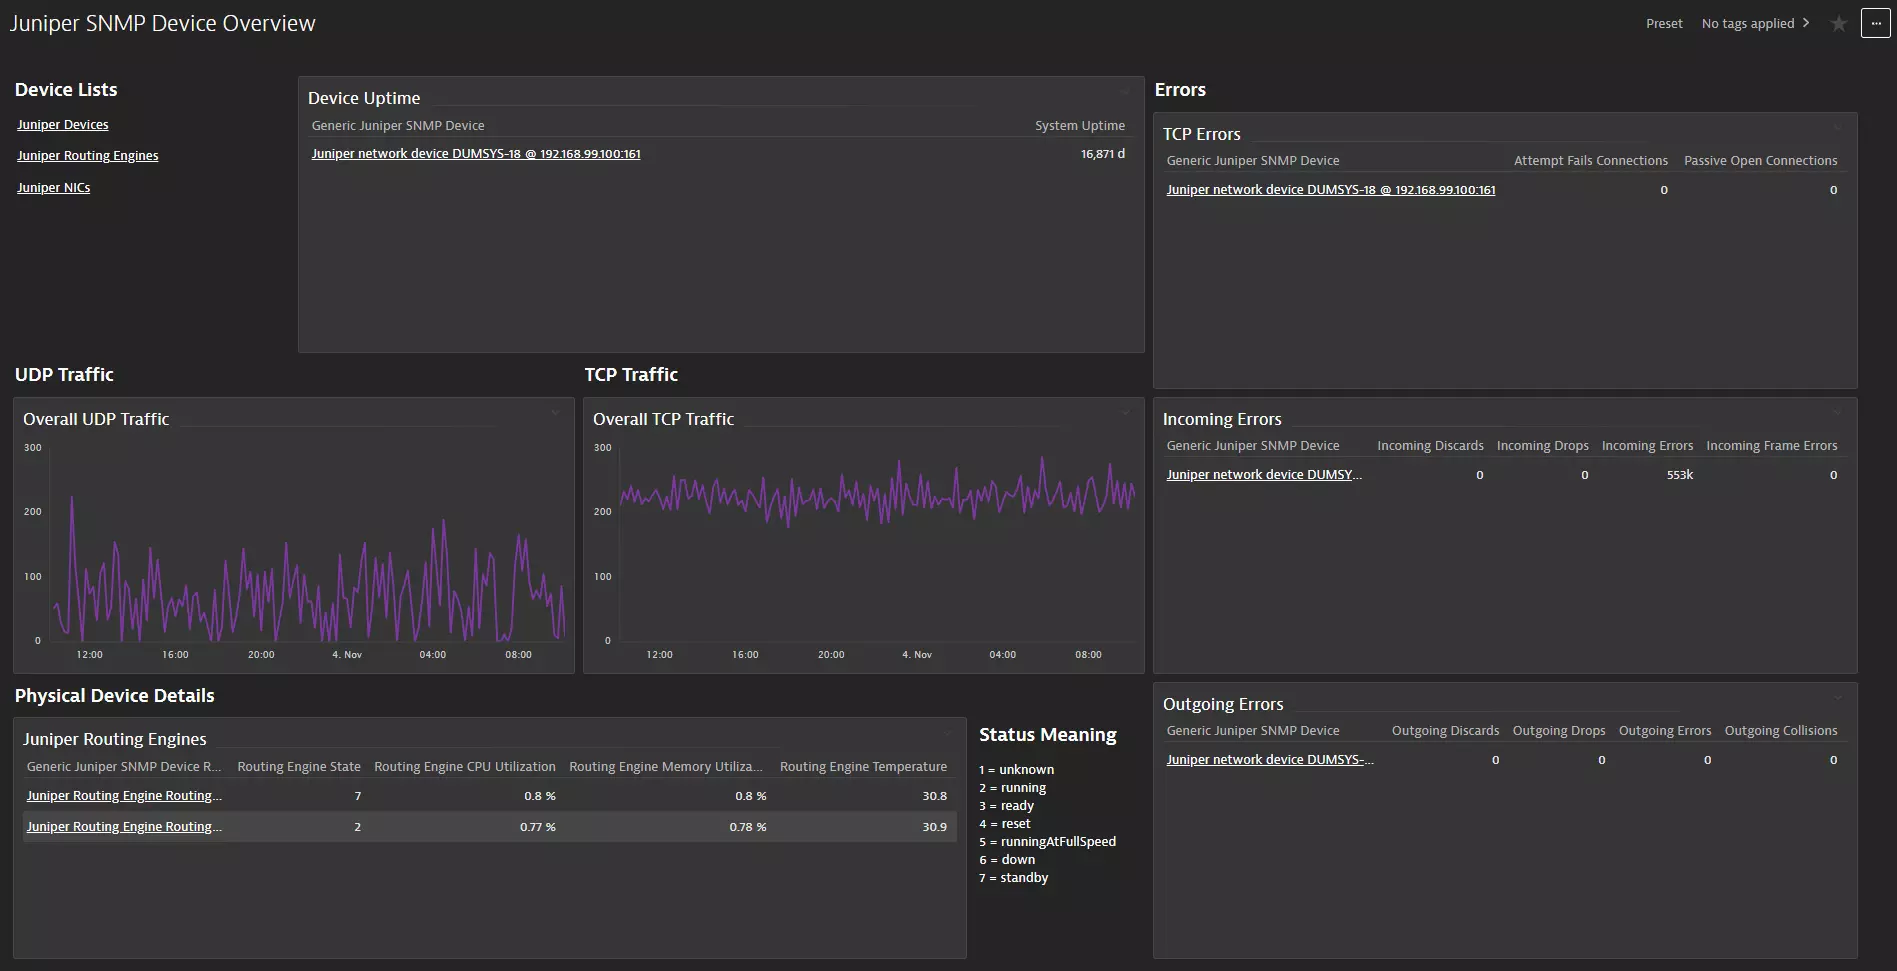
- A dashboard that offers a monitoring overview for the SNMP traps that are received by the extension.
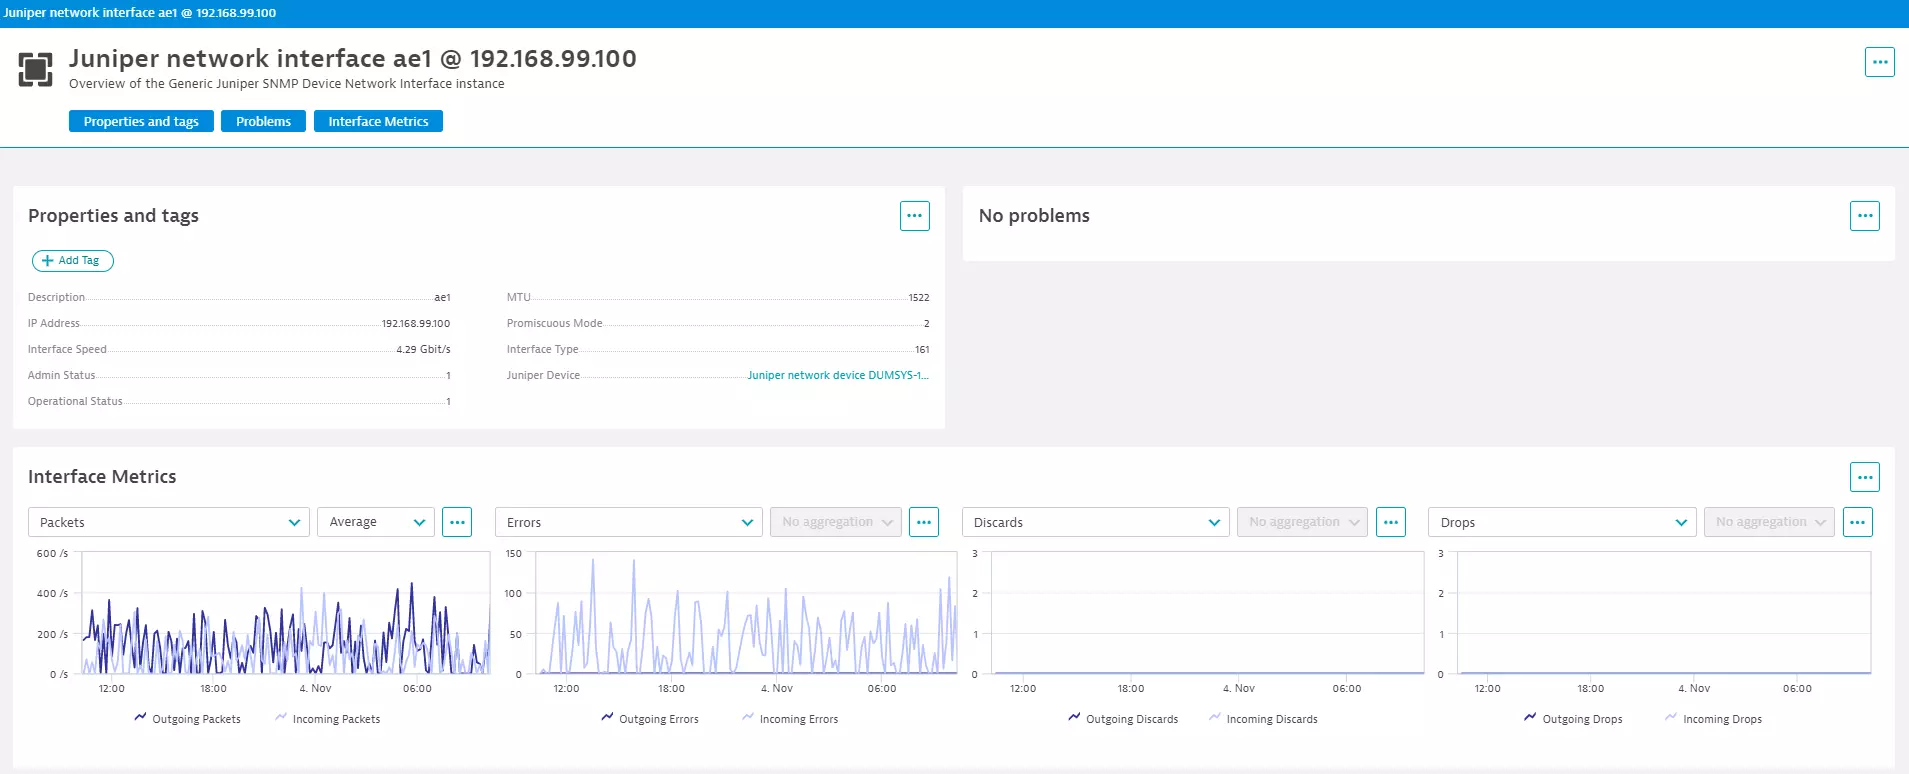
- A Unified Analysis page for SNMP trap devices.
- Log ingestion for SNMP traps. SNMP Traps are received immediately and ingested as logs.
- Track number of traps reported by their types, so that you can enable alerting for issues such as port flapping.
- Review individual events reported by the SNMP devices, so that you have more details that explain metric anomalies.
- Get unified visibility for metrics and traps.
Compatibility information
- Supports SNMPv1, SNMPv2(c), and SNMPv3.
- Event forwarding is not supported.
Activation and setup
To enable the extension, find SNMP Traps in the Dynatrace Hub.
To enable log ingestion, select the Events feature set in the monitoring configuration.
Details
Licensing and costs
There is no charge to use the extension. You are only charged for the data that the extension ingests.
The SNMP Traps extension ingests custom metrics, which consume Davis Data Units (DDUs) (Dynatrace classic license) or Metrics powered by Grail (DPS), according to your license model.
This extension collects a count of SNMP traps each minute. Events are ingested as metric data points and as logs.
To estimate the amount of metric data points produced by your extension configuration, use the following list. This gives you:
- a number of metrics per feature set.
- a multiplier value depending on which entity the metric is split by.
Add all of these up and you will have the number of data points produced every minute.
Events1 * SNMP traps devices
Dynatrace Platform Subscription
In the Dynatrace Platform Subscription, metric ingestion consumes Metrics powered by Grail according to the number of ingested metric data points.
To calculate the approximate yearly consumption, apply the following calculation: <metric data points per minute> * 60 minutes * 24 hours * 365 days.
For the example above: 1 * 60 * 24 * 365 = 525,600 metric data points per year.
For logs, regular consumption applies. See Log Management and Analytics.
Dynatrace classic license
In the classic licensing model, metric ingestion consumes Davis Data Units (DDUs) at the rate of .001 DDUs per metric data point. Multiply the above formula for annual data points by .001 to estimate annual DDU usage.
For the example above: 1 * 60 * 24 * 365 * 0.001 = 525.6 DDUs per year.
For logs, regular DDU consumption applies. See DDU consumption for Log Management and Analytics or DDUs for Log Monitoring Classic.
The DDU cost above does not include any possible log events or custom events that are triggered by the extension. For more information, see DDU events.
Feature sets
When activating your extension using a monitoring configuration, you can limit monitoring to one of the feature sets. To work properly, the extension has to collect at least one metric after the activation.
In highly segmented networks, feature sets can reflect the segments of your environment. Then, when you create a monitoring configuration, you can select a feature set and a corresponding ActiveGate group that can connect to this particular segment.
All metrics that aren't categorized into any feature set are considered to be the default and are always reported.
A metric inherits the feature set of a subgroup, which in turn inherits the feature set of a group. Also, the feature set defined on the metric level overrides the feature set defined on the subgroup level, which in turn overrides the feature set defined on the group level.
Events
| Metric name | Metric key | Description |
|---|---|---|
| Traps count | com.dynatrace.extension.snmp-traps-generic.traps.count | Number of traps received. |
FAQ
- To troubleshoot this extension, use the guide at Troubleshooting.
- For more information about configuring the SNMP trap extension, see SNMP traps data source.
