SNMP Autodiscovery extension
- Latest Dynatrace
- Extension
Discover SNMP-enabled network devices, ingest log records into Dynatrace, and map network topology to identify the best monitoring extension for each device.
Get started
Overview
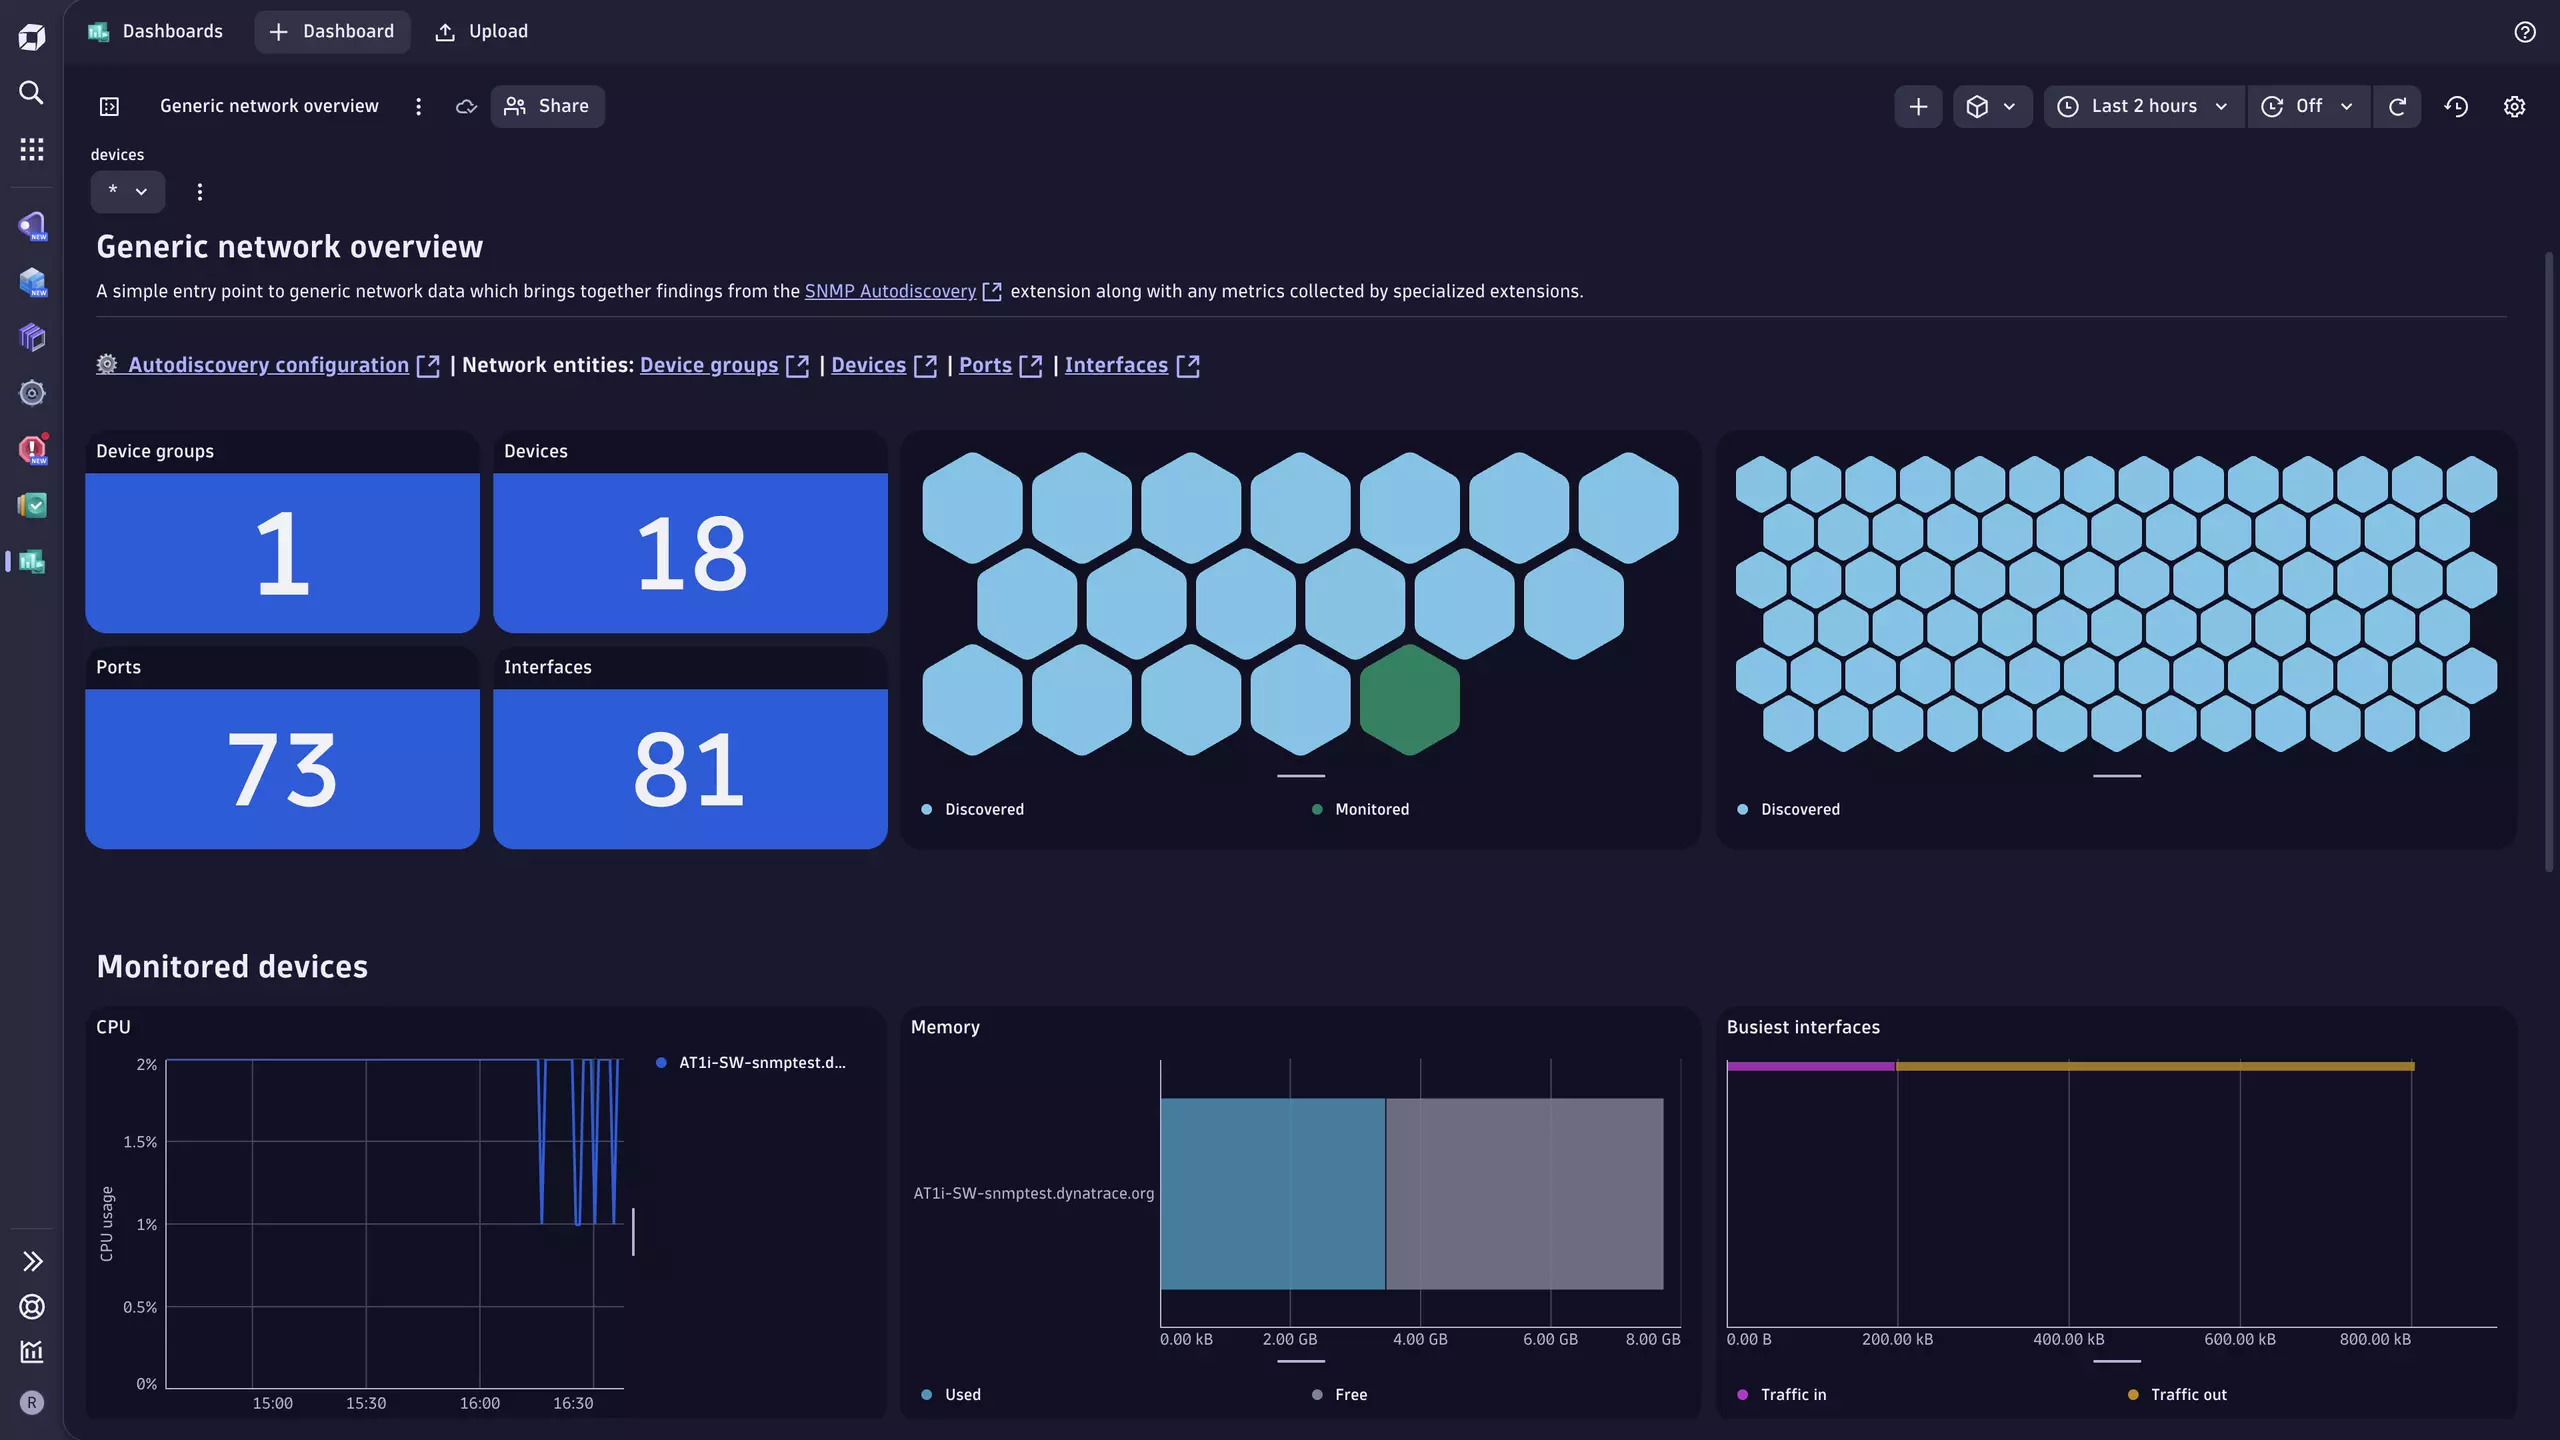
This ActiveGate extension takes subnets and ranges of IP addresses along with SNMP credentials and scans through them to discover SNMP-enabled network devices, reporting them as entities that serve as entry points to specialized extension configurations.
Use cases
- Simplify the onboarding of network device monitoring in Dynatrace.
- Build an inventory of SNMP-enabled network devices.
- Get a single-pane-of-glass view over all network devices, regardless of technology.
- Find out which Dynatrace extension can best monitor each device.
- Access all extension network data in one place.
- Understand which extensions Dynatrace recommends for further monitoring and insights.
- Enable the use of
 Discovery & Coverage to automatically set up network monitors and extension configurations for the discovered devices.
- Understand your extended network in terms of device-to-device connectivity, along with port and interface details.
Requirements
- Optional The LLDP or CDP protocol must be correctly configured on neighboring devices.
- You have created a monitoring configuration as described in Activation.
- A Dynatrace API token: A platform token with the
storage:buckets:readandstorage:smartscape:readscopes. This is required to enable additional processing of the ingested data. - The API routing module (
restInterface) needs to be enabled on the ActiveGate.
Compatibility information
-
ActiveGate version 1.280+
-
Dynatrace version 1.280+
-
SNMP v2c or v3. For supported parameters, see SNMP data source.
-
Currently, only devices monitored by the following extensions are part of the topology:
Activation and setup
To enable the extension, find SNMP Autodiscovery in the Dynatrace Hub.
Once activated in your environment, you need to create a monitoring configuration with the following parameters:
-
One or more discovery groups. Each group consists of:
-
Network segment: A name or label to indicate the subnet or network segment of which these devices are part.
-
One or more IPv4 or IPv6 configurations. Addresses can be:
-
A range, such as
10.0.0.0-10.0.2.0. -
A subnet in CIDR notation, such as
10.0.20.0/24.You can add individual addresses with a prefix length of
24or32.
-
-
The port for the SNMP connection.
-
The SNMP credentials:
- SNMP version.
- Specific credentials based on the version.
-
Timeout. Optional How long to wait for an SNMP response before abandoning a device. The default is 1 second. Only modify this value if you experience unnecessary timeout issues.
-
-
Discovery mechanism behavior:
- Scanning frequency: How frequently the scan runs, in minutes.
- Performance profile: Based on the performance profile of the ActiveGate. For more information, see About Extensions.
- Dynatrace token: A token used to query entities and topology data from Dynatrace, reducing scanner load and establishing additional relationships. A platform token with the
storage:buckets:readandstorage:smartscape:readscopes. - Neighbor discovery: When enabled, discovered devices are also queried for network neighbors via LLDP and CDP.
- Proxy configuration: Optional
When the ActiveGate requires a proxy to reach the Dynatrace API, you can either use the ActiveGate's
HTTPS_PROXYenvironment variable or manually specify a proxy URL with optional credentials. - Advanced configuration: Optional
For fine-grained control over the scanner's resource utilization, you can override the defaults set by the performance profile.
These settings override the built-in resource management and incorrect values may negatively impact ActiveGate performance.
- Maximum CPU usage: The CPU usage threshold above which the extension scales down the number of concurrent tasks.
- Maximum memory usage: The maximum amount of memory (in MB) the extension can use.
- Minimum concurrency: The lowest number of concurrent tasks the extension can be scaled down to.
- Maximum concurrency: The highest number of concurrent tasks the extension can be scaled up to.
-
Description: Required The name that appears as an attribute on the discovered devices.
Details
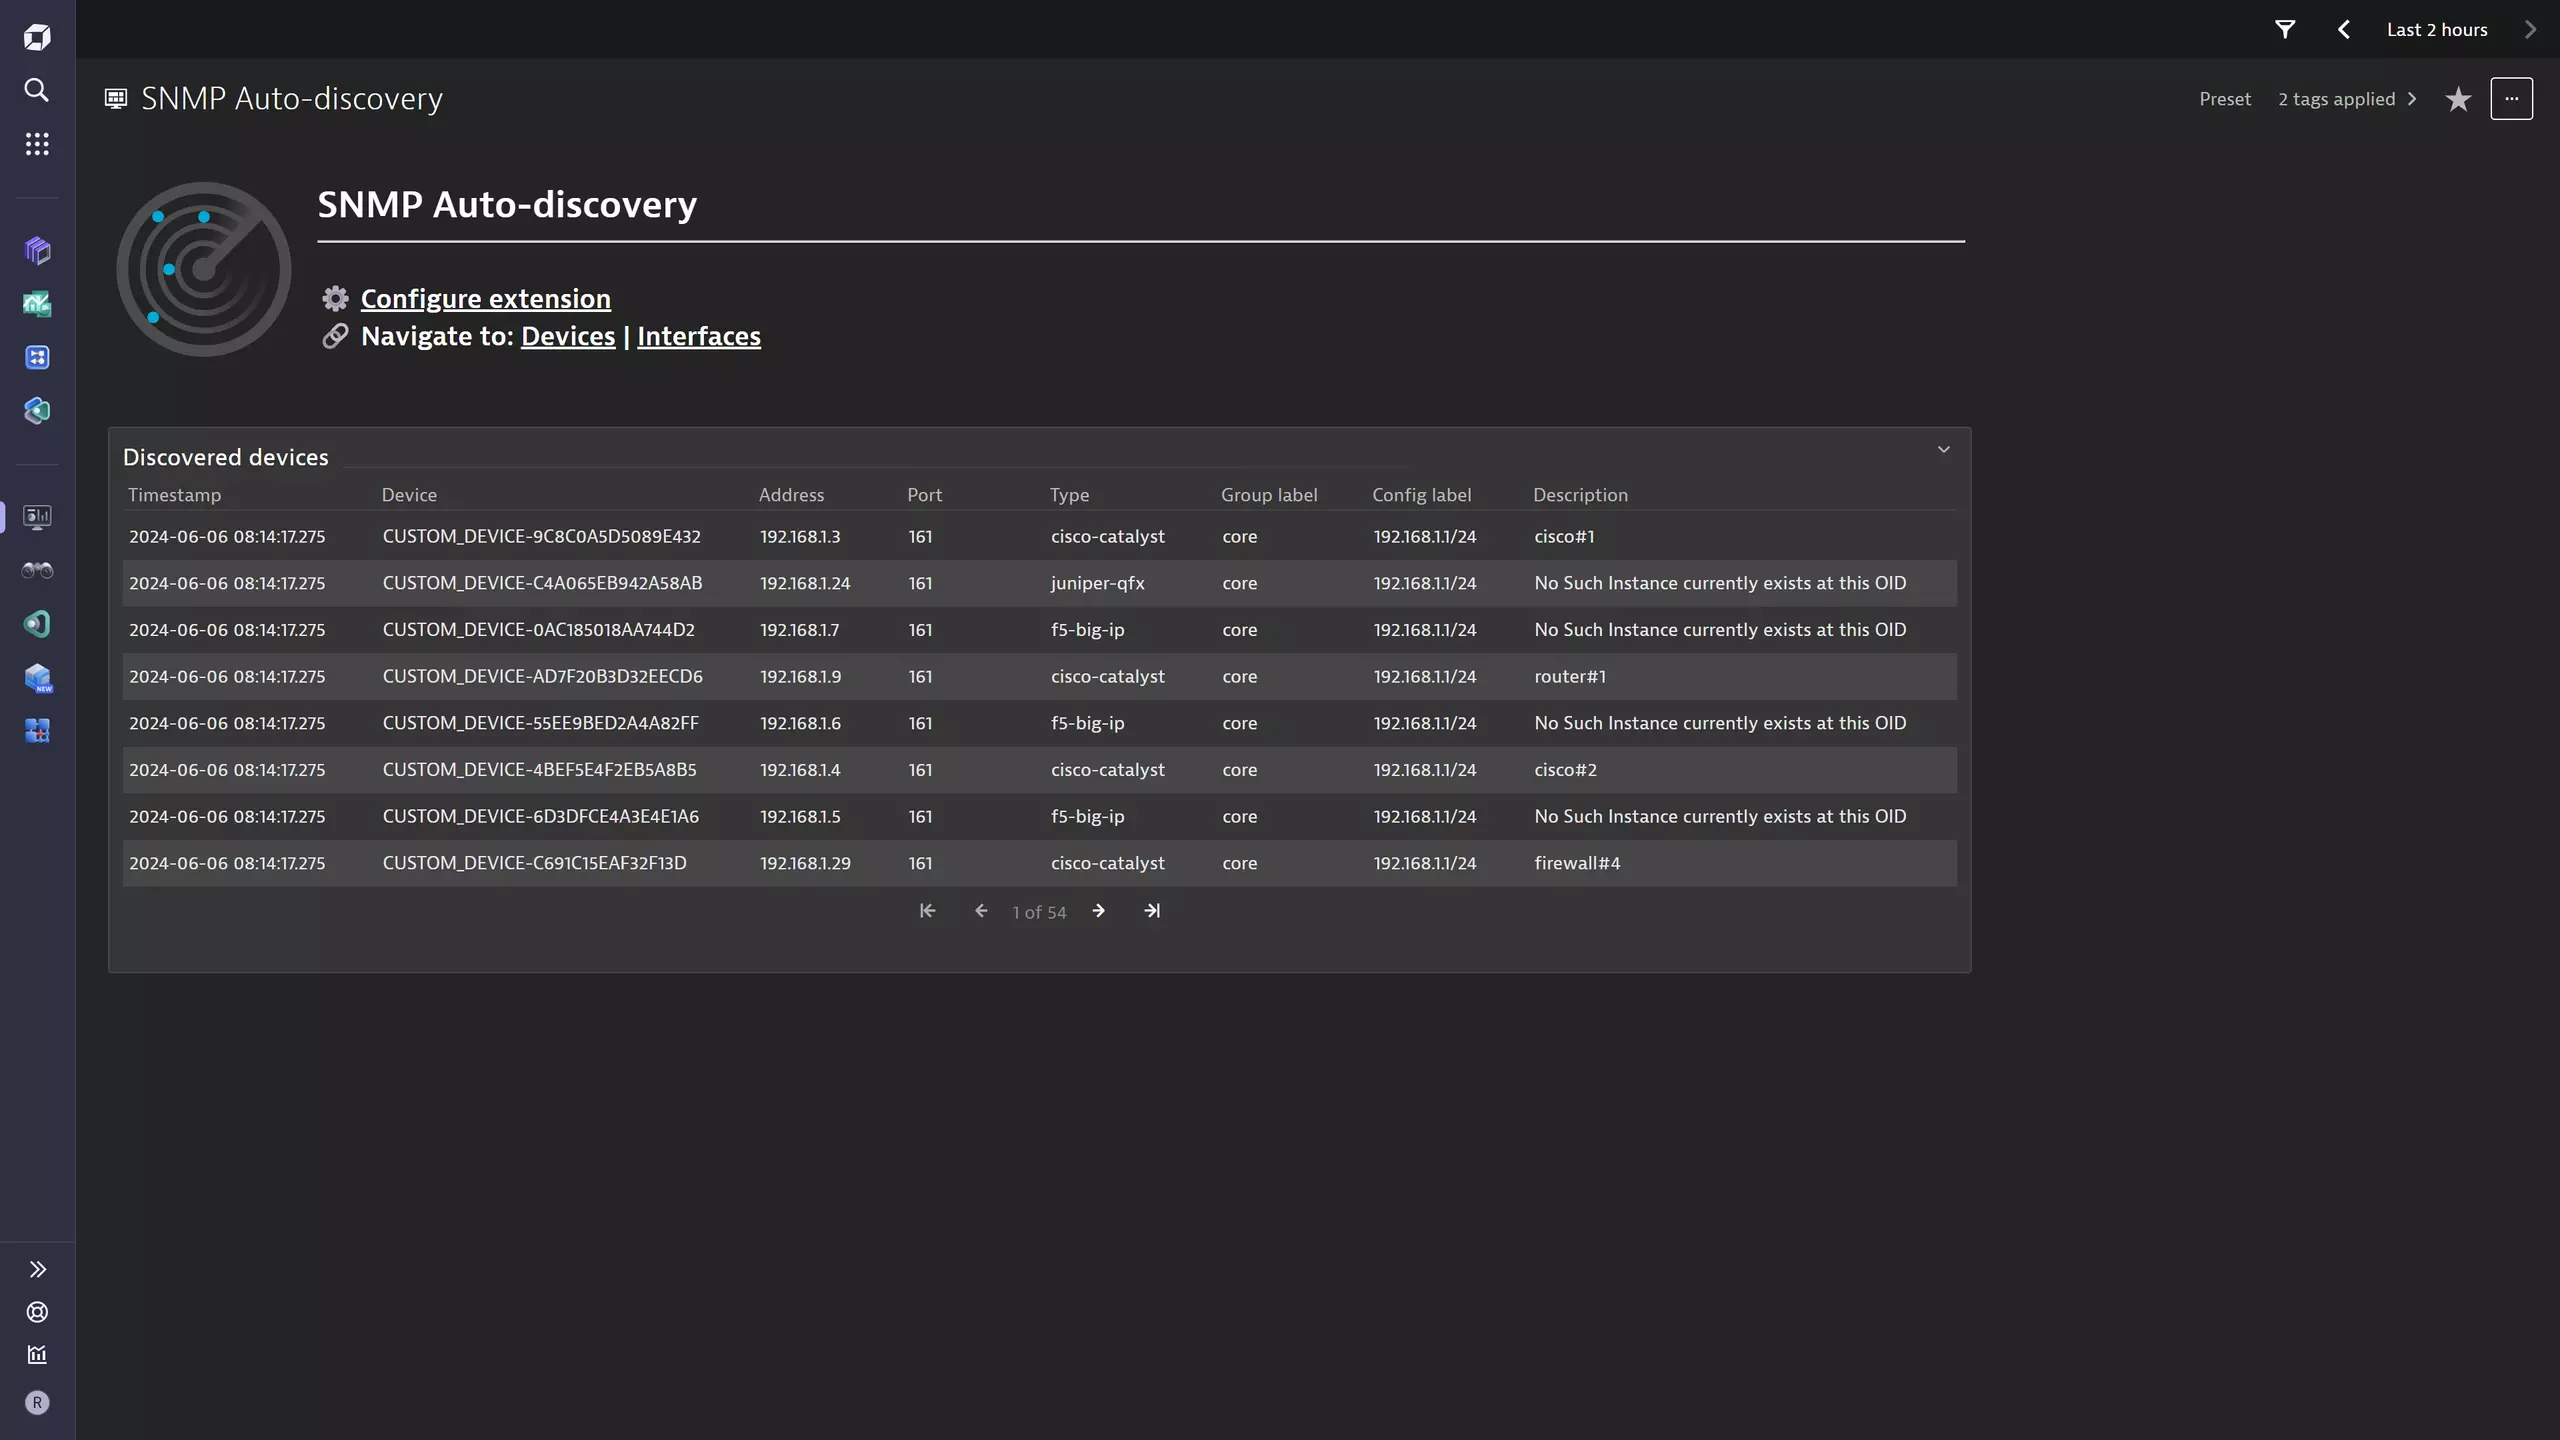
Once configured, the extension executes a simple snmpget request to any configured address and aims to extract six OIDs, which it ingests as a log record.
1.3.6.1.2.1.1.5: sysName1.3.6.1.2.1.1.1: sysDescr1.3.6.1.2.1.1.2: sysObjectId1.3.6.1.2.1.1.4: sysContact1.3.6.1.2.1.1.6: sysLocation1.0.8802.1.1.2.1.3.2: lldpLocChassisId1.3.6.1.4.1.9.9.23.1.3.4: cdpGlobalDeviceId
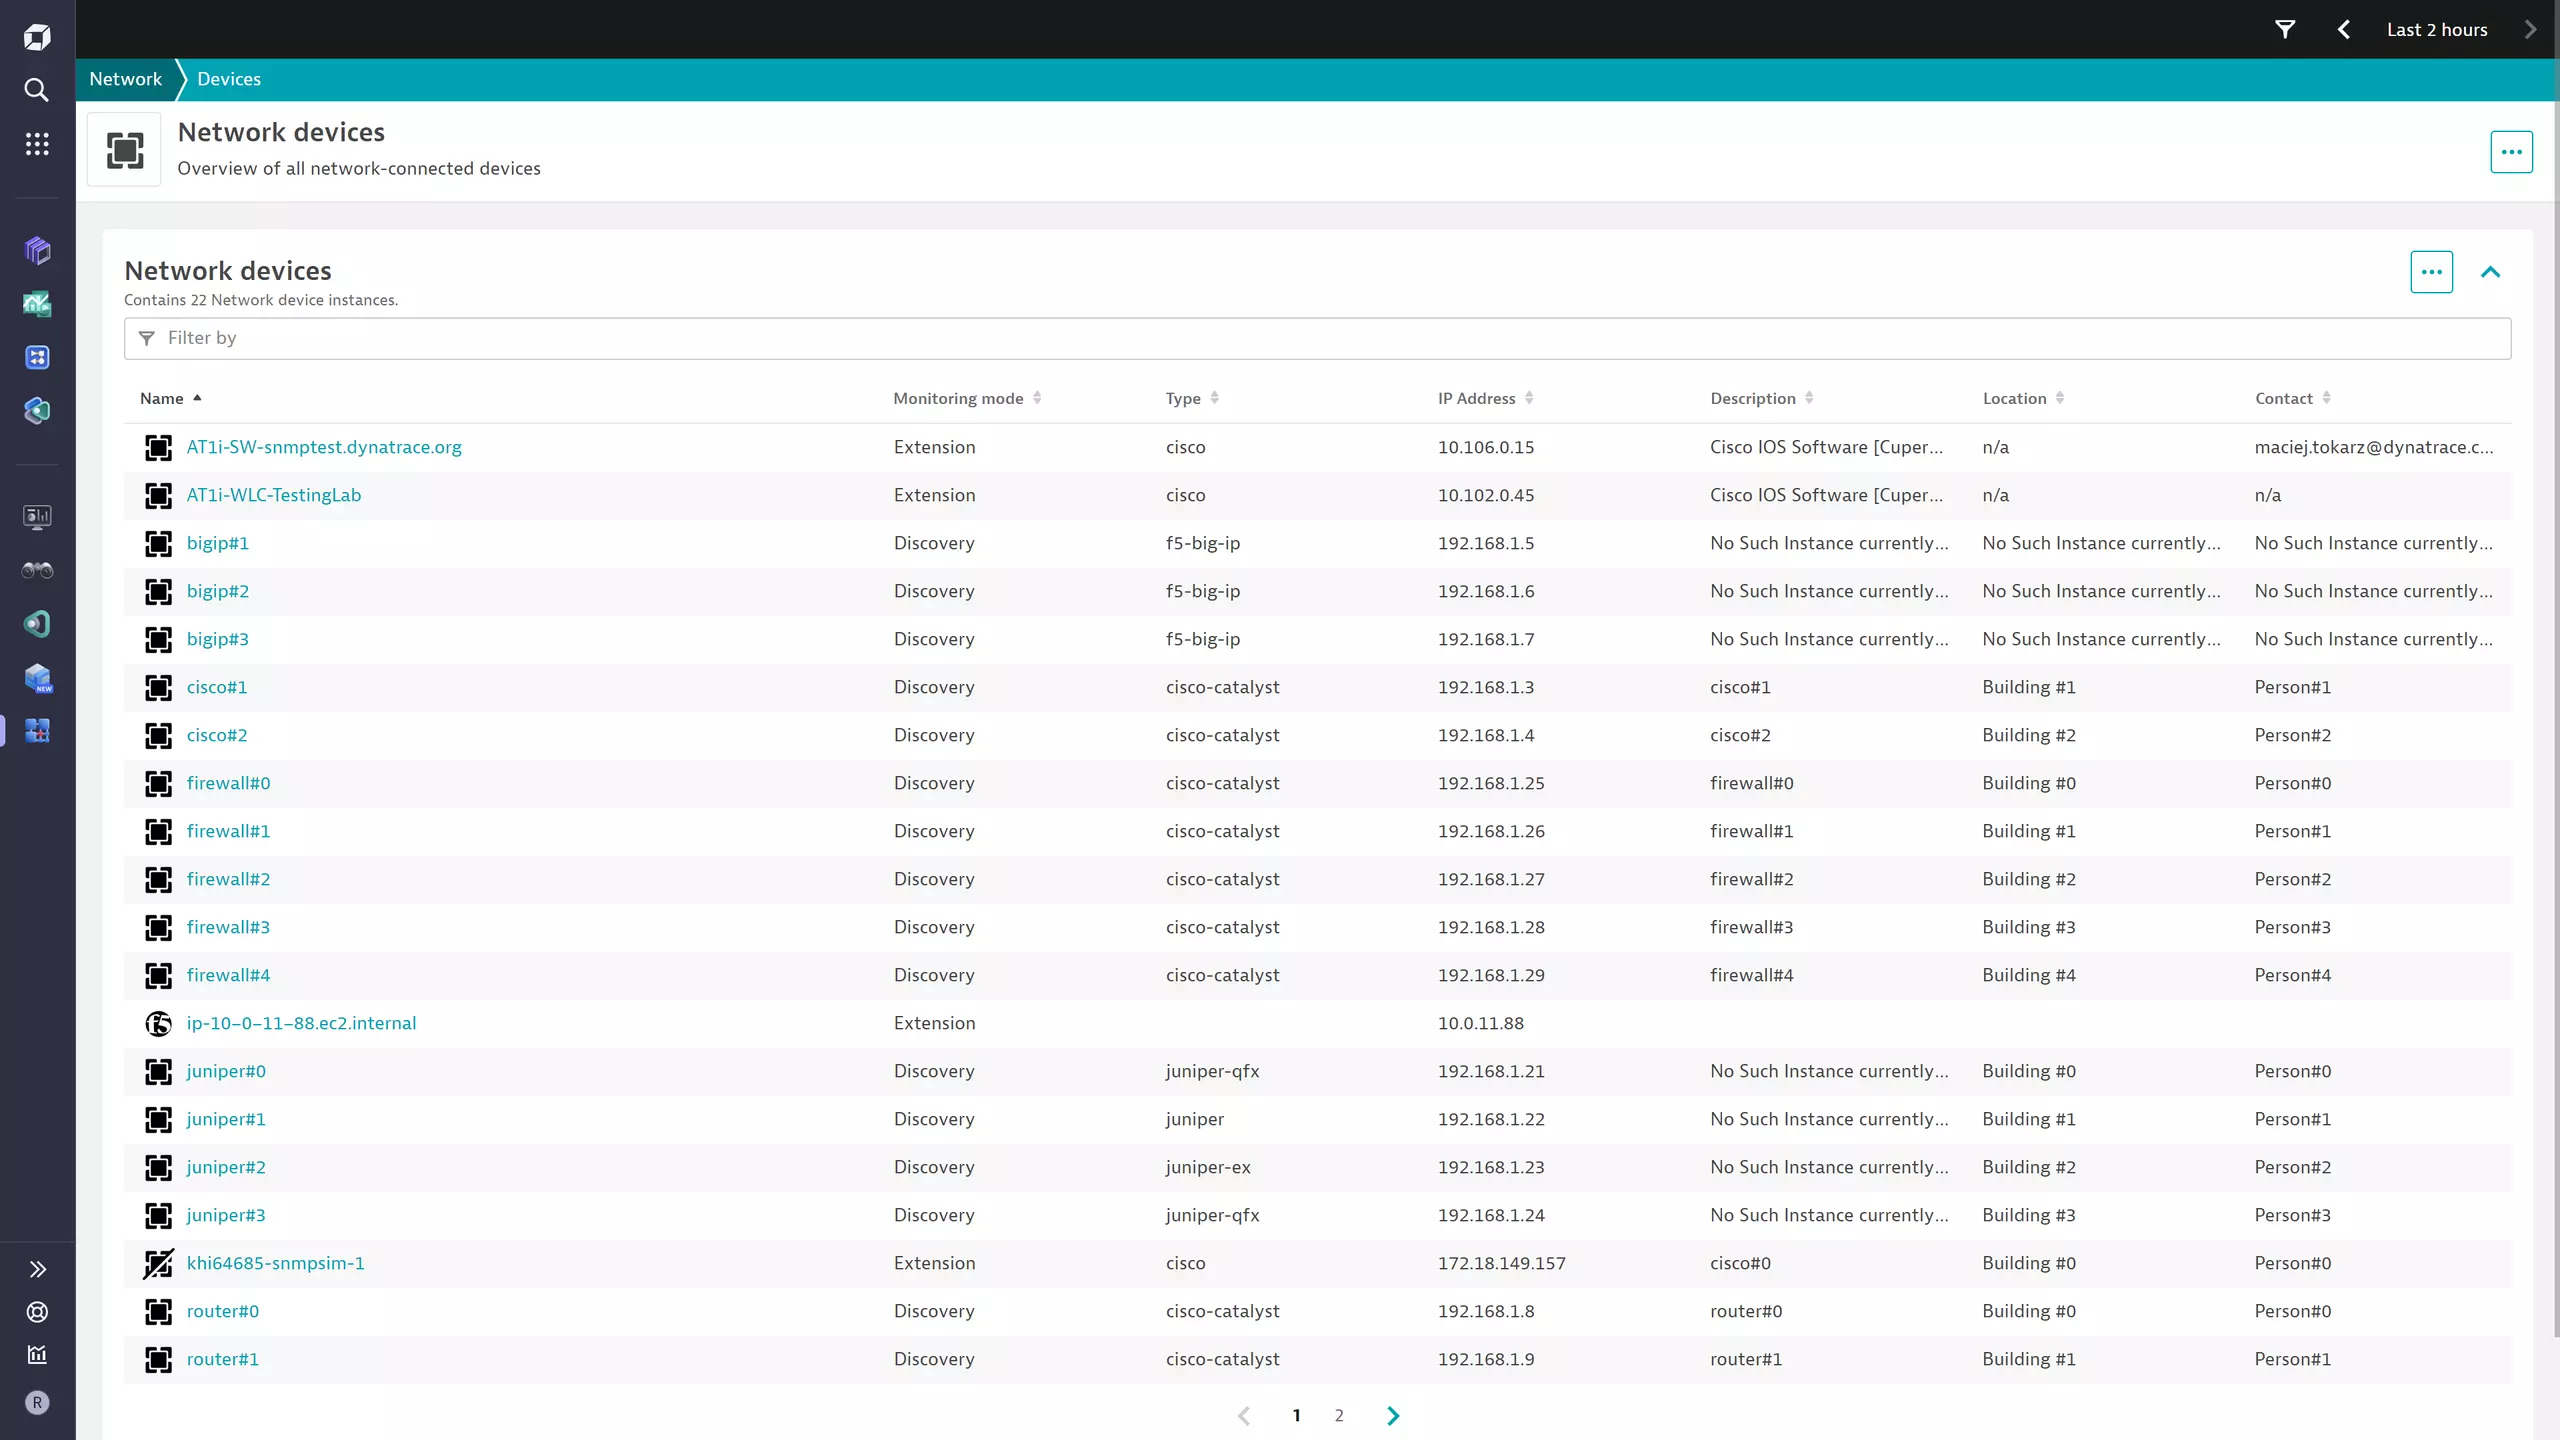
In addition, the extension packages a topology and metrics model that brings together all network devices. It maps them to available extensions that can get deeper insights into the health and performance of that specific technology.
When neighbor discovery is enabled, the extension also queries discovered devices for network neighbors via LLDP and CDP. Neighbor devices must have these protocols correctly configured to advertise accurate data. When all details are correctly advertised, you can see which neighbor device is connected to which queried device and on which port or interface.
Licensing and costs
There is no charge to use the extension. You are only charged for the data that the extension ingests.
The SNMP Autodiscovery extension ingests log records, which consume Davis Data Units (DDUs) (Dynatrace classic license) or are billed based on data size under Log management and analytics (powered by Grail) (DPS), according to your license model.
Device discovery produces one log record per discovered device every 10 minutes. Neighbor discovery produces one log record per neighbor device address every 10 minutes.
Log management and analytics (powered by Grail)
License consumption is based on the size (in bytes) of data ingested & processed, retained, and queried. Consult the log management and analytics documentation for details on the dimensions that affect license consumption.
Dynatrace classic license
In the Dynatrace classic licensing model, log record ingestion consumes Davis Data Units (DDUs) at the rate of .0005 DDUs per ingested log record. Multiply estimated ingested log records by .0005 to estimate DDU usage from log records.
Feature sets
When activating your extension using a monitoring configuration, you can limit monitoring to one of the feature sets. To work properly, the extension has to collect at least one metric after the activation.
In highly segmented networks, feature sets can reflect the segments of your environment. Then, when you create a monitoring configuration, you can select a feature set and a corresponding ActiveGate group that can connect to this particular segment.
All metrics that aren't categorized into any feature set are considered to be the default and are always reported.
A metric inherits the feature set of a subgroup, which in turn inherits the feature set of a group. Also, the feature set defined on the metric level overrides the feature set defined on the subgroup level, which in turn overrides the feature set defined on the group level.
self-monitoring
| Metric name | Metric key | Description |
|---|---|---|
| Devices OK | sfm.snmp_autodiscovery.devices_ok | The amount of addresses that responded to the scanner query as part of a given configuration. |
| Devices scanned | sfm.snmp_autodiscovery.devices_scanned | The total amount of addresses that were scanned by the extension as part of a given configuration. |
| Scan duration | sfm.snmp_autodiscovery.scan_duration | The time the extension took to scan through all addresses that are part of a given configuration. |
FAQ
The extension reports high CPU usage, what can I do?
You can configure ActiveGates with several levels of resource utilization limits, called performance profiles. By default, the extension applies more restrictive limits. Whenever you plan to scan more than 1,000 IP addresses, configure your ActiveGate to use the High limits profile. With particularly large setups, the Dedicated profile allows the extension to use even more of the ActiveGate's resources.
To enable the High limits profile on an ActiveGate:
- Go to Deployment Status.
- Find your ActiveGate, expand the row, and select Settings.
- In the Extension Execution Controller tab, use the drop-down menu to select a different profile.
To enable the Dedicated profile, see Dedicated performance profile configuration.
Leave the restInterface option enabled.
For finer-grained control, the Advanced configuration section in the monitoring configuration allows you to set explicit CPU and memory limits, as well as task concurrency bounds. The extension dynamically adjusts the number of concurrent tasks based on real-time CPU usage against the configured threshold.
What performance is expected from this extension?
During its execution, the extension limits resource utilization based on the ActiveGate performance profile.
- Default: 5% CPU and 500 MB memory
- High limits: 15% CPU and 700 MB memory
- Dedicated limits: 30% CPU and 1500 MB memory
High limits profile:
| Load (IPs) | Time (S) | Time (M) | Time (L) |
|---|---|---|---|
10,000 | 45 sec | 42 sec | 41 sec |
30,000 | 5.3 min | 3.1 min | 2.2 min |
100,000 | 20.7 min | 11.1 min | 7.6 min |
200,000 | 42.6 min | 22.3 min | 15.2 min |
250,000 | 55 min | 27 min | 19 min |
Dedicated limits profile:
| Load (IPs) | Time (S) | Time (M) | Time (L) |
|---|---|---|---|
250,000 | 28.5 min. | 19 min | 18.4 min |
To understand expected load and execution times, stress tests were based on the recommended ActiveGate sizing.
- S: c7i.large
- M: c7i.xlarge
- L: c7i.2xlarge
My monitored devices still appear unmonitored. How do I fix this?
To reduce the load on the scanner, but also allow monitored data to take priority, the extension requires an API token: a platform token with the storage:buckets:read and storage:smartscape:read scopes.
Also, ensure that the API routing module (restInterface) is enabled on the ActiveGate (even on a Dedicated profile).
Specialized extensions are updated to adopt the new network entity model. For details about the devices monitored by the extension, see Compatibility information.
