Monitor Kubernetes/OpenShift workloads
- Dynatrace Classic
- 5-min read
Dynatrace version 1.232+
When deployed in application-only mode, OneAgent monitors the memory, disk, CPU, and networking of processes within the container only. Host metrics aren't monitored.
Prerequisites
- ActiveGate with the Kubernetes API monitoring enabled
- Latest OneAgent image from Docker Hub with tag 1.38.1000+
- In Dynatrace, go to your Kubernetes cluster settings page and make sure that Monitor Kubernetes namespaces, services, workloads, and pods is turned on.
Get an instant overview of your Kubernetes environment
Once you enable Kubernetes workload monitoring support, you can easily see how many cluster resources have been allocated through the workloads that are running on the cluster.
To display the Kubernetes workloads, go to  Kubernetes Workloads Classic.
Unified analysis view on your workloads, namespaces, and pods
The unified analysis view enables you to examine all the namespace-related data on the overview page of a specific Kubernetes namespace, all workload-related data on the overview page of a specific Kubernetes workload, and all the pod-related data on the overview page of a specific Kubernetes pod.
To customize the information you receive on the unified analysis page, select More (…) in the upper-right corner of any section. The different selections on the unified analysis page (View all namespaces, View all workloads, View all pods, and so on) enable you to jump directly to any specific section or subsection you want to customize.
Namespaces
It's common for organizations using Kubernetes to split applications into namespaces in order to isolate different business units. For example, a human resources group might have applications in the hr namespace, while a finance group deploys to the finance namespace.
The namespace unified analysis page provides a valuable view for business units like these to track the amount of resources they are allocated and compare this to their utilization rates.
On the namespace unified analysis page, you can examine properties, potential problems, resource requests and limits, workloads analysis, quotas, and events, and see all the workloads that belong to that namespace (with links to them). You can filter namespaces by metric dimension filters.
To display the namespace unified analysis page, in Dynatrace, go to  Kubernetes Workloads Classic and select a namespace.
Workloads
A workload consists of one or more pods. It's a way of describing a type of microservice that comprises an application. For instance, an application might have a frontend workload and a backend workload made up of a dozen pods, each across a Kubernetes cluster.
The workload unified analysis page provides insights into resource utilization, problem detection, vulnerabilities, number of pods in the respective workload, number of services that are sending traffic to the pods, and events for all of the pods in a given workload. This information is valuable for analyzing the overall performance of a microservice rather than looking at specific problems in a pod instance.
To display the workload unified analysis page, in Dynatrace, go to  Kubernetes Workloads Classic and select a workload.
Taking a closer look at the applications deployed in one of the namespaces, you can learn about their most important resource usage metrics. The workloads view covers workloads such as Deployment, DeploymentConfig, ReplicaSet, DaemonSet, StatefulSet, StaticPod, and ReplicationController.
The CPU throttling metric tells you how long the application was throttled, so you can determine where more CPU time would have been needed for processing. This usually happens when the containers don't have enough CPU resources (limits) in the workload definition. This might affect the performance of the processes and applications running inside the containers.
You can also see the number of running pods versus desired pods for every cloud application.
Pods
Pods are the smallest unit of concern in Kubernetes and are the actual instances of a workload. The pod unified analysis page is where specific problems can be analyzed when a pod is crashing or slowing down due to memory or CPU saturation.
On the pod unified analysis page, you can examine properties, potential problems, utilization and resources, and events, and you can see the container to which the pod belongs (with a link to it).
To view the overview page of a Kubernetes pod
- Go to
 Kubernetes Workloads Classic and select a workload.
 - Select Pods.
- Select the pod you want.
Limitations on fetching annotations
ActiveGate version 1.277 Dynatrace version 1.277
Kubernetes annotations are retrieved by the ActiveGate and displayed on the entity detail pages for Kubernetes nodes, namespaces, workloads, pods, and services. However, there are certain limitations to be aware of:
- The annotation
kubectl.kubernetes.io/last-applied-configurationis not ingested. - A maximum of 100 annotations per entity is allowed.
- The maximum length of any ingested annotation value is 1,024 characters. Annotation values exceeding this length are truncated.
Find out if your applications are getting enough CPU resources
In addition to the auto-discovery and auto-tracing capabilities, OneAgent captures low-level container metrics to reflect the effect of container resource limits.
Generic resource metrics for all supported container runtimes on Linux are available in custom charting and grouped in Containers > CPU and Containers > Memory.
Metrics for the number of running and desired pods are also available under the Cloud Platform section.
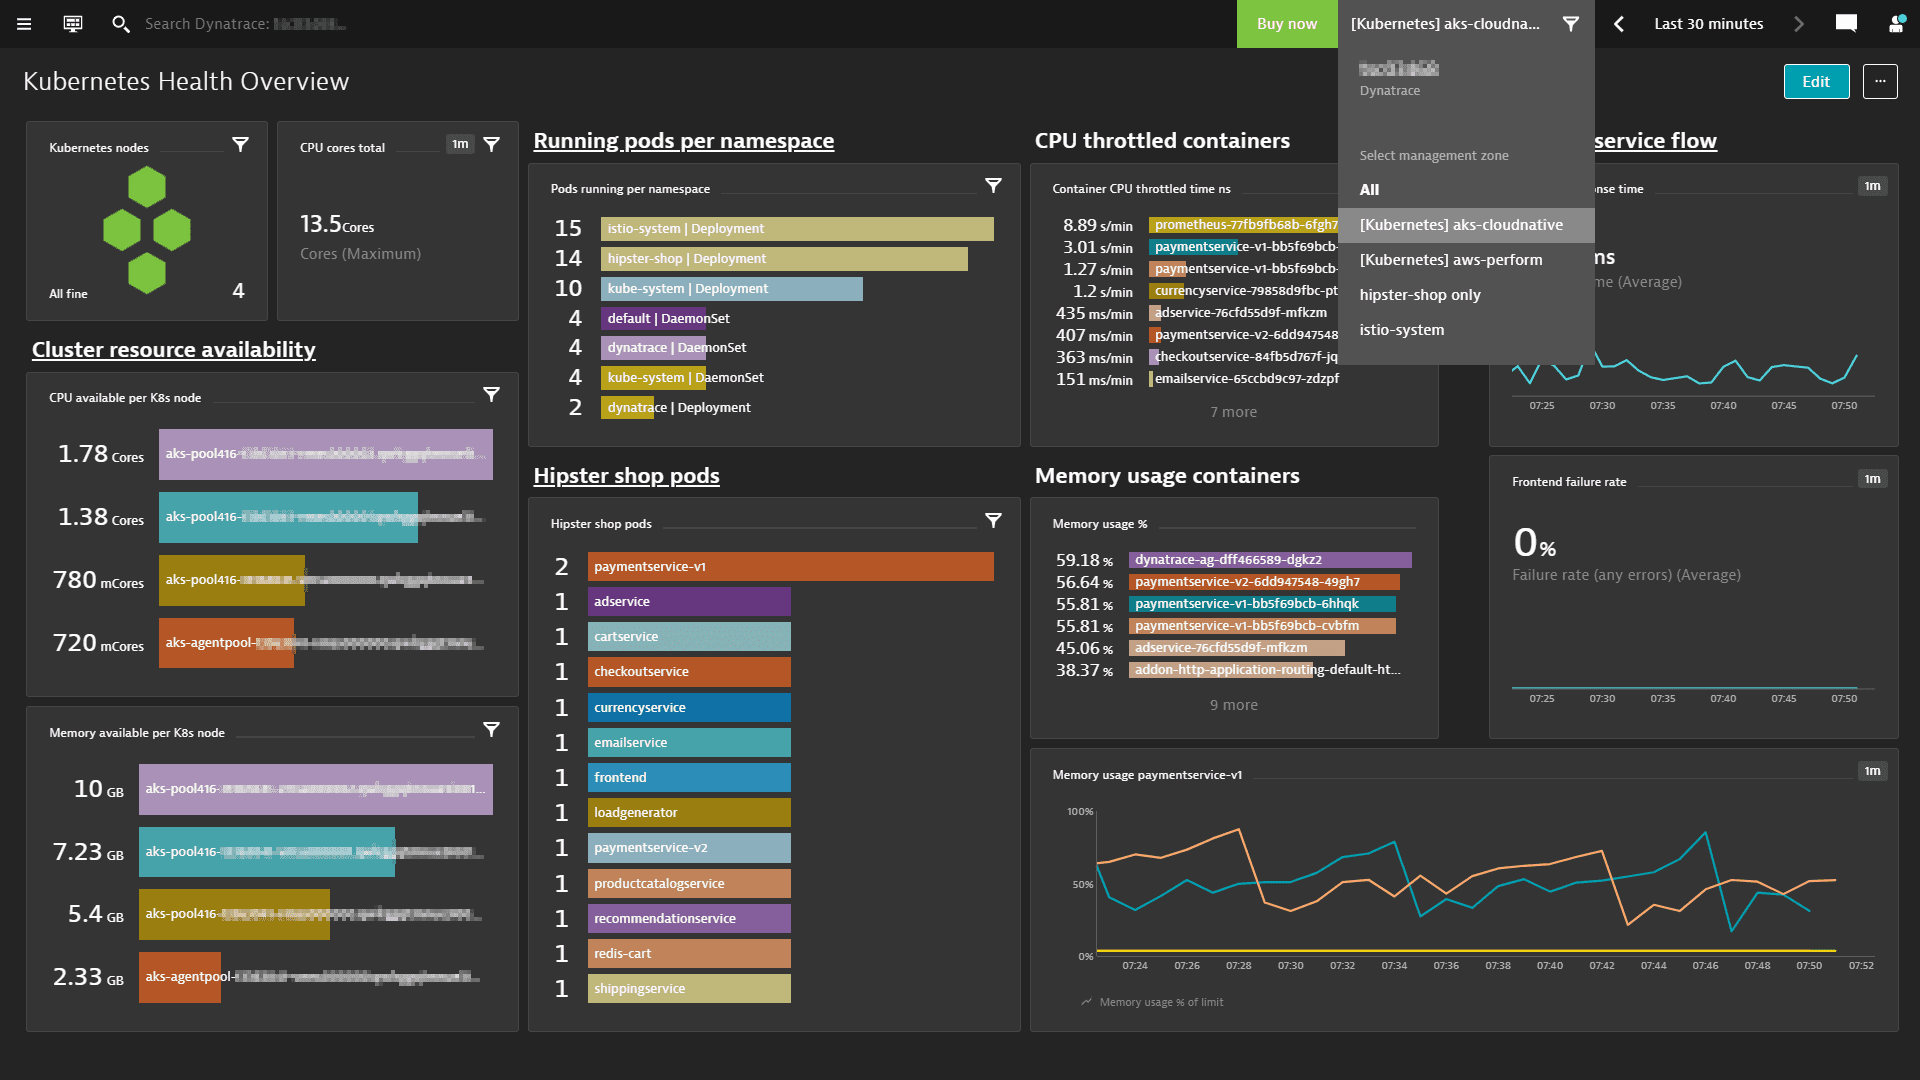
The CPU throttled time and memory usage percentage shows if the resource limits in the Kubernetes pod specs are set correctly. If memory usage reaches 100%, containers or applications will crash (out of memory) and need to be restarted.
Fine-grained control of visibility into namespaces and workloads via management zones
You can use management zones to control user access to the monitoring data of specific Kubernetes objects in your environment. For example, you can limit the access to specific workloads and namespaces to specific user groups. With this approach, you can control user access to specific Dynatrace Kubernetes pages, custom charts, and dashboards.
