Monitor Kubernetes/OpenShift metrics
- Dynatrace Classic
- 2-min read
Dynatrace version 1.232+
Prerequisites
- In Dynatrace, go to your Kubernetes cluster settings page and make sure that Monitor Kubernetes namespaces, services, workloads, and pods is turned on.
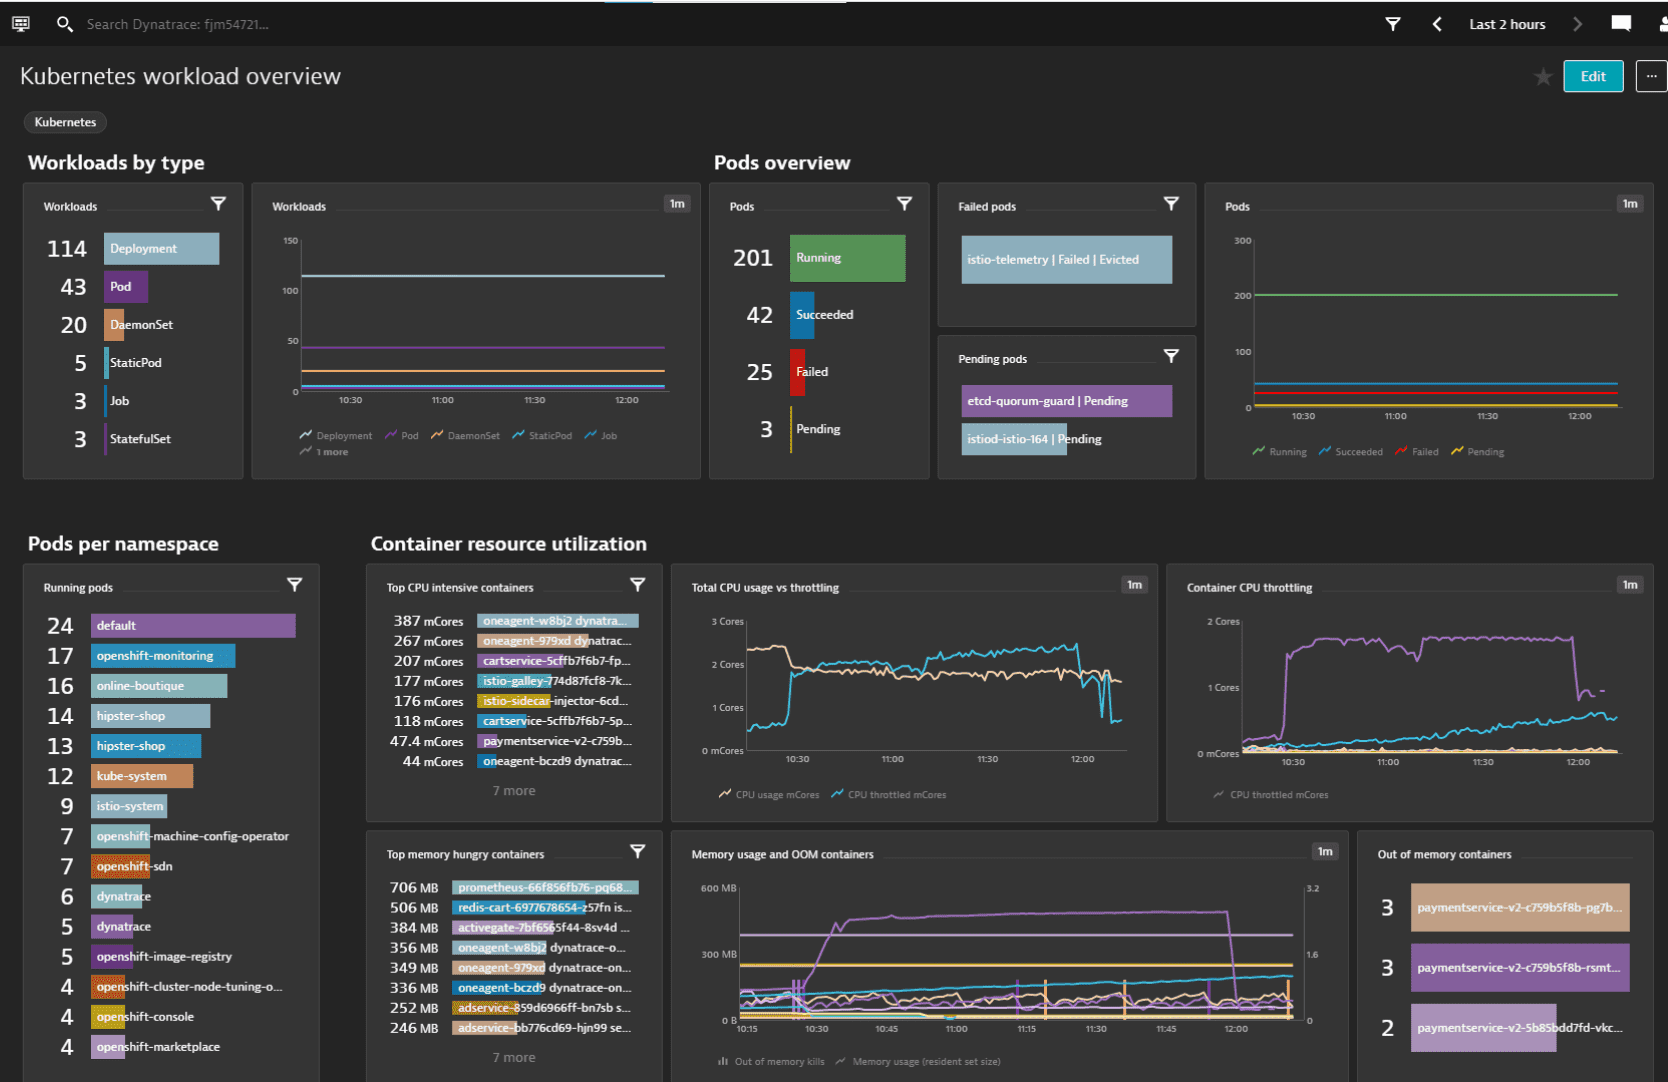
View Kubernetes metrics
- For details on container metrics, see Built-in metrics - Containers/CPU and Built-in metrics - Containers/Memory.
- For details on Kubernetes metrics, see Built-in metrics - Cloud/Kubernetes.

Workload resource metrics
Dynatrace version 1.264+ ActiveGate version 1.263+
Workload resource metrics rely on cAdvisor, which is only available on POSIX-based Kubernetes nodes. These metrics are not available on Windows.
For clusters with more than 50 nodes or 5,000 pods, resource consumption of the ActiveGate is considerably increased.
The workload and node resource metrics feature aggregates container resource metrics (CPU usage, CPU throttling, and memory consumption) to the workload and node level. Workload and node resource metrics are based on the container metrics exposed by the Kubernetes cAdvisor. This feature does not require OneAgent—an ActiveGate with Kubernetes API monitoring turned on is sufficient.
To enable monitoring of workload and node resource metrics
-
Go to
 Kubernetes Classic and select the cluster name to open the Kubernetes cluster overview page.
 -
In the upper-right corner, select More (…) > Settings, select Monitoring settings, and turn on Monitor workload and node resource metrics.
Monitoring node resource metrics requires ActiveGate version 1.271+.
-
Optional Select Test connection to verify that the feature has been successfully activated.
For a list of all available metrics, see Workload metrics or Node for node resource metrics.