NAM monitor metrics in Synthetic Monitoring
- Latest Dynatrace
- Reference
Metrics and dimensions
Dimensions (all network availability monitors)
| Name | Type | Description | Example value |
|---|---|---|---|
| string | If available, monitored entity ID for target |
|
| string | Monitor ID (monitored entity ID) |
|
| string | Synthetic location ID (monitored entity ID) |
|
| array | UUIDs of maintenance windows |
|
| string | The security context is used in access permissions to limit the visibility |
|
| string | Synthetic monitor ID |
|
| array | IDs of monitored entities |
|
| string | Identifier of the step |
|
| boolean | Information whether monitor availability was interpolated |
|
| string | Name of the monitor |
|
| string | User-defined primary Grail tags |
|
| numeric | Request sequential ID |
|
| string | Address of target entity |
|
| string | Type of request |
|
| string | Result state of monitor execution |
|
| numeric | Numeric representation of the execution status |
|
| string | Execution status |
|
| numeric | Step sequential ID |
|
| string | Name of the step |
|
| numeric | Sequence number of the step (starting from 0) |
|
Monitor metrics (all network availability monitors)
| Name | Type | Dimensions | Description |
|---|---|---|---|
| numeric |
| Availability calculated based on the execution status of visits: |
| numeric |
| Duration between the start and end the time of visit execution (in milliseconds)Metric available only if visit execution took place; both start time and end time must be available. |
| numeric |
| Number of monitor executions in time |
| numeric |
| Ratio of executed steps that didn't fail (successes and skips) to all executed steps. We take into account steps that were actually executed rather than steps intended to be executed. For example, with 2 successful steps, 1 failed step, and 8 not started, the ratio is |
Step metrics (all network availability monitors)
| Name | Type | Dimensions | Description |
|---|---|---|---|
| numeric |
| Availability calculated based on the execution status of steps:
|
| numeric |
| Duration between the start and the end time of step execution (in milliseconds). The metric is available only if the step execution took place, with a well-defined end time; therefore, it's not available for skipped steps. |
| numeric |
| Number of step executions in time |
| numeric |
| Ratio of executed requests that didn't fail to all executed requests. If a step doesn't have executed requests (because nothing matches its definition in a monitor configuration), we return the value 100%. For example, with 2 successful requests and 1 failed request, the ratio is 2/3, or 66.67%. |
Request metrics (all network availability monitors)
| Name | Type | Dimensions | Description |
|---|---|---|---|
| numeric |
| Availability calculated based on the execution status of requests:
|
| numeric |
| Number of request executions in time |
ICMP monitor metrics
| Name | Type | Dimensions | Description |
|---|---|---|---|
| numeric |
| Number of packets that were returned successfully |
| numeric |
| Total number of packets sent |
| numeric |
| Duration between the start and the end time of request handling (in milliseconds). This metric is always provided, even if actual request execution didn't occur (for example, because of exceptions or timeouts). Diagnostic metric—allows validation of the external ping process execution time. |
| numeric |
| Round-Trip Time for received packets |
| numeric |
| Ratio of received packets to sent packets. Doesn't take into account the configured number of packets to be sent. For example, out of 10 packets to be sent, if 5 were sent and 4 were received, the ratio is |
TCP monitor dimensions
| Name | Type | Description | Example value |
|---|---|---|---|
| string | TCP request port number, as provided in monitor configuration |
|
TCP monitor metrics
| Name | Type | Dimensions | Description |
|---|---|---|---|
| numeric |
| Duration between the start time (socket creation and connection) and the end time (when connection is successfully established) in milliseconds. The metric is available only if the request execution completed without exceptions or timeouts and has a well-defined end time. |
DNS monitor dimensions
| Name | Type | Description | Example value |
|---|---|---|---|
| string | DNS record type to be queried by request, as provided in configuration |
|
DNS monitor metrics
| Name | Type | Dimensions | Description |
|---|---|---|---|
| numeric |
| Duration between the start and the end time of the request to the DNS server, in milliseconds. The metric is available only if the request execution took place (with no exceptions or timeouts), with a well-defined end time. |
DQL queries to extract data
Use DQL queries to extract data with metrics and dimensions.
The following examples use  Notebooks to demonstrate how to work with the results of network availability monitors. They use result metrics as a starting point to explore possibilities of extracting and interpreting data with DQL.
Host entity status for ICMP requests
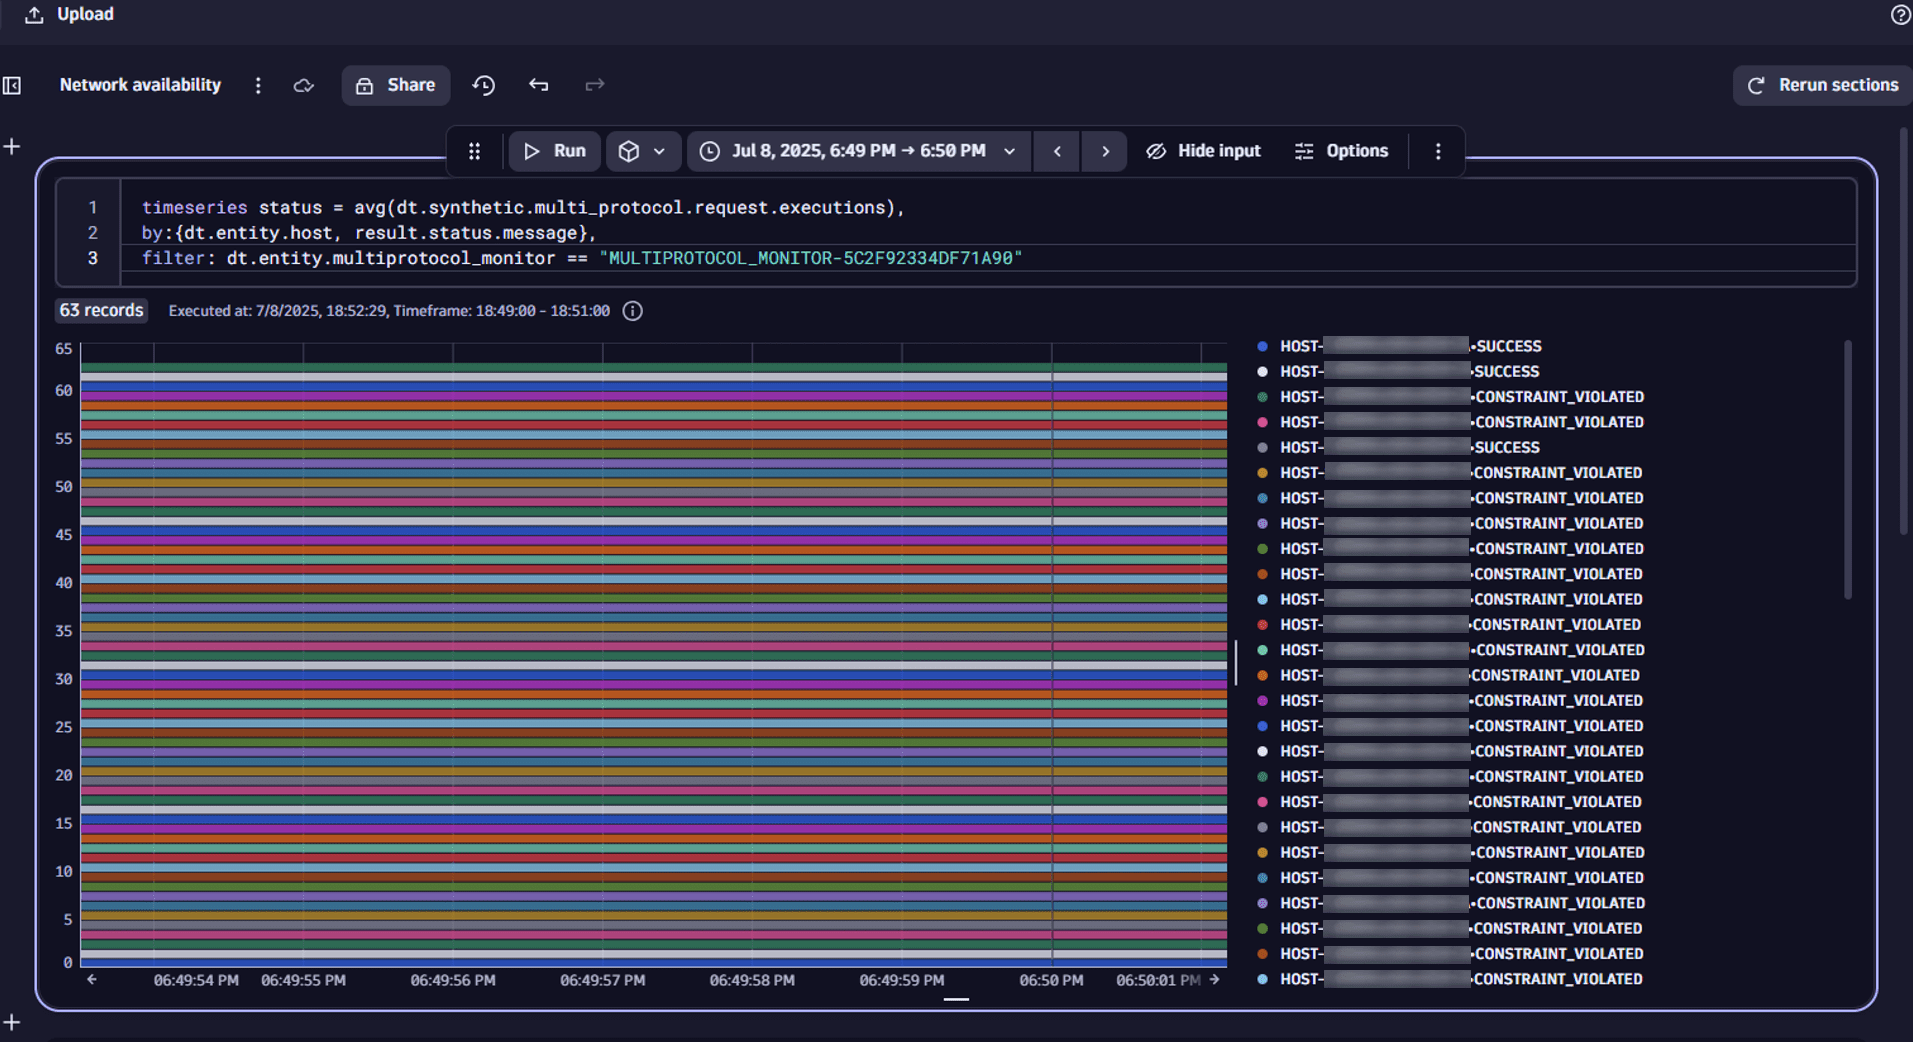
The monitor MULTIPROTOCOL_MONITOR-5C2F92334DF71A90 executes ICMP requests and filters monitored hosts with "targetFilter": "hostGroup == e2e-synthetic-private-location" (which resolves to about 26 hosts).
By using the dt.synthetic.multi_protocol.request.executions metric and splitting it by the dt.entity.host and result.status.message dimensions, we can display the status of the connection to a particular monitored host entity in this host group. Some hosts do not fulfill the expected success rate; instead of being HEALTHY, their requests are marked as CONSTRAINT_VIOLATED.
timeseries status = avg(dt.synthetic.multi_protocol.request.executions),by:{dt.entity.host, result.status.message},filter: dt.entity.multiprotocol_monitor == "MULTIPROTOCOL_MONITOR-5C2F92334DF71A90"
Number of ICMP packets sent and received
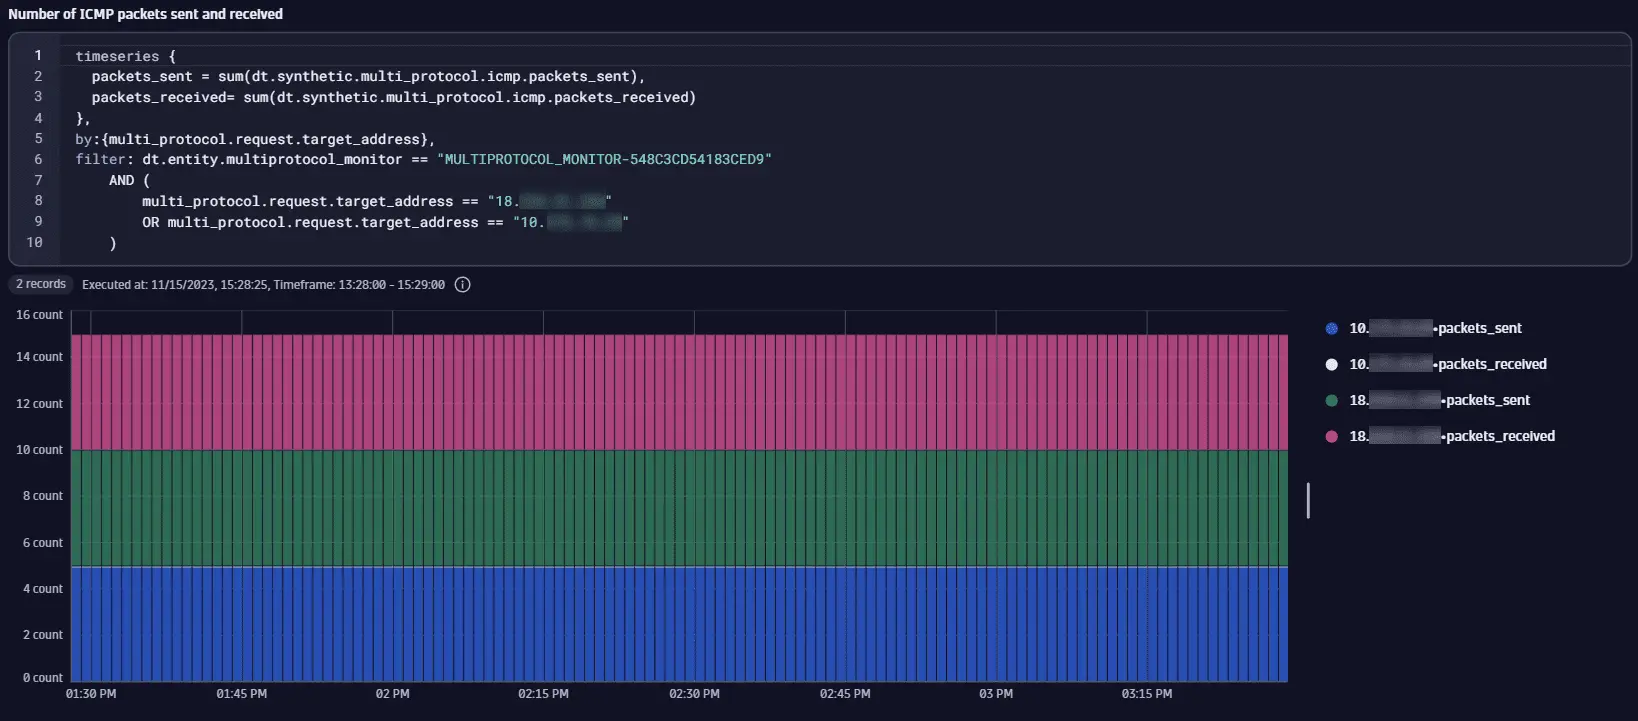
The monitor MULTIPROTOCOL_MONITOR-548C3CD54183CED9 executes ICMP requests to hosts with the explicitly defined IP addresses, 18.x.x.x, 10.x.x.x, and 34.x.x.x. Each of these IP addresses is mapped to a distinct host.
We use the sum of the dt.synthetic.multi_protocol.icmp.packets_sent and the sum of the dt.synthetic.multi_protocol.icmp.packets_received metrics to get insight into how many packets were sent and received.
We split results by the request.target_address dimension and filter data for 18.x.x.x and 10.x.x.x only.
For 18.x.x.x, the same number of packets were received as were sent, but for 10.x.x.x, all packets are lost and none were received.
timeseries {packets_sent = sum(dt.synthetic.multi_protocol.icmp.packets_sent),packets_received= sum(dt.synthetic.multi_protocol.icmp.packets_received)},by:{request.target_address},filter: dt.entity.multiprotocol_monitor == "MULTIPROTOCOL_MONITOR-548C3CD54183CED9"AND (request.target_address == "18.x.x.x"OR request.target_address == "10.x.x.x")
Target status for TCP requests
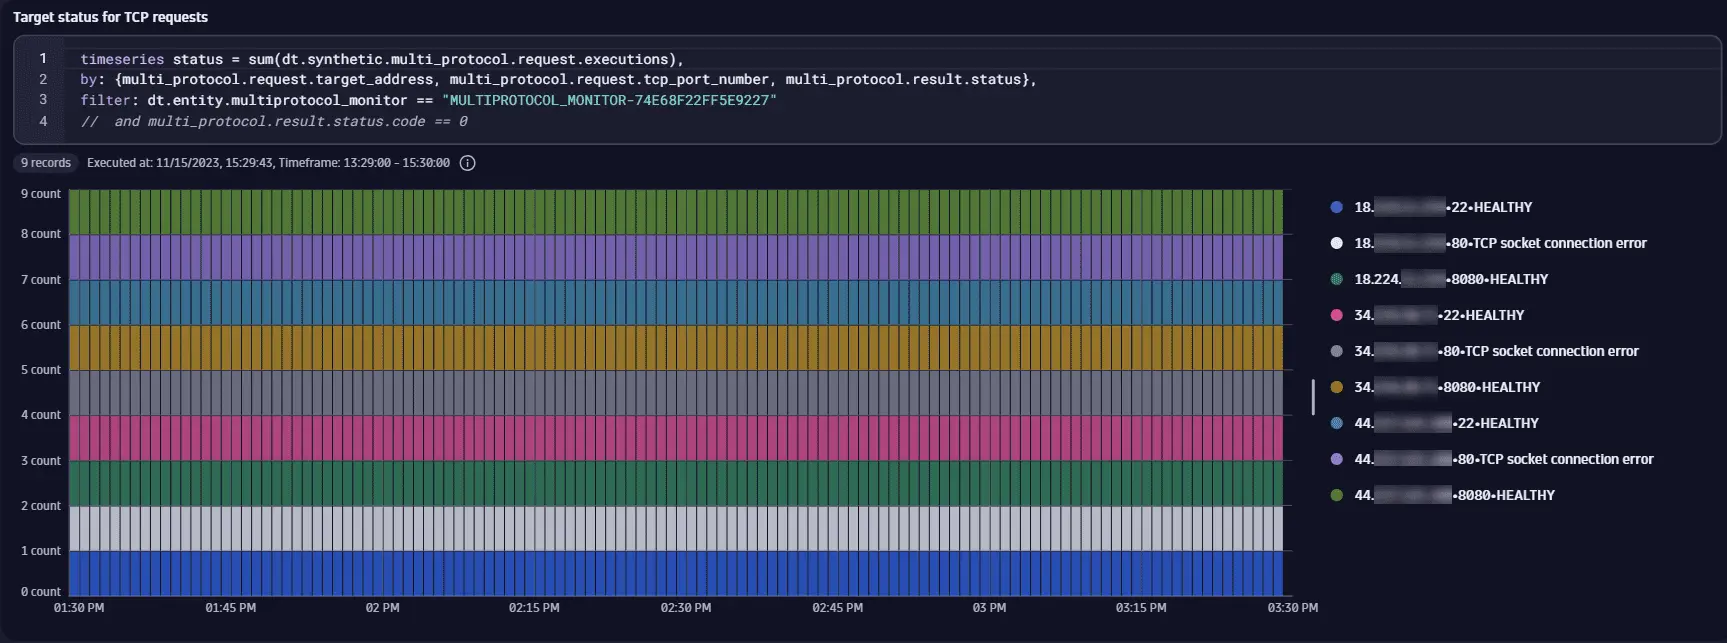
The monitor MULTIPROTOCOL_MONITOR-74E68F22FF5E9227 executes TCP requests to hosts from a host group that resolves to the IP addresses 18.x.x.x, 34.x.x.x, and 44.x.x.x.
To display the status of the TCP connection for an IP-port pair, we use the dt.synthetic.multi_protocol.request.executions metric and split it by the following dimensions:
request.target_addressrequest.tcp_port_numberresult.status.message
In the following example:
- Each host has the ports
22(SSH) and8080(HTTP server) open, and each connection to the hosts on these ports succeeds with theHEALTHYstatus. - No service uses the standard HTTP port
80. Therefore, connections to all hosts on that port fail with theTCP socket connection errorstatus.
Note that results of this query can be limited to just successful requests by filtering by the multi_protocol.result.status.code dimension (code == 0).
timeseries status = sum(dt.synthetic.multi_protocol.request.executions),by: {request.target_address, request.tcp_port_number, result.status.message},filter: dt.entity.multiprotocol_monitor == "MULTIPROTOCOL_MONITOR-74E68F22FF5E9227"// and result.status.code == 0
TCP connection time to target port
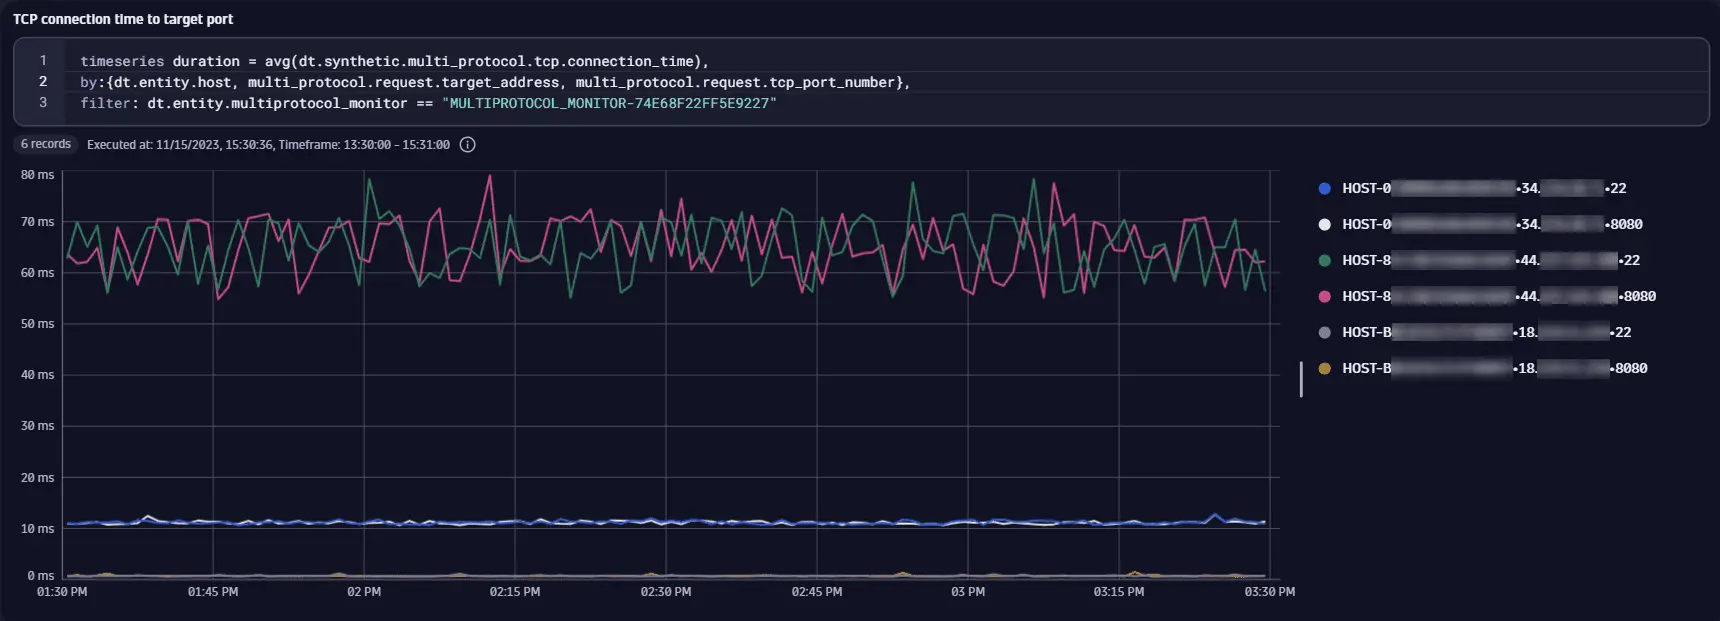
The monitor MULTIPROTOCOL_MONITOR-74E68F22FF5E9227 executes TCP requests to hosts from a host group that resolves to the IP addresses 18.x.x.x, 34.x.x.x, and 44.x.x.x.
In the following example, we split the results by monitored host entity IDs.
To check typical time taken for a successful connection to the target port for a host, we use the average of the dt.synthetic.multi_protocol.tcp.connection_time metric split by the dimensions:
dt.entity.hostrequest.target_addressrequest.tcp_port_number
Only ports 22 (SSH) and 8080 (HTTP server) are open, and these are the only ports for which dt.synthetic.multi_protocol.tcp.connection_time is available. The hosts are effectively in different geographical locations (Ohio, Oregon, and North Virginia in the United States), so a difference in connection times is expected.
timeseries duration = avg(dt.synthetic.multi_protocol.tcp.connection_time),by:{dt.entity.host, request.target_address, request.tcp_port_number},filter: dt.entity.multiprotocol_monitor == "MULTIPROTOCOL_MONITOR-74E68F22FF5E9227"
Execution statuses
All network availability monitors
| Code / message | Example | Description |
|---|---|---|
| - | All is well. |
| Resource saturation | Unexpected problem that's usually related to monitor's execution components. |
| - | Constraint conditions that were defined in monitor's configuration weren't met. |
| - | Improper monitor configuration detected. |
| Error in the hostname | IP address of the host cannot be determined. Possible causes:
|
| Server operates slowly. | Timeout of request execution. Possible causes:
|
TCP monitor execution statuses
| Code / message | Example | Description |
|---|---|---|
| Service is not listening on a specified port. | This status means that the host was identified and available, but the TCP connection couldn't be established or was unexpectedly closed. An additional explanation for the exact exception is provided. The status is used if a
|