Synthetic app
- Latest Dynatrace
- App
- 7-min read
With the  Synthetic app you can create and manage synthetic monitors.
Prerequisites
Permissions
The following table describes the required permissions.
Installation
The Synthetic app is pre-installed in your environment.
Get started
Navigation and filtering
Overview
When you go to Synthetic, it opens to the Overview tab.
Overview displays three tiles:
- Browser monitors
- HTTP monitors
- NAM monitors
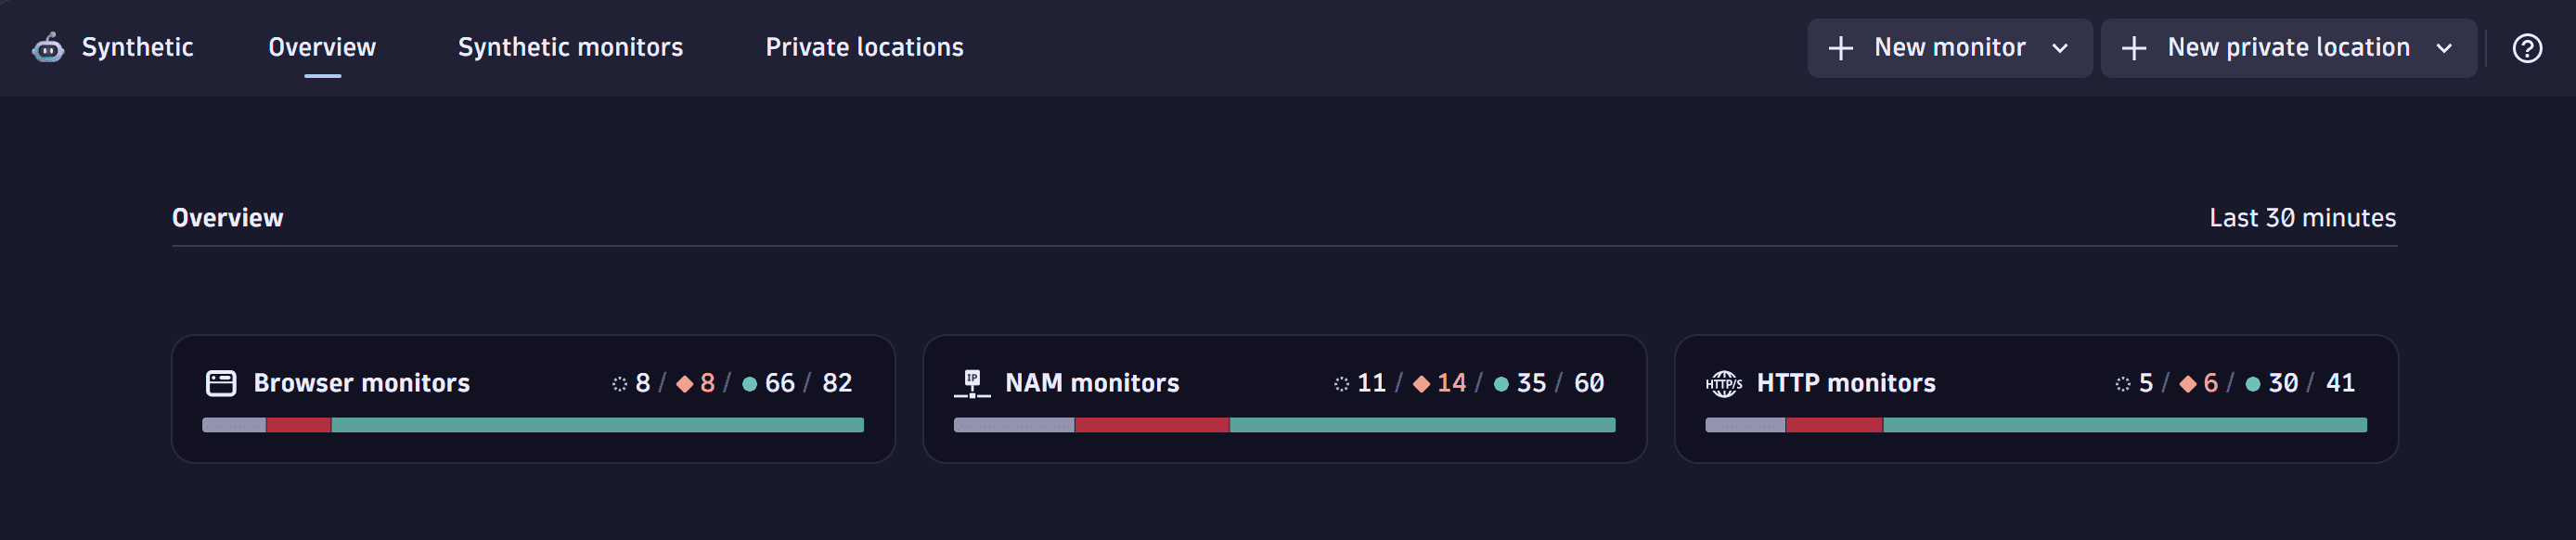
Each tile displays four counts for the corresponding monitor type:
- Gray—the number of deactivated (disabled) monitors.
- Red—the number of monitors with availability or performance problems.
- Green—the number of monitors with no availability or performance problems.
- No color—the total number of monitors of the selected type. Select any number to display the Synthetic monitors tab with the corresponding filters applied. For example, select the red number for HTTP monitors to open the Synthetic monitors tab with filters set to Type: HTTP and Alert: Critical.
Recommended dashboards
The Recommended dashboards section lists recommended selectable ready-made dashboards.
Permissions
If you're missing permissions related to Synthetic, a message box lets you know.
- If you don't have the minimal permissions to use the app, you see the No permission to access Synthetic label and the list of Required permissions needed to use the app.
- If you are missing some permissions that may limit your access to certain app features, you can select View permissions to see the missing permissions.
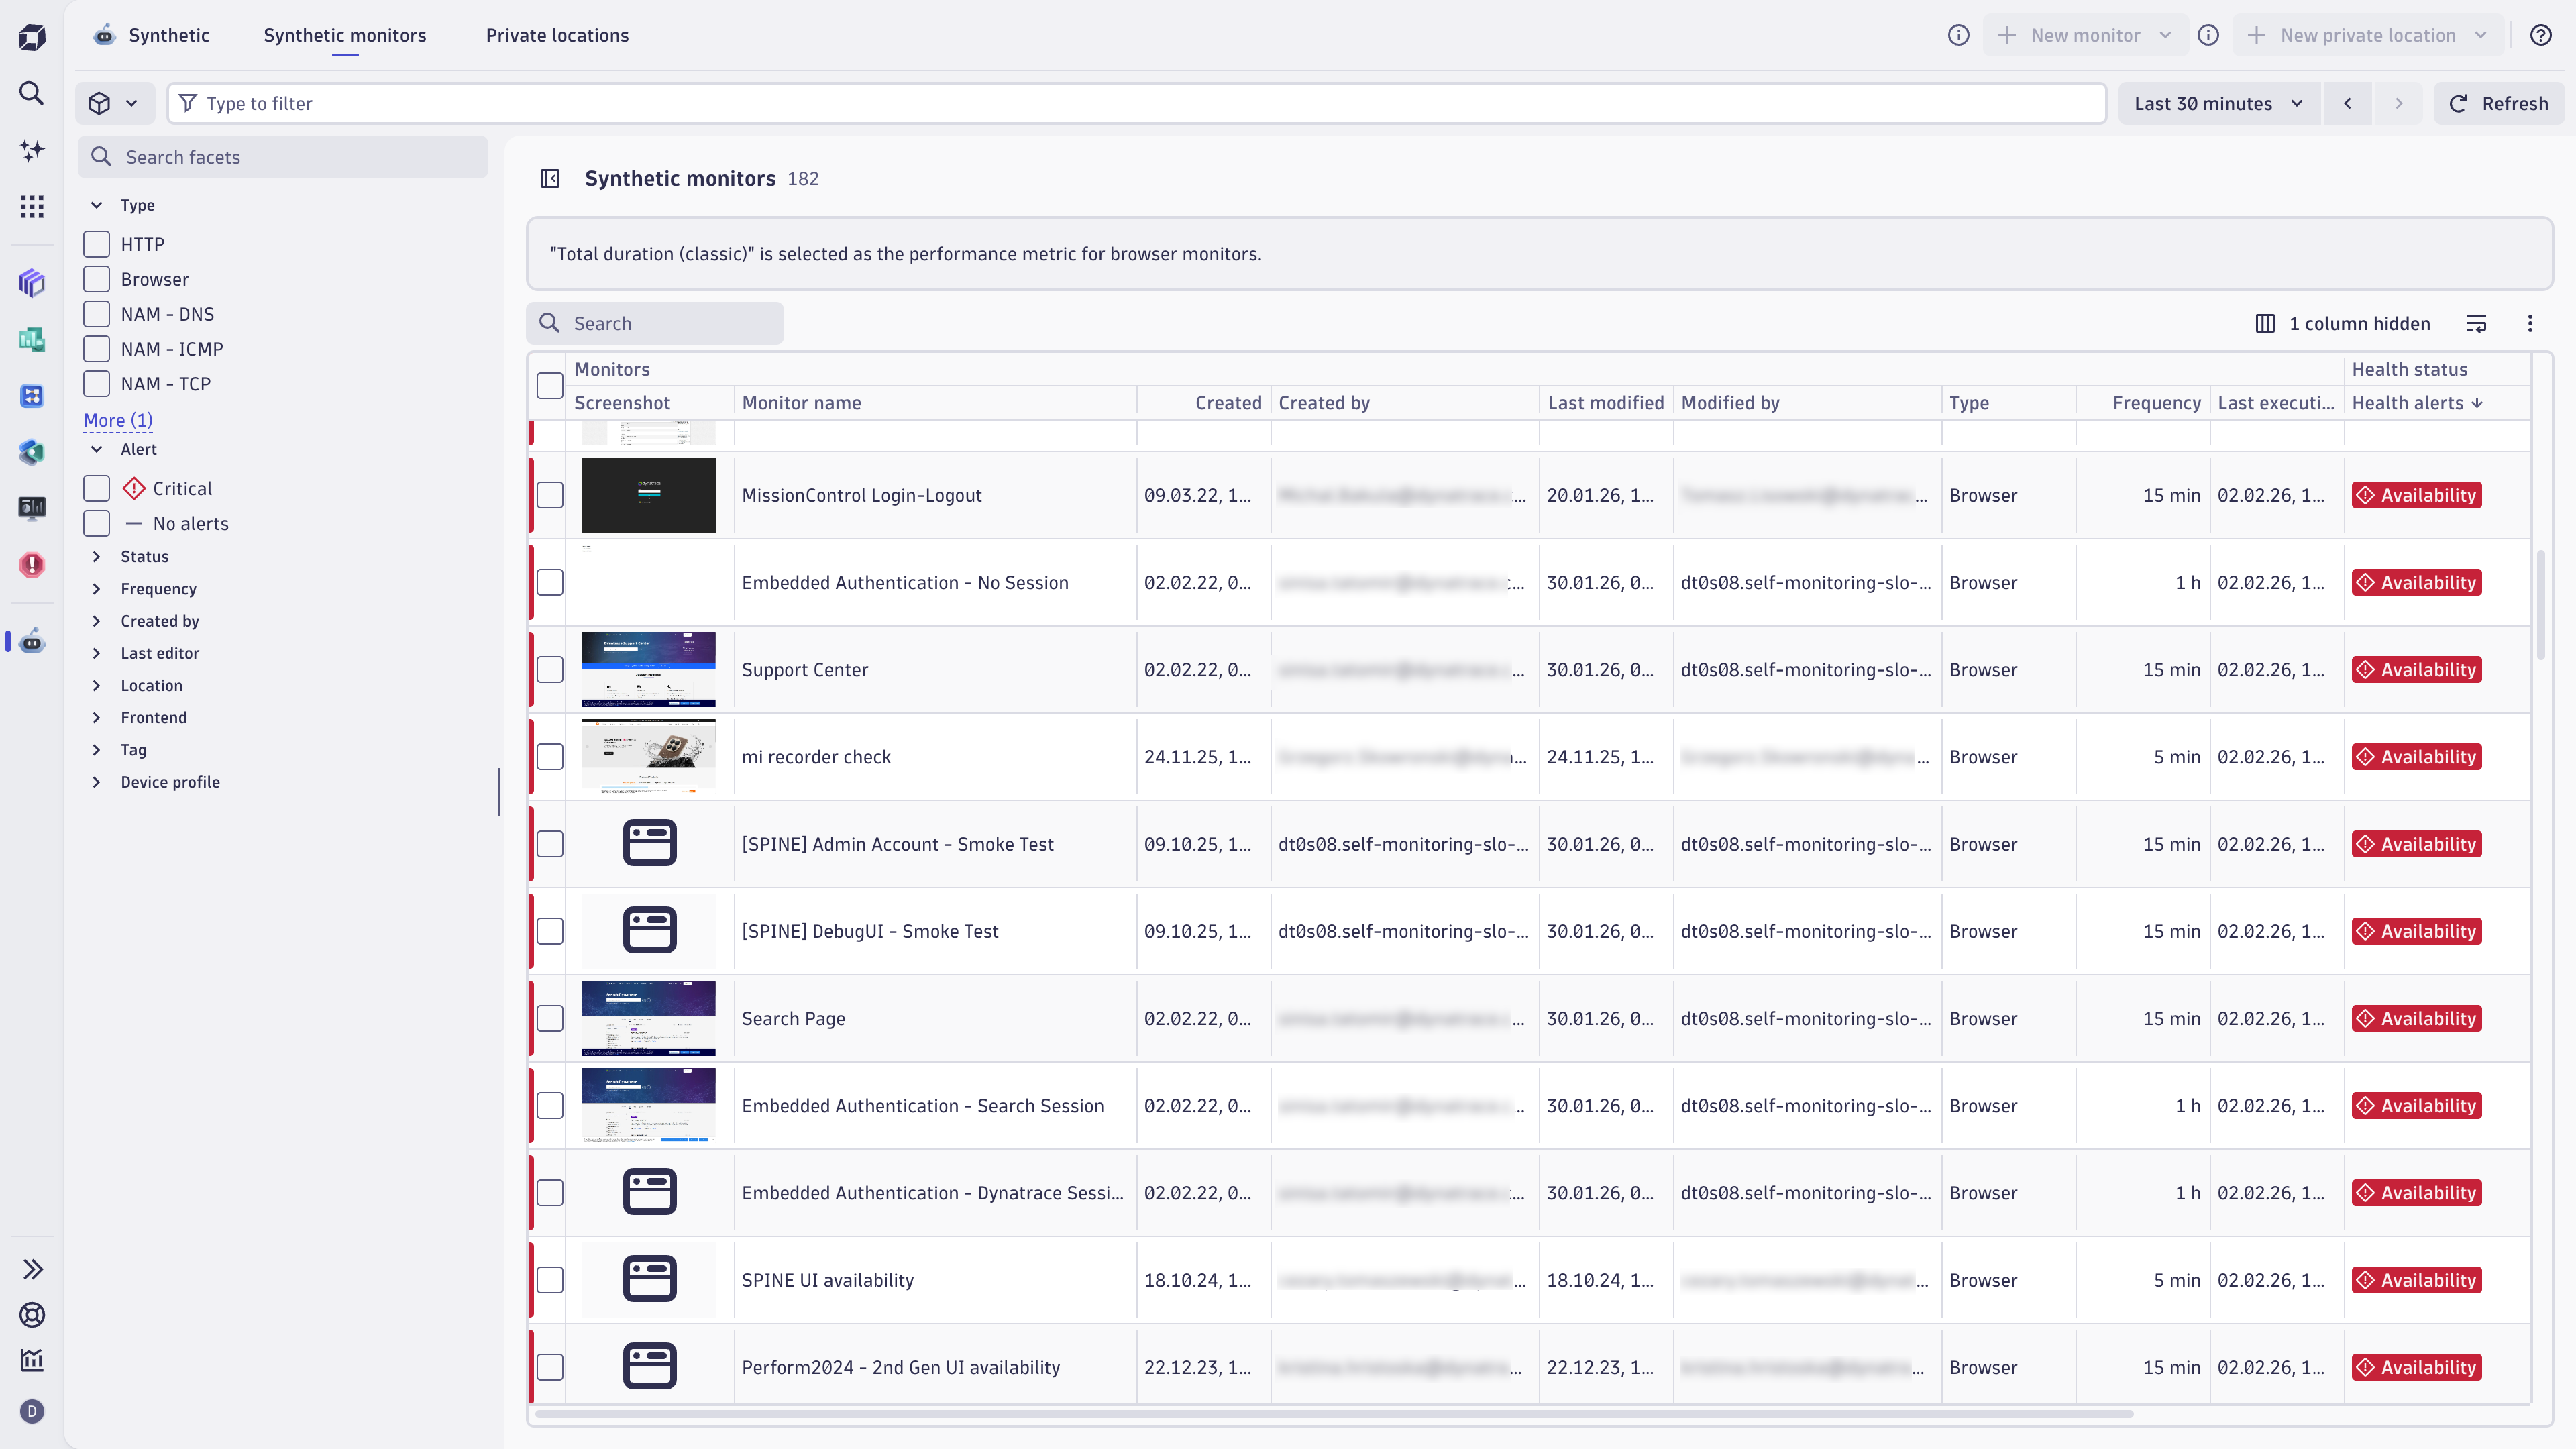
Monitors table
To check and control your monitors, select the Synthetic monitors tab. By default, the page displays all monitors in your environment, active or inactive, in a table with key availability and performance results, so you can check the health of your monitors at a glance. Filters allow you to narrow your search for synthetic monitors.
To find out how to create a new monitor, see Create monitors.
By default, monitors with open problems (issues) are displayed alphabetically at the top of the table. Next, enabled monitors with no problems are displayed alphabetically, followed by disabled monitors displayed alphabetically.
You can hide and sort columns in ascending or descending order. Select Columns in the top-right corner of the table to select which columns to display or hide.
The columns display the following information for each monitor.
| Column | Description |
|---|---|
Screenshot | Only for browser monitors. Displays a screenshot of the last execution from any location. If the monitor has never been executed, a placeholder image is displayed. |
Monitor name | Select to view a quick overview of the monitor to the right of the Synthetic monitors page. |
ID | Full monitor identifier. |
Created | Monitor creation date and time. |
Created by | ID of the user who created the monitor. |
Last modified | Date and time when the monitor was modified. |
Modified by | ID of the user who last modified the monitor. |
Type | Monitor type, for example, |
Frequency | Execution frequency or |
Last execution | Date and time of the most recent execution from any location. |
Health alerts | Alert chips that are displayed for monitors having availability or performance problems. To investigate a problem, select the chip, hover over the problem, and then select Investigate problem—the preview panel appears, and the timeframe when the problem was observed is applied. No alert chips are displayed for monitors with no problems. |
Custom alerts | Alert chips that are displayed for monitors that violated configured custom alerting conditions. To investigate a problem, select the chip, hover over the problem, and then select Investigate problem—the preview panel is displayed, and the timeframe when the problem was observed is applied. No alert chips are displayed for monitors that didn't violate custom alerting conditions or don't have custom alerting conditions configured. |
Availability | Average availability within specific timeframe. |
Performance | Performance within specific timeframe. The performance calculation depends on the monitor type. |
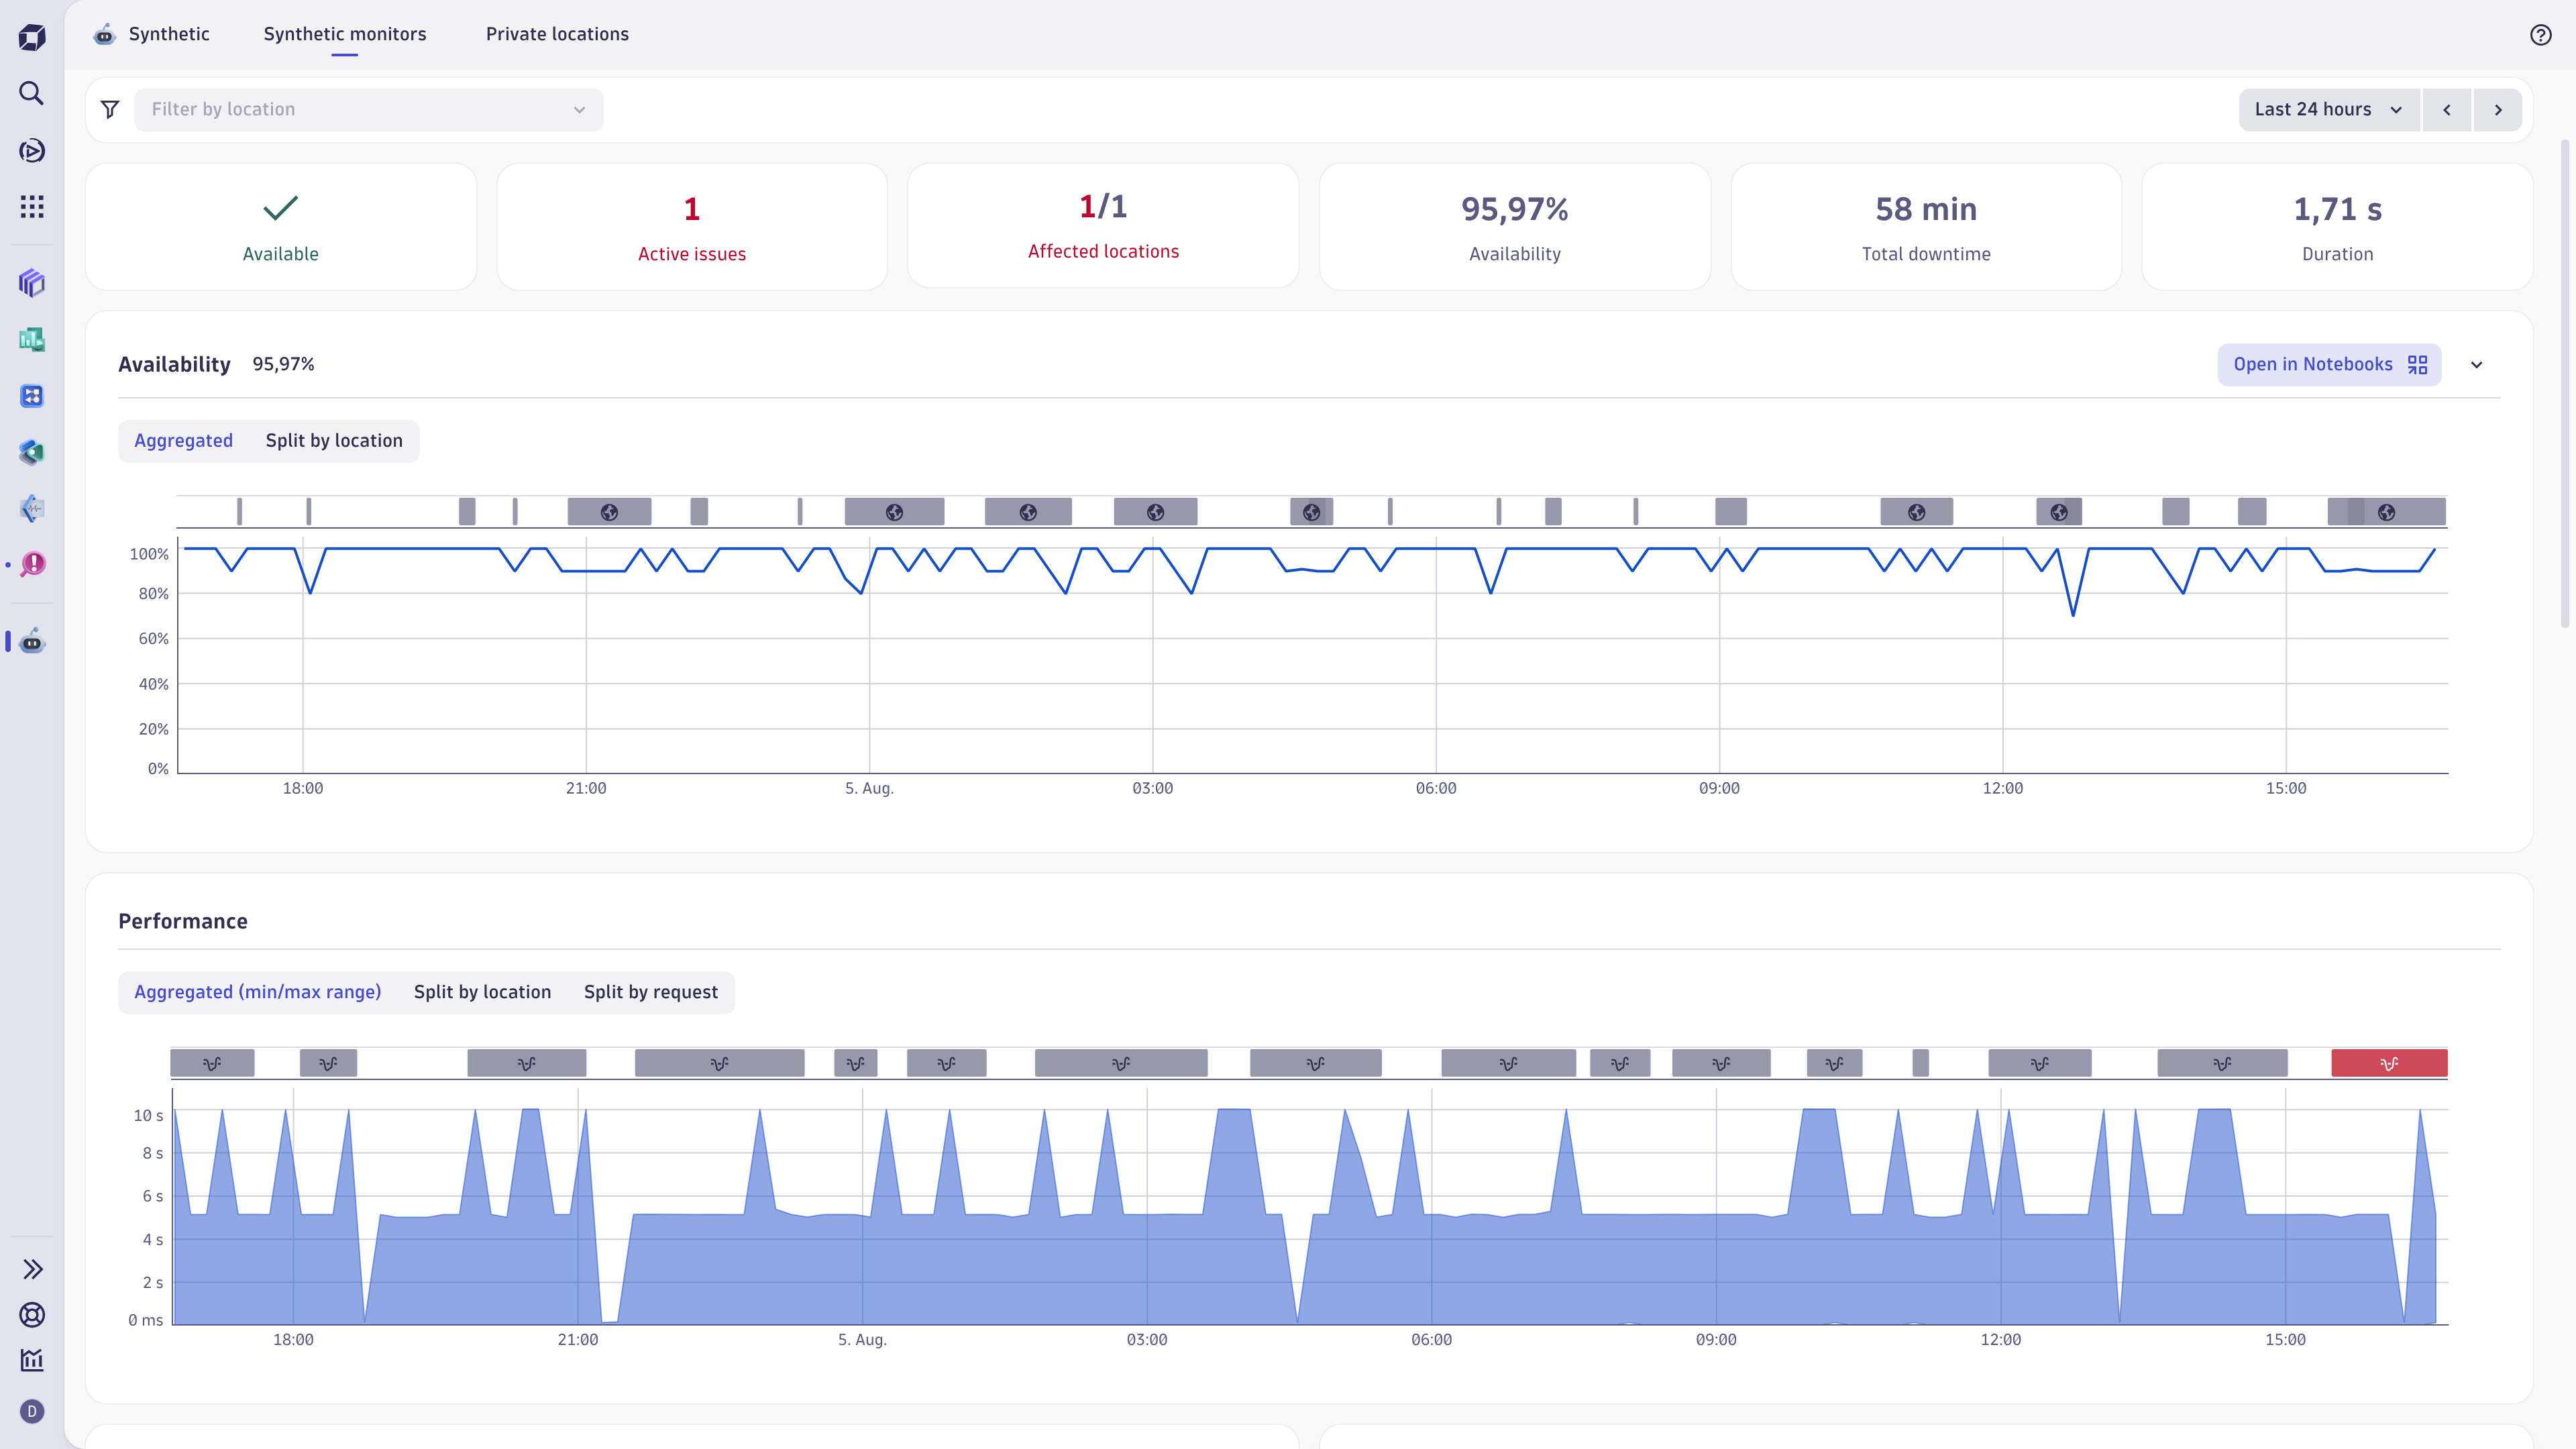
Monitor preview
To display the preview panel for a monitor, select the monitor's row in the Synthetic monitors table.
To browse between your monitors, open the preview panel for any monitor and then select another monitor to switch the preview to the newly selected monitor. Filters are persistent.
The preview panel shows:
-
Availability and Performance health status chips. The chips can be one of the following colors:
- Green—there are no availability or performance problems.
- Red—there are availability or performance problems.
- Gray—no data.
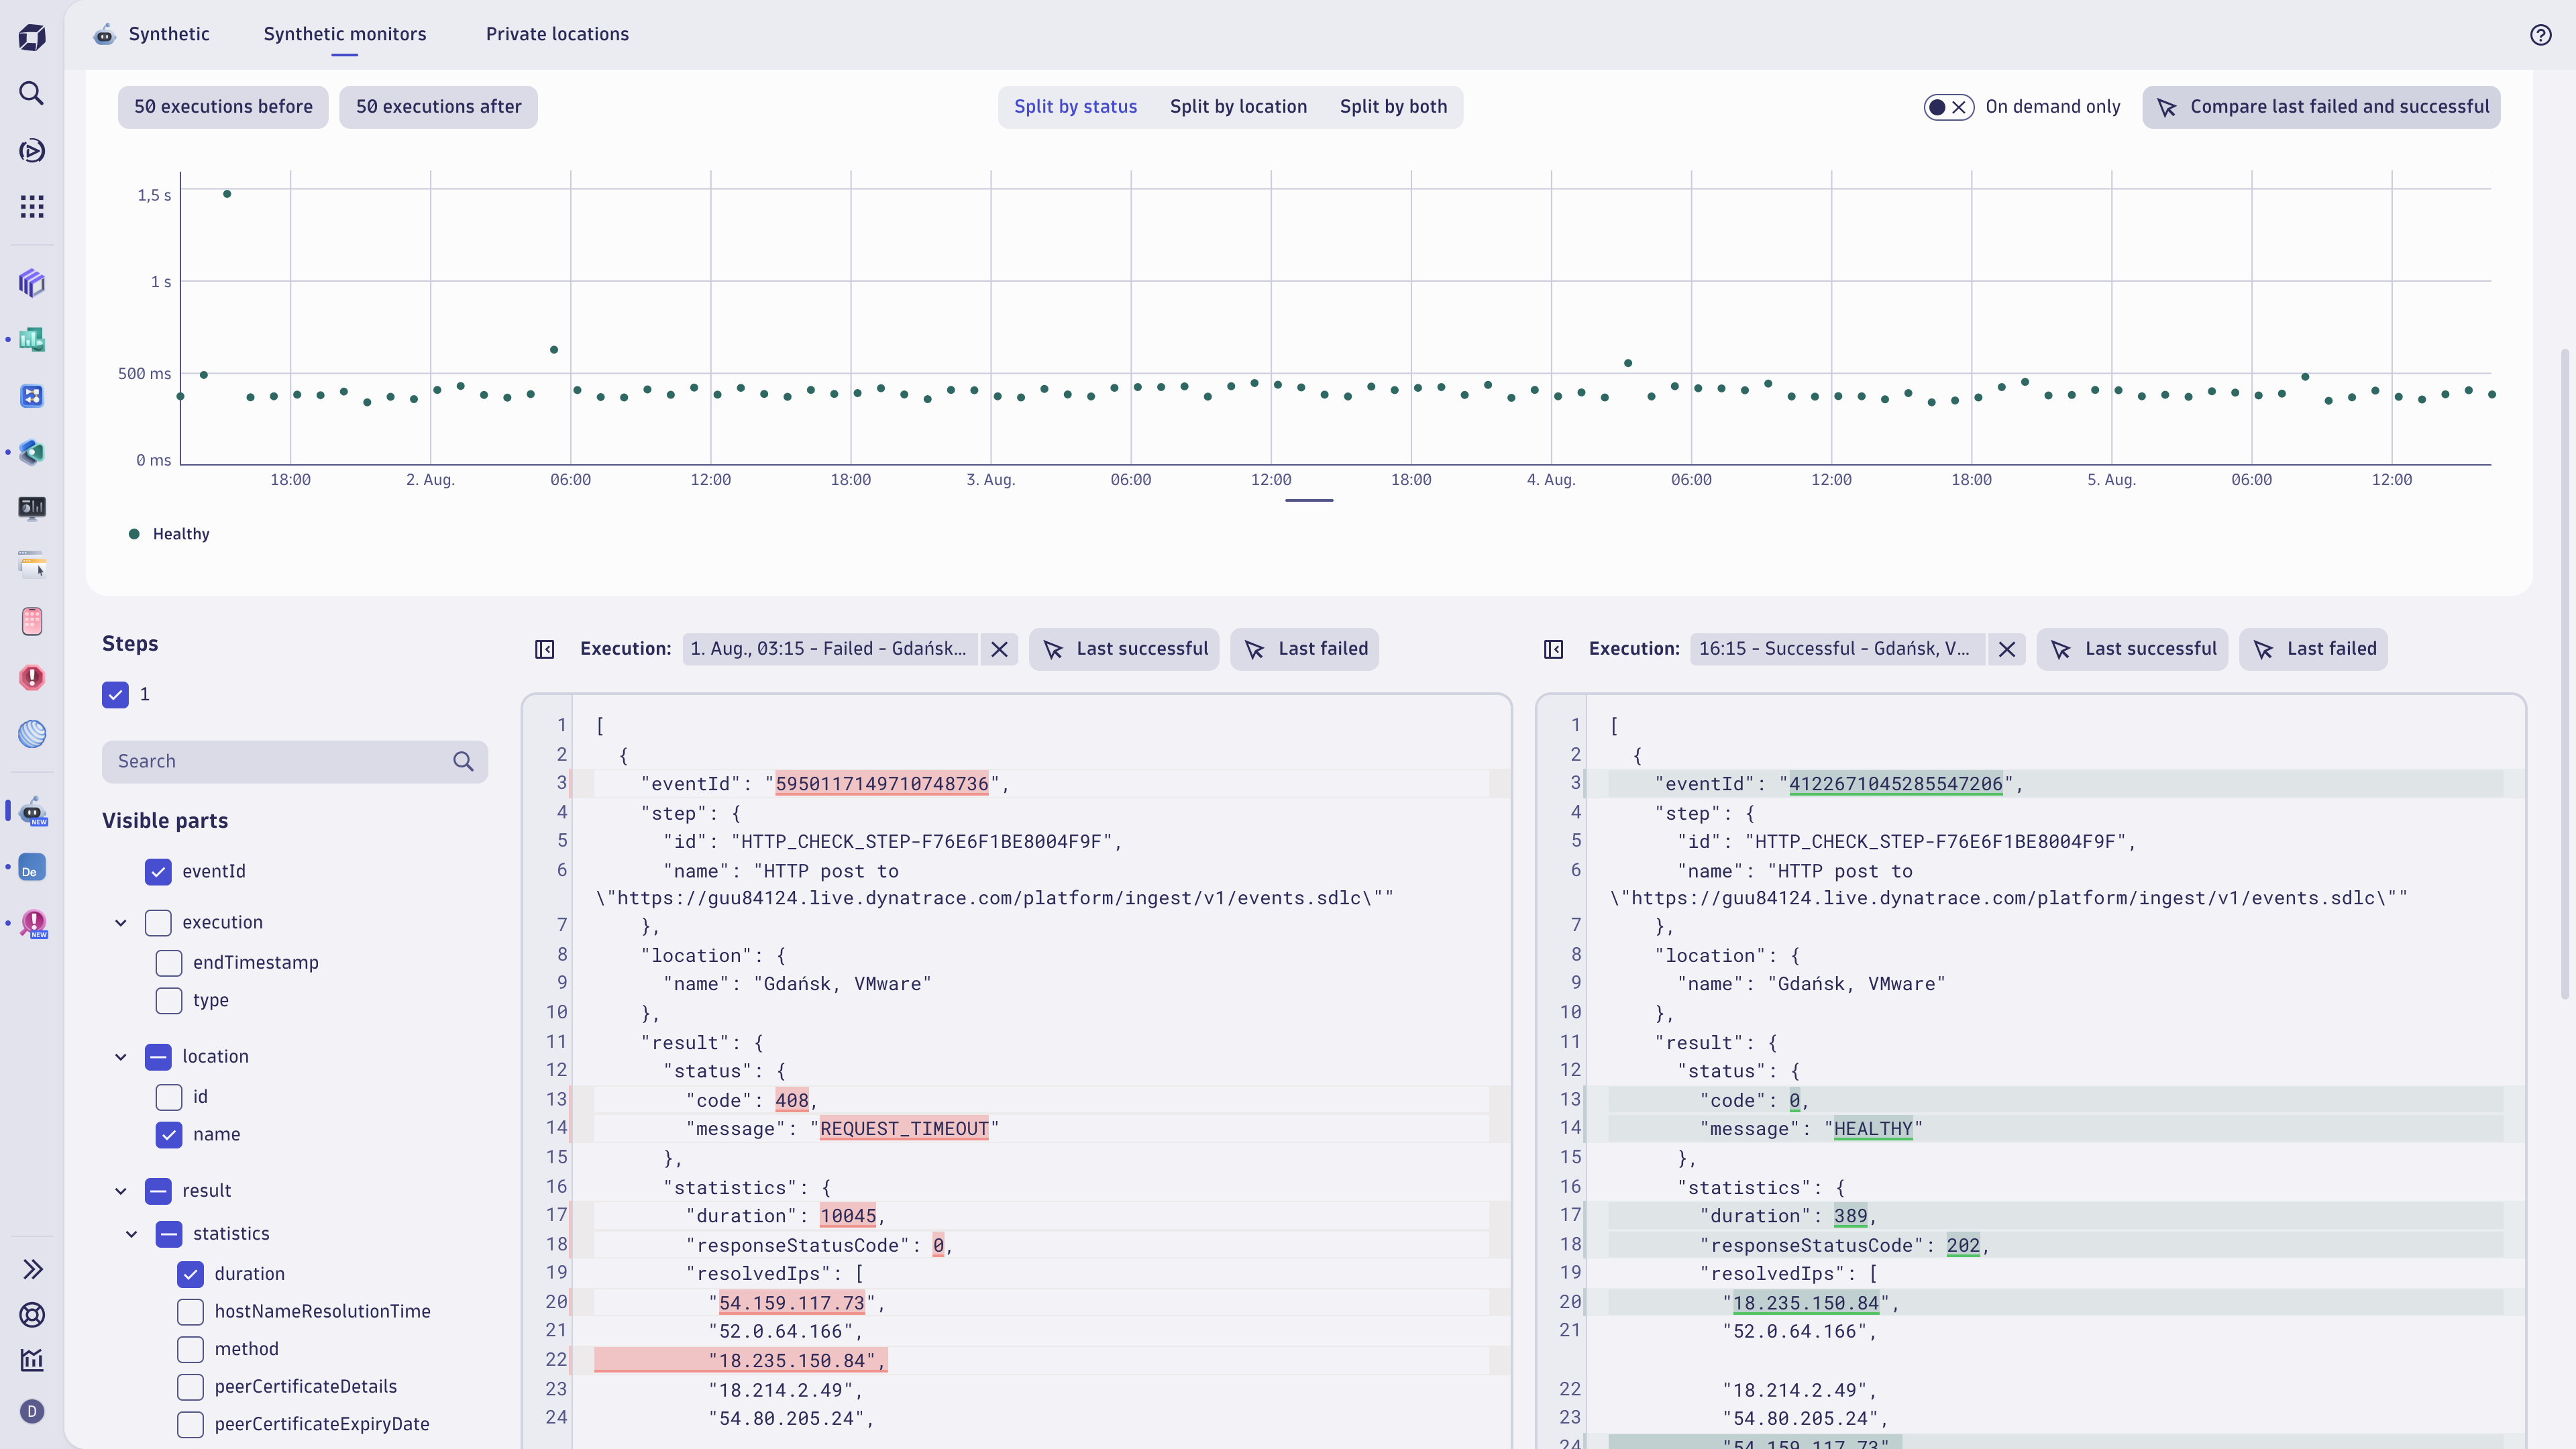
If the red chip is displayed, you can investigate the problems.
- Select the chip.
- Hover over a problem.
- Select Investigate problem. The timeframe when the problem was observed is applied. In the preview panel, all data is displayed for this timeframe. For more details, select View details—you are redirected to the monitor reporting page with the same timeframe applied. There you can:
To exit the problem investigation mode
- Select the chip.
- Hover over a problem.
- Select Exit investigation.
-
Indicators under the health status chips:
-
Availability—the monitors availability rate in percent within specific timeframe.
-
Total downtime—the total outage time for all locations within specific timeframe.
-
Locations—number of locations. If there are locations with problems, the number of affected locations is displayed compared to the total number of locations (for example,
2/10). -
Performance—performance within specific timeframe. The performance calculation depends on the monitor type.
-
-
Tabs:
-
Overview
- Last status—status of the last execution from any location (success, failure, or no data).
- Availability—the monitors availability rate in percent within specific timeframe (here are displayed the same values as in the Availability indicator under the health status chips).
- Performance—performance within specific timeframe (here are displayed the same values as in the Performance indicator under the health status chips). The performance calculation depends on the monitor type.
-
Changes—changes to the monitor: when it was changed, who changed it, and what they changed. You can only access changes from a specified timeframe.
-
Properties—properties such as monitor type, locations, requests in last execution, frequency, steps, and tags.
-
-
Controls in the upper-right corner of the preview panel to:
-
Edit the monitor.
-
View details of the monitor—you are redirected to the monitor reporting page.
-
> Enable a disabled monitor.
-
> Disable an enabled monitor.
-
Close the preview panel.
-
Filters
Filters allowing multiple selections help you find the monitors you're looking for. Expand  or collapse
  the filters to focus on search or results, as required. The filters are automatically collapsed when viewing the quick overview for a monitor.
The following filter categories (each with multiple options) allow you to search for monitors.
| Column | Description |
|---|---|
Type | Monitor type. |
Alert | Monitors with and without availability or performance problems. |
Status | Whether monitors are active or inactive (disabled). |
Number of steps | Monitors which have a number of steps within a specified range, for example, from Min: |
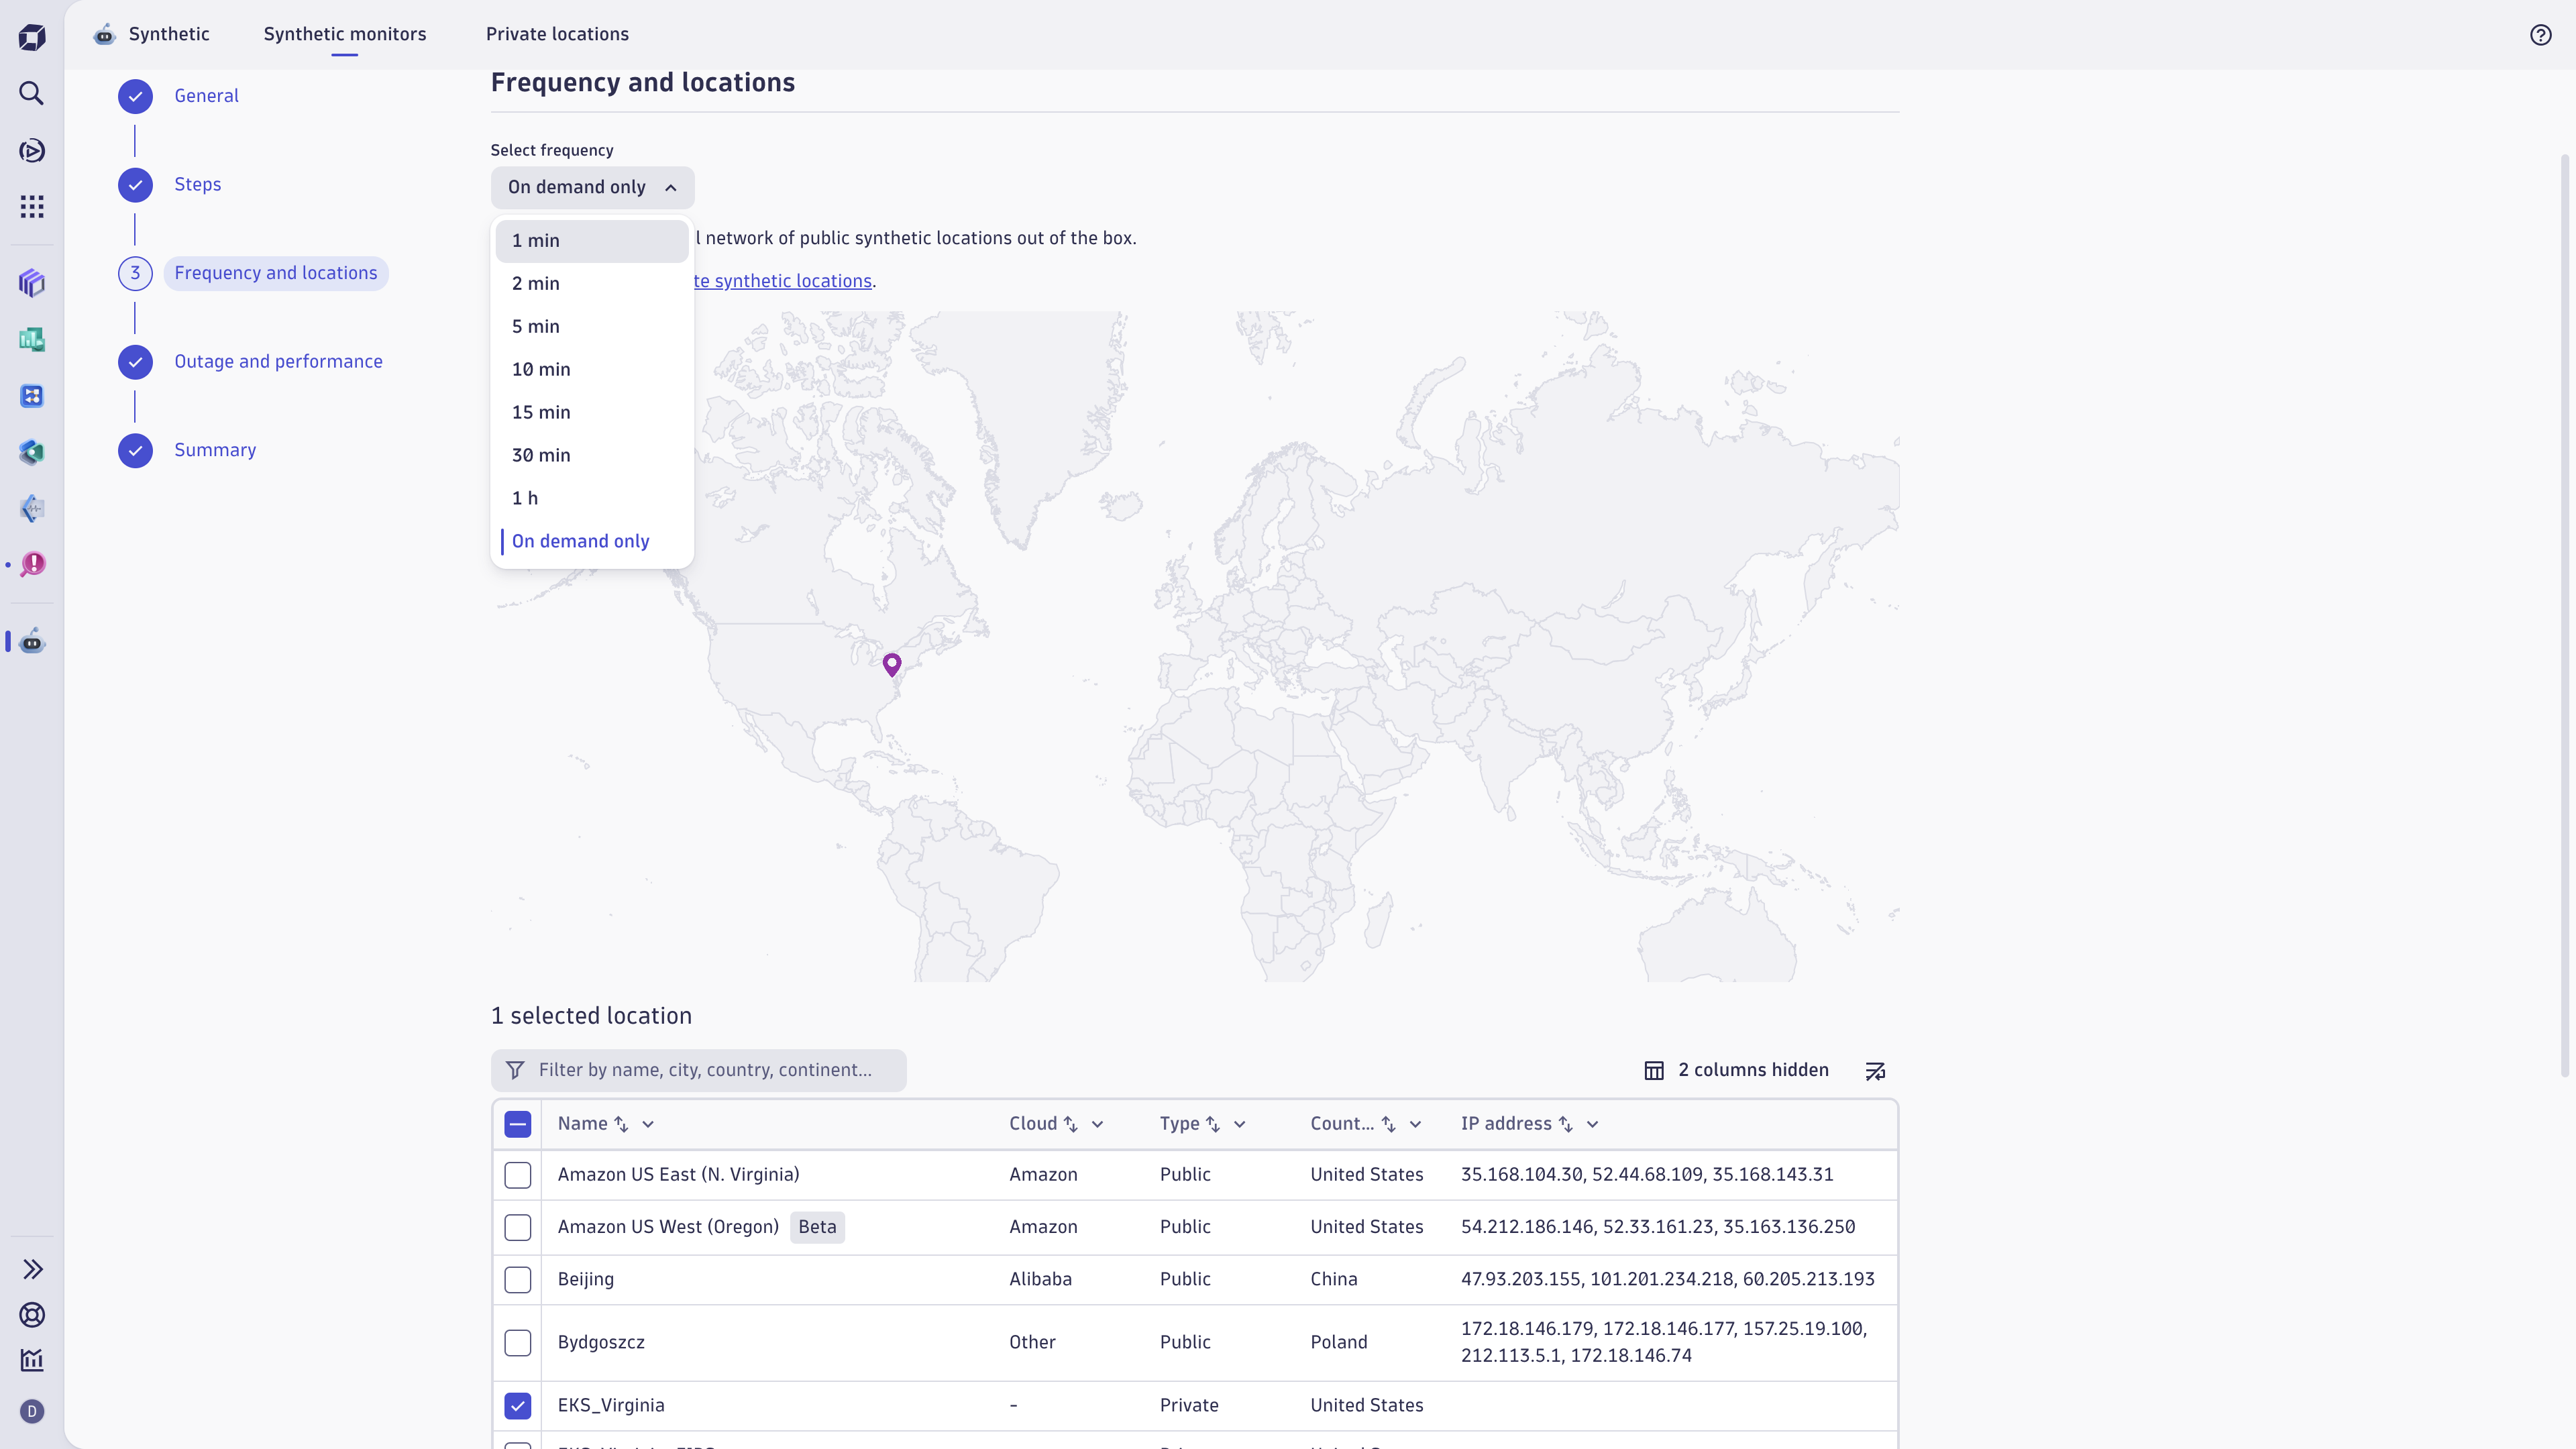
Frequency | Monitoring frequency. |
Created by | ID of the user who created a monitor. |
Last editor | ID of the user who last edited a monitor. |
Location | Public-synthetic-locations and private monitoring locations. |
Frontend | Associated RUM application. |
Tags | Values or key-value pairs applied to monitors; you can choose tags to include or exclude from your search. |
Device profile | For example, |
How filters work
When you select multiple filters within a category, the in logic is used. For example, when filtering monitors by Type, you can select HTTP and NAM-DNS. By doing so, you request the system to return all monitors belonging to either HTTP or NAM-DNS type. In the filter bar, the request will look like this:
Type in (HTTP, "NAM - DNS")
The filter options shown in most categories depend on your monitors; only those filters relevant to your monitors are available. For example, if you have no HTTP monitors, you won't see the HTTP option to filter by.
You can select filters in multiple categories. For example, if you select NAM-DNS and NAM-ICMP in the Type category, and IP and host-group in the Tag category, the system returns all monitors that:
- Are of either the NAM-DNS or NAM-ICMP type,
- And have either the
IPorhost-grouptag.
In the filter bar, the request will look like this:
Type in ("NAM - DNS", "NAM - ICMP") Tag in (IP, "host-group")
Filter bar
The filter bar at the top of the page displays selected filters. You can add or remove filters directly in the filter bar. For example, if you want to filter the browser monitors, type Type = Browser in the filter bar. To remove the filter, select next to the filter.
Apply selected filters
To apply selected filters, select Update next to the filter bar.
Share filters
You can share applied filters—after you apply filters, copy the page URL and share it.
Manage synthetic monitors
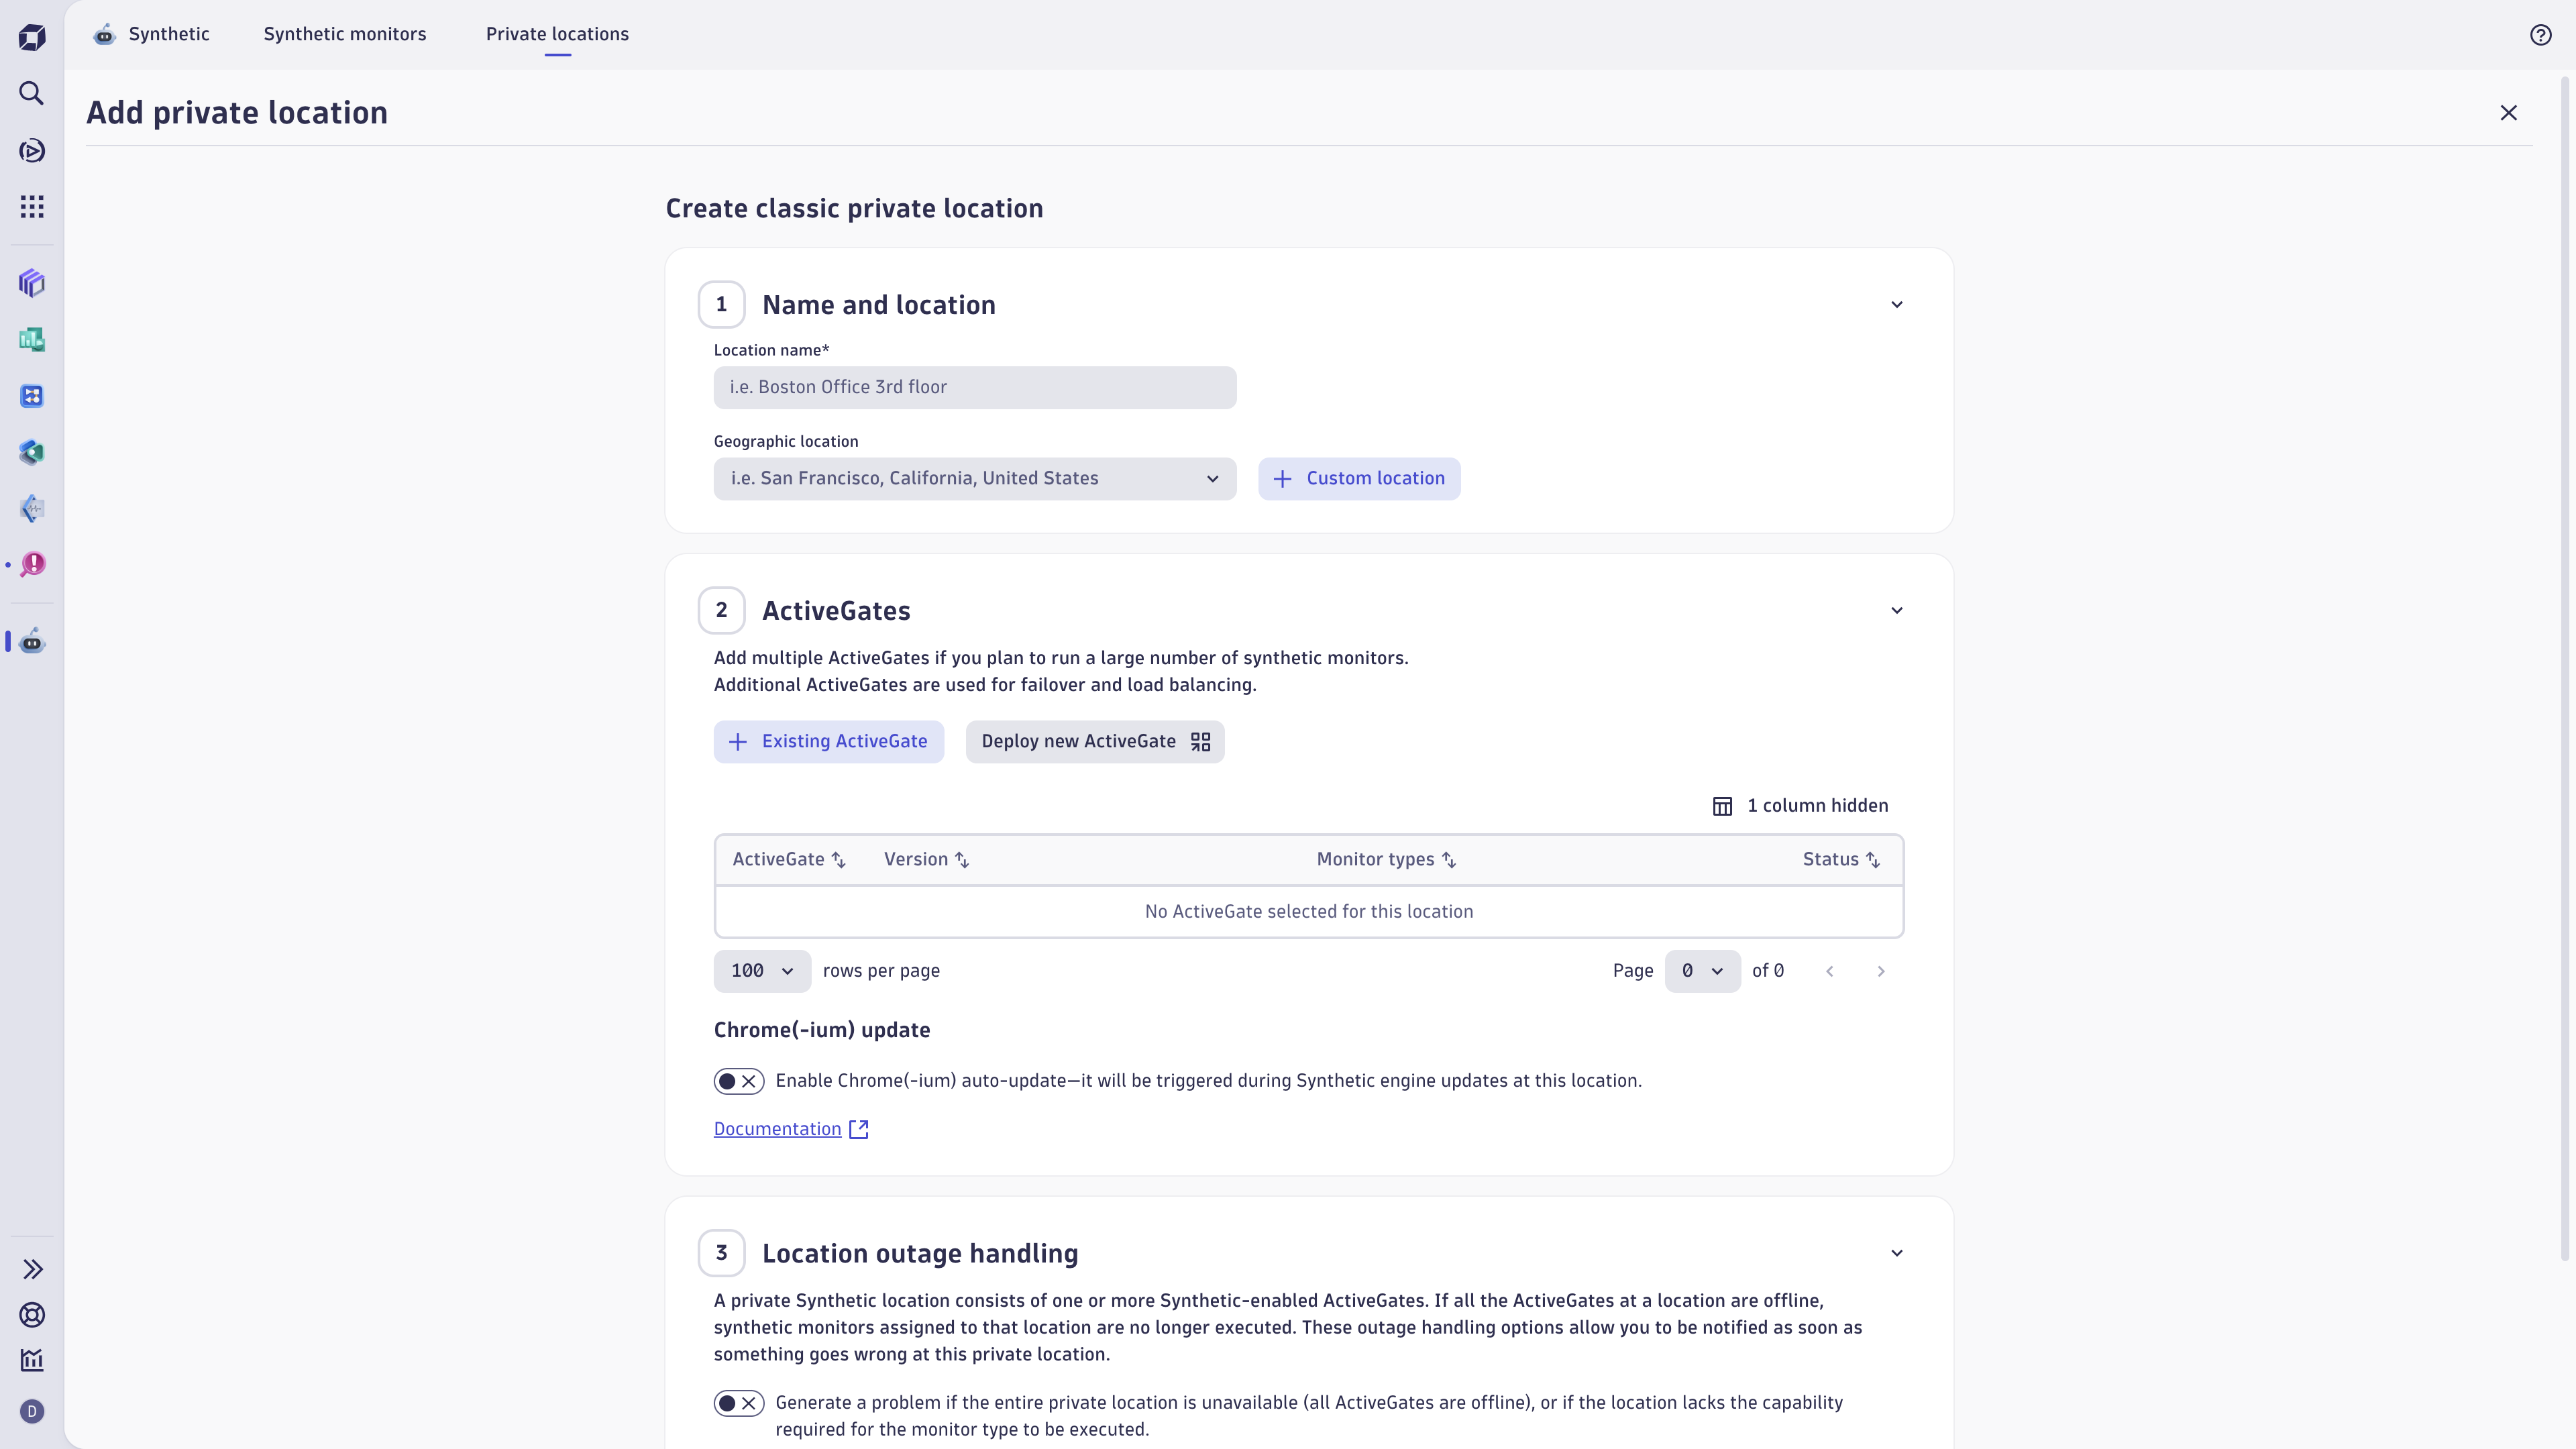
In the Create monitor section, you can choose the type of synthetic monitor that you want to create.
Create monitors
To create a monitor:
-
Select +New monitor in the upper-right corner of
Synthetic. -
Choose one of the following:
- Browser—choosing this option will allow you to create a browser monitor. Learn how to Create and configure a browser monitor.
- HTTP—choosing this option will allow you to create an HTTP monitor. Learn how to HTTP monitors reporting results.
- Network availability—choosing this option will allow you to create a NAM monitor. Learn how to Create a NAM monitor.
Reporting
For each monitor type, you can display a reporting page. See:
Learning modules
To learn how to use Synthetic, see the following learning mudules:
Use cases
- Automatically monitor and test application availability and performance across production and development environments.
- Fix issues and optimize digital experience before users are affected.
- Synthetic capabilities are extended to monitor infrastructure and services that don't expose HTTPS-powered interfaces.sdsd
 SyntheticDigital Experience