Network availability monitors
- Dynatrace Classic
- Reference
- 27-min read
Preview
Network availability monitoring enables you create synthetic network availability monitors of type ICMP, TCP, or DNS.
The Synthetic - Network availability monitors API is part of the Environment API v2. Check the API Explorer (section-api#api-explorer) for more information.
Limitations
Number of requests
The maximum number of requests executed per network availability monitor is 1000.
If a monitor uses target filter, it might not be possible to precisely predict the number of requests in advance of execution (for example, when monitoring an entire host group or a subnet with a wide IP range). In such cases, the limit is applied when target filter is resolved before the monitor's execution into the actual list of addresses.
Operating system
Network availability monitors are not supported on Synthetic-enabled ActiveGate on Windows hosts.
Deployment type
Network availability monitors are supported only on private Synthetic locations.
Containerized locations
Network availability monitors are supported on containerized Synthetic-enabled ActiveGate deployments, but additional permissions are required.
ICMP monitors use the ping executable, which requires the CAP_NET_RAW capability set for the container executing the requests (synthetic-vuc). Additionally, the allowPrivilegeEscalation property of securityContext for this container has to be set to true, because the process that launches the ping executable does not have the required privileges set by default.
The entire securityContext for the synthetic-vuc container with enabled network availability monitors should look as follows.
securityContext:readOnlyRootFilesystem: trueprivileged: falseallowPrivilegeEscalation: truerunAsNonRoot: truecapabilities:drop: ["all"]add: ["NET_RAW"]
POST create a multi-protocol monitor
Monitor schema SyntheticMultiProtocolMonitorUpdateDto
Required
| Parameter | Type | Description |
|---|---|---|
| name* | string | The name of the monitor |
| type* | string | Synthetic monitor type This endpoint supports only multi-protocol monitors. The element can hold the value MULTI_PROTOCOL. |
| frequencyMin* | integer | The frequency of the monitor in minutes |
| locations* | list | The locations to which the monitor is assigned |
| active | boolean | The default value is true. If false, the monitor is disabled. |
| steps* | list | The monitor steps See steps schema. |
| syntheticMonitorOutageHandlingSettings | list | The monitor outage-handling configuration See syntheticMonitorOutageHandlingSettings schema. |
| tags | list | A set of manual tags assigned to the monitor You can specify only the key (required) and value (optional) of the tag here. |
steps schema SyntheticMultiProtocolMonitorStepDto
| Parameter | Type | Description |
|---|---|---|
| name* | string | Step name |
| requestType* | string | Request type The element can hold the values ICMP, TCP, or DNS |
| targetFilter | string | Monitored hosts filter |
| targetList* | list | List of target entities (addresses, IPs) |
| properties* | map<string, string> | The properties that apply to all requests in the step |
| constraints* | list | The list of constraints that apply to the step and all requests in the step See constraints schema. |
| requestConfigurations* | list | Request configurations See requestConfigurations schema. |
requestConfigurations schema SyntheticMultiProtocolRequestConfigurationDto
| Parameter | Type | Description |
|---|---|---|
| constraints | list | The list of constraints that apply to all requests in the step See constraints schema. |
constraints schema SyntheticMultiProtocolMonitorConstraintDto
| Parameter | Type | Description |
|---|---|---|
| type* | string | Constraint type |
| properties* | map<string, string> | The properties of the constraint See script configuration constraints for examples. |
syntheticMonitorOutageHandlingSettings schema SyntheticMonitorOutageHandlingSettingsDto
| Parameter | Type | Description |
|---|---|---|
| globalConsecutiveOutageCountThreshold | integer | Number of consecutive failures for all locations |
| globalOutages* | boolean | Generate a problem and send an alert when the monitor is unavailable for globalConsecutiveOutageCountThreshold or more consecutive executions at all configured locations. |
| localConsecutiveOutageCountThreshold | integer | Number of consecutive failures for any location |
| localLocationOutageCountThreshold | integer | Number of failing locations |
| localOutages* | boolean | Generate a problem and send an alert when the monitor is unavailable for localConsecutiveOutageCountThreshold or more consecutive executions at localLocationOutageCountThreshold or more locations. |
Examples
Example monitor with ICMP requests
{"name": "Sample NAM monitor with ICMP step","type": "MULTI_PROTOCOL","frequencyMin": "1","locations": ["SYNTHETIC_LOCATION-8A91FE7982E24C06"],"active": "true","steps": [{"name": "ICMP step 1","requestType": "ICMP","targetFilter": null,"targetList": ["127.0.0.1","127.0.0.2","127.0.0.3","127.0.0.4"],"name": "ICMP step 1","requestType": "ICMP","targetFilter": null,"targetList": ["127.0.0.1","127.0.0.2","127.0.0.3","127.0.0.4"],"constraints": [{"type": "SUCCESS_RATE_PERCENT","properties": {"value": "49","operator": ">"}}],"properties": {"ICMP_NUMBER_OF_PACKETS": "3","ICMP_TIMEOUT_FOR_REPLY": "PT1S","ICMP_TIMEOUT_FOR_REPLY": "PT1S"},"requestConfigurations": [{"constraints": [{"type": "ICMP_SUCCESS_RATE_PERCENT","properties": {"value": "100"}}]}]}],"syntheticMonitorOutageHandlingSettings": {"globalOutages": true,"localOutages": false,"globalConsecutiveOutageCountThreshold": 1,"localLocationOutageCountThreshold": null,"localConsecutiveOutageCountThreshold": null},"tags": [{"key": "my-icmp-monitor"},{"key": "env","value": "UAT"}]}
Example monitor with TCP requests
{"name": "Sample NAM monitor with TCP step","type": "MULTI_PROTOCOL","frequencyMin": "1","locations": ["SYNTHETIC_LOCATION-8A91FE7982E24C06"],"active": "true","steps": [{"name": "TCP step 1","requestType": "TCP","targetFilter": "hostGroup == my-host-group0 and ipRange == 45-55.*.*.*","targetList": [],"name": "TCP step 1","requestType": "TCP","targetFilter": "hostGroup == my-host-group0 and ipRange == 45-55.*.*.*","targetList": [],"constraints": [{"type": "SUCCESS_RATE_PERCENT","properties": {"value": "66","operator": ">="}}],"properties": {"TCP_PORT_RANGES": "22,443,5501-5509"},"requestConfigurations": [{"constraints": []}]}],"syntheticMonitorOutageHandlingSettings": {"globalOutages": true,"localOutages": false,"globalConsecutiveOutageCountThreshold": 1,"localLocationOutageCountThreshold": null,"localConsecutiveOutageCountThreshold": null},"tags": [{"key": "my-tcp-monitor"},{"key": "env","value": "UAT"}]}
Example monitor with DNS requests
{"name": "Sample NAM monitor with DNS step","type": "MULTI_PROTOCOL","frequencyMin": 1,"locations": ["SYNTHETIC_LOCATION-6F3084B1ECD81DE1"],"active": true,"steps": [{"name": "DNS step 1","requestType": "DNS","targetFilter": null,"targetList": ["dynatrace.com"],"name": "DNS step 1","requestType": "DNS","targetFilter": null,"targetList": ["dynatrace.com"],"constraints": [{"type": "SUCCESS_RATE_PERCENT","properties": {"value": "90","operator": ">="}}],"properties": {"DNS_RECORD_TYPES": "A,AAAA","DNS_SERVER": "10.102.40.11"},"requestConfigurations": [{"constraints": [{"type": "DNS_STATUS_CODE","properties": {"status": "NOERROR","operator": "="}}]}]}],"syntheticMonitorOutageHandlingSettings": {"globalOutages": true,"localOutages": false,"globalConsecutiveOutageCountThreshold": 1,"localLocationOutageCountThreshold": null,"localConsecutiveOutageCountThreshold": null},"tags": [{"key": "my-dns-monitor"},{"key": "env","value": "UAT"}]}
Available script configuration properties
Duration format examples
- 100 milliseconds =
PT0.1S - 500 milliseconds =
PT0.5S - 1 second =
PT1S - 10 seconds =
PT10S - 90 seconds =
PT1M30S - 1 minute =
PT1M - 2 minutes =
PT2M - 5 minutes =
PT5M
ICMP
| Name | Type | Description | Values |
|---|---|---|---|
EXECUTION_TIMEOUT | string:duration | Timeout for the execution of a single request | Valid duration, for example, PT1SDefault value = ICMP_NUMBER_OF_PACKETS × ICMP_TIMEOUT_FOR_REPLY + defaultTimeoutdefaultTimeout = 1sRange = 0–PT2M |
ICMP_NUMBER_OF_PACKETS | integer | Number of echo requests Ping process equivalents are the -c (Linux) and -n (Windows) parameters. | Default value = 1Range = 1–10 |
ICMP_PACKET_SIZE | integer | Data length Ping process equivalents are the -s (Linux) and -l (Windows) parameters. | Default value = 32Range = 0–65500 |
ICMP_TIME_TO_LIVE | integer | Time to live (TTL) Ping process equivalents are the -t (Linux) and -i (Windows) parameters. | Range = 1–255 |
ICMP_TYPE_OF_SERVICE | integer | Type of service Ping process equivalents are the -Q (Linux) and -v (Windows) parameters. | Range = 0–255 |
ICMP_DO_NOT_FRAGMENT_DATA | boolean | Do not fragment. Ping process equivalents are the -M do (Linux) and -f (Windows) parameters. | true or false |
ICMP_TIMEOUT_FOR_REPLY | string:duration | Wait for the echo reply message. Ping process equivalents are the -W (Linux) and -w (Windows) parameters. | Valid duration, for example, PT1SIn milliseconds on Windows; values like PT0.1S are accepted.In seconds on Linux; values like PT1S are required.Default value = PT1SRange = PT1S–PT2S |
The packet transmission interval is hardcoded to 200ms, which corresponds to the minimum value allowed for the -i option of the Linux ping command without requiring elevated privileges.
TCP
DNS
Script configuration constraints
Constraints describe success conditions.
Step-level constraints
SUCCESS_RATE_PERCENT
Percentage of successful requests in a step
Actual success rate = ratio of the number of requests that didn't fail (successful + skipped requests) to all requests
For example, if 1 request has failed, 2 requests are skipped, and 3 requests are successful, the ratio is (2+3)/6 = 83.33%.
| Attribute | Type | Description | Value |
|---|---|---|---|
operator | string | Comparison operator to compare actual and expected value | >=, >, <=, <, =, or !=Default value = >= |
value | integer | Expected value of success rate to use for comparison | Default value = 0Range = 0–100 |
{"type": "SUCCESS_RATE_PERCENT","properties": {"value": "83","operator": ">"}}
ICMP request constraints
ICMP_SUCCESS_RATE_PERCENT
Percentage of successful pings (echo requests) in a request
Actual success rate = ratio of number of the packets received to number of packets sent
For example, if 5 packets were sent and 4 packets were received, the ratio is 4/5 = 80.00%.
| Attribute | Type | Description | Value |
|---|---|---|---|
operator | string | Comparison operator to compare actual and expected value | >=, >, <=, <, =, or !=Default value = >= |
value | integer | Expected value of success rate to use for comparison | Default value = 0Range = 0–100 |
{"type": "ICMP_SUCCESS_RATE_PERCENT","properties": {"value": "79","operator": ">"}}
TCP request constraints
TCP_PORT_UNREACHABLE
This is a special constraint that inverts the execution status for TCP requests. It should be applied if it's expected that the port being checked is unreachable.
This constraint has no configuration properties.
If this constraint is applied:
- When the
Execution timeout (12033)andTCP socket connection error (22000)statuses are detected after performing a connection attempt, they are interpreted asHEALTHY (0). - The
HEALTHY (0)connection status is interpreted asCONSTRAINT_VIOLATED (1401)because we expected a failure. - The
UNEXPECTED_ERROR (-1)andUNKNOWN_HOST (12013)statuses are preserved and reported as is.
{"type": "TCP_PORT_UNREACHABLE","properties": {}}
DNS request constraints
DNS_STATUS_CODE
Verifies the DNS response status code, which indicates whether a query was successful or not.
| Attribute | Type | Description | Value |
|---|---|---|---|
operator | string | Comparison operator to compare actual and expected value | = or !=Default value = = |
statusCode | integer | Numeric code indicating status of DNS response Exclusive with status | Valid code, for example, 0Default value = 0Range = 0–65535 |
status | string | Mnemonic representing DNS status code Exclusive with statusCode | Valid status, for example, NOERRORDefault value = NOERROR |
{"type": "DNS_STATUS_CODE","properties": {"operator": "=","statusCode": "0"}}
{"type": "DNS_STATUS_CODE","properties": {"operator": "=","status": "NOERROR"}}
DNS_IP_ADDRESS
Verifies the IP address value returned in A/AAAA records.
| Attribute | Type | Description | Value |
|---|---|---|---|
quantifier | string | How many records must match the condition for the constraint to pass | any (at least one) or allDefault value = any |
operator | string | Comparison operator | =, != or inDefault values = - = for an address- in for a subnet |
recordType | string | DNS record type | A or AAAADefault values = - A if address/subnet is IPv4- AAAA if address/subnet is IPv6 |
address | string | IPv4 address in dot notation or IPv6 address in colon notation Only with the operators =, !=Exclusive with subnet | Valid address, for example, 192.168.0.1, 2001:db8::2:1 |
subnet | string | IPv4 subnet in dot notation or IPv6 subnet in colon notation, followed by network prefix length Only with the operator inExclusive with address | Valid subnet, for example, 172.22.80.0/20, 2001:db8:85a3::0/48 |
{"constraintType": "DNS_IP_ADDRESS","attributes": {"quantifier": "any","recordType": "A","operator": "=","address": "54.208.9.71"}}
{"constraintType": "DNS_IP_ADDRESS","attributes": {"quantifier": "all","recordType": "A","operator": "in","subnet": "10.102.44.0/24"}}
DNS_RECORD_COUNT
Verifies the count of records of a given type.
| Attribute | Type | Description | Value |
|---|---|---|---|
operator | string | Comparison operator | >=, >, <=, <, =, or !=Default value = > |
recordType | string | DNS record type | Valid record type, for example, MX |
value | integer | Expected record count | Valid count, for example 2Default value = 0Range = 0–65535 |
{"constraintType": "DNS_RECORD_COUNT","attributes": {"recordType": "A","operator": ">","value": "0"}}
DNS_TIME_TO_LIVE
Verifies the time to live (TTL) of records of a given type.
| Attribute | Type | Description | Value |
|---|---|---|---|
quantifier | string | How many records must match the condition for the constraint to pass | any (at least one) or allDefault value = any |
operator | string | Comparison operator | >=, >, <=, <, =, or !=Default value = > |
recordType | string | DNS record type | Valid record type, for example, NS |
value | integer | Expected TTL in seconds | Valid TTL, for example 3600Default value = 0Range = 0–2147483647 |
{"constraintType": "DNS_TIME_TO_LIVE","attributes": {"quantifier": "any","recordType": "A","operator": ">=","value": "30"}}
DNS_RECORD_VALUE
Verifies the raw value of records of a given type, with the value format depending on the record type.
Constraints process all records in a response, regardless of the section to which they belong (answer, authority, or additional).
| Attribute | Type | Description | Value |
|---|---|---|---|
quantifier | string | How many records must match the condition for the constraint to pass | any (at least one) or allDefault value = any |
operator | string | Comparison operator - contains checks if the record value contains a given sequence.- matches checks if record value matches a given pattern. | contains or matchesDefault value = contains |
recordType | string | DNS record type | Valid record type, for example, TXT |
sequence | string | Sequence of characters that the record value should contain Only with the operator containsExclusive with pattern | Non-empty sequence, for example, ms71815323 |
pattern | string | Pattern to be matched against the record value, with * denoting 0 or more charactersOnly with the operator matchesExclusive with sequence | Non-empty pattern, for example, "v=spf1 include:* |
{"constraintType": "DNS_RECORD_VALUE","attributes": {"quantifier": "any","recordType": "TXT","operator": "contains","sequence": "ms71815323"}}
{"constraintType": "DNS_RECORD_VALUE","attributes": {"quantifier": "any","recordType": "TXT","operator": "matches","pattern": "\"v=spf1 include:*"}}
Target filter
Target filter gives an option to filter hosts monitored by Dynatrace or custom devices having IP addresses. With this filter, you can select those two types of targets based on:
- type (
type) - tags (
tag) - host ID (
hostId) (deprecated, works for hosts only, use entity ID instead) - entity ID (
entityId) - host groups (
hostGroup) - management zones (
managementZone) - IP mask (
ipMask) - IP range (
ipRange) - process group instance (
processGroupInstance) - network interfaces of particular custom device (
interfacesOf) - extension name (
extensionName)
IP range and IP mask are filters for hosts or devices known for the Dynatrace server, not an option to scan the network.
Syntax
- Logical operators:
ANDandOR(case insensitive) - Parentheses
- Expression operators:
==and!= - Tag names and values
- Negation ("not"):
!=. - Wildcard:
*(selects all hosts monitored by Dynatrace)
Examples
tag == tagname or hostGroup == group1(tag == tagname1:tagvalue1 or tag == tagname1:tagvalue2) and (hostGroup == group1 or managementZone == zone1)tag != tagname1 and tag != tagname2:tagvaluetag == tagname:tagvalue and (managementZone == zone1 or managementZone == zone2)tag == "[tagwithbrackets and spaces]":"value, with, commas, and, spaces"ipMask == 127.0.0.1/24hostId == HOST-000123type == CUSTOM_DEVICE and ipMask == 172.17.0.2/24entityId == HOST-045BFCDA3F507D30 or entityId == CUSTOM_DEVICE-13081D4B74B3E2C8type == HOST and processGroupInstance == PROCESS_GROUP_INSTANCE-07611353BB98908Ctype == CUSTOM_DEVICE and interfacesOf == CUSTOM_DEVICE-E1A88946BF04D5E7type == CUSTOM_DEVICE and extensionName == "Docker devices"
Metrics and dimensions
Dimensions (all network availability monitors)
| Name | Type | Description | Example value |
|---|---|---|---|
multi_protocol.request.type | string | Type of request | icmp, tcp |
multi_protocol.request.target_address | string | Address of target entity | 54.171.216.19 |
dt.entity.host | string | If available, monitored entity ID for target | HOST-024C103F7F86A290 |
dt.entity.synthetic_location | string | Synthetic location ID (monitored entity ID) | SYNTHETIC_LOCATION-A4F834D72840EFC1 |
dt.entity.multiprotocol_monitor | string | Monitor ID (monitored entity ID) | MULTIPROTOCOL_MONITOR-3F6C9D500287BBAF |
multi_protocol.step.id | numeric | Step sequential ID | 1 |
multi_protocol.request.id | numeric | Request sequential ID | 2 |
multi_protocol.result.status | string | Execution status | HEALTHY, CONSTRAINT_VIOLATED |
multi_protocol.result.status.code | numeric | Numeric representation of the execution status | 0, 1401 |
Monitor metrics (all network availability monitors)
| Name | Type | Dimensions | Description |
|---|---|---|---|
dt.synthetic.multi_protocol.execution_time(latest Dynatrace) builtin:synthetic.multiProtocol.executionTime(previous Dynatrace) | numeric | dt.entity.synthetic_locationdt.entity.multiprotocol_monitor | Duration between start and end time of visit execution (in milliseconds) Metric available only if visit execution took place; both start time and end times must be available. |
dt.synthetic.multi_protocol.success_rate(latest Dynatrace) builtin:synthetic.multiProtocol.successRate(previous Dynatrace) | numeric | dt.entity.synthetic_locationdt.entity.multiprotocol_monitor | Ratio of executed steps that didn't fail (successes + skips) to all executed steps We take into account steps that were actually executed rather than steps intended to be executed. For example, with 2 successful steps, 1 failed step, and 8 not started, the ratio is 2/3, or 66.67%. |
dt.synthetic.multi_protocol.availability(latest Dynatrace) builtin:synthetic.multiProtocol.availability(previous Dynatrace) | numeric | dt.entity.synthetic_locationdt.entity.multiprotocol_monitor | Availability calculated based on the execution status of visits - 100% for code= 0: HEALTHY, SCRIPT_FINISH, SKIPPED- 0% for error status codes such as 1401 - CONSTRAINT_VIOLATED |
dt.synthetic.multi_protocol.executions(latest Dynatrace) builtin:synthetic.multiProtocol.executions(previous Dynatrace) | numeric | dt.entity.synthetic_locationdt.entity.multiprotocol_monitormulti_protocol.result.statusmulti_protocol.result.status.code | Number of monitor executions in time |
dt.synthetic.multi_protocol.availability.excluding_maintenance_windows(latest Dynatrace) builtin:synthetic.multiProtocol.availability.excludingMaintenanceWindows(previous Dynatrace) | numeric | dt.entity.synthetic_locationdt.entity.multiprotocol_monitor | Availability calculated based on the execution status of visits, reported only if no maintenance window is defined for the monitor - 100% for code= 0: HEALTHY, SCRIPT_FINISH, SKIPPED- 0% for error status codes such as 1401 - CONSTRAINT_VIOLATED |
Step metrics (all network availability monitors)
| Name | Type | Dimensions | Description |
|---|---|---|---|
dt.synthetic.multi_protocol.step.execution_time(latest Dynatrace) builtin:synthetic.multiProtocol.step.executionTime(previous Dynatrace) | numeric | multi_protocol.request.typedt.entity.synthetic_locationdt.entity.multiprotocol_monitormulti_protocol.step.id | Duration between start and end time of step execution (in milliseconds) Metric available only if step execution took place, with a well-defined end time; therefore, it's not available for skipped steps. |
dt.synthetic.multi_protocol.step.success_rate(latest Dynatrace) builtin:synthetic.multiProtocol.step.successRate(previous Dynatrace) | numeric | multi_protocol.request.typedt.entity.synthetic_locationdt.entity.multiprotocol_monitormulti_protocol.step.id | Ratio of executed requests that didn't fail (successes + skips) to all executed requests If a step was skipped (by any of its preceding steps), it doesn't have a success rate; we treat it as if it wasn't executed. If a step doesn't have executed requests (because its pre-execution script failed or issued SCRIPT_FINISH), we return the value 0% (for failures) or 100% (for finished).For example, with 2 successful, 1 failed, and 4 skipped requests, the ratio is 6/7, or 85.71%. |
dt.synthetic.multi_protocol.step.availability(latest Dynatrace) builtin:synthetic.multiProtocol.step.availability(previous Dynatrace) | numeric | multi_protocol.request.typedt.entity.synthetic_locationdt.entity.multiprotocol_monitormulti_protocol.step.id | Availability calculated based on the execution status of steps - 100% for code= 0: HEALTHY, SCRIPT_FINISH, SKIPPED- 0% for error status codes such as 1401 - CONSTRAINT_VIOLATED |
dt.synthetic.multi_protocol.step.executions(latest Dynatrace) builtin:synthetic.multiProtocol.step.executions(previous Dynatrace) | numeric | multi_protocol.request.typedt.entity.synthetic_locationdt.entity.multiprotocol_monitormulti_protocol.step.idmulti_protocol.result.statusmulti_protocol.result.status.code | Number of step executions in time |
dt.synthetic.multi_protocol.step.availability.excluding_maintenance_windows(latest Dynatrace) builtin:synthetic.multiProtocol.step.availability.excludingMaintenanceWindows(previous Dynatrace) | numeric | multi_protocol.request.typedt.entity.synthetic_locationdt.entity.multiprotocol_monitormulti_protocol.step.id | Availability calculated based on the execution status of steps, reported only if no maintenance window is defined for the monitor - 100% for code= 0: HEALTHY, SCRIPT_FINISH, SKIPPED- 0% for error status codes such as 1401 - CONSTRAINT_VIOLATED |
Request metrics (all network availability monitors)
| Name | Type | Dimensions | Description |
|---|---|---|---|
dt.synthetic.multi_protocol.request.availability(latest Dynatrace) builtin:synthetic.multiProtocol.request.availability(previous Dynatrace) | numeric | multi_protocol.request.typemulti_protocol.request.target_addressdt.entity.host (only for monitors with filter defined)dt.entity.synthetic_locationdt.entity.multiprotocol_monitormulti_protocol.step.idmulti_protocol.request.id | Availability calculated based on the execution status of requests - 100% for code= 0: HEALTHY, SCRIPT_FINISH, SKIPPED- 0% for error status codes such as 1401 - CONSTRAINT_VIOLATED |
dt.synthetic.multi_protocol.request.executions(latest Dynatrace) builtin:synthetic.multiProtocol.request.executions(previous Dynatrace) | numeric | multi_protocol.request.typemulti_protocol.request.target_addressdt.entity.host (only for monitors with filter defined)dt.entity.synthetic_locationdt.entity.multiprotocol_monitormulti_protocol.step.idmulti_protocol.request.idmulti_protocol.result.statusmulti_protocol.result.status.code | Number of request executions in time |
dt.synthetic.multi_protocol.request.availability.excluding_maintenance_windows(latest Dynatrace) builtin:synthetic.multiProtocol.request.availability.excludingMaintenanceWindows(previous Dynatrace) | numeric | multi_protocol.request.typemulti_protocol.request.target_addressdt.entity.host (only for monitors with filter defined)dt.entity.synthetic_locationdt.entity.multiprotocol_monitormulti_protocol.step.idmulti_protocol.request.id | Availability calculated based on the execution status of requests, reported only if no maintenance window is defined for the monitor - 100% for code= 0: HEALTHY, SCRIPT_FINISH, SKIPPED- 0% for error status codes such as 1401 - CONSTRAINT_VIOLATED |
ICMP monitor metrics
| Name | Type | Dimensions | Description |
|---|---|---|---|
dt.synthetic.multi_protocol.icmp.success_rate(latest Dynatrace) builtin:synthetic.multiProtocol.icmp.successRate(previous Dynatrace) | numeric | multi_protocol.request.typemulti_protocol.request.target_addressdt.entity.host (only for monitors with filter defined)dt.entity.synthetic_locationdt.entity.multiprotocol_monitormulti_protocol.step.idmulti_protocol.request.id | Ratio of received packets to sent packets Doesn't take into account the configured number of packets to be sent. For example, out of 10 packets to be sent, if 5 were sent and 4 were received, the ratio is 4/5, or 80.00%. |
dt.synthetic.multi_protocol.icmp.packets_sent(latest Dynatrace) builtin:synthetic.multiProtocol.icmp.packetsSent(previous Dynatrace) | numeric | multi_protocol.request.typemulti_protocol.request.target_addressdt.entity.host (only for monitors with filter defined)dt.entity.synthetic_locationdt.entity.multiprotocol_monitormulti_protocol.step.idmulti_protocol.request.id | Total number of packets sent |
dt.synthetic.multi_protocol.icmp.packets_received(latest Dynatrace) builtin:synthetic.multiProtocol.icmp.packetsReceived(previous Dynatrace) | numeric | multi_protocol.request.typemulti_protocol.request.target_addressdt.entity.host (only for monitors with filter defined)dt.entity.synthetic_locationdt.entity.multiprotocol_monitormulti_protocol.step.idmulti_protocol.request.id | Number of packets that were returned successfully |
dt.synthetic.multi_protocol.icmp.average_round_trip_time(latest Dynatrace) builtin:synthetic.multiProtocol.icmp.averageRoundTripTime(previous Dynatrace) | numeric | multi_protocol.request.typemulti_protocol.request.target_addressdt.entity.host (only for monitors with filter defined)dt.entity.synthetic_locationdt.entity.multiprotocol_monitormulti_protocol.step.idmulti_protocol.request.id | Average round-trip time (RTT) |
dt.synthetic.multi_protocol.icmp.min_round_trip_time(latest Dynatrace) builtin:synthetic.multiProtocol.icmp.minRoundTripTime(previous Dynatrace) | numeric | multi_protocol.request.typemulti_protocol.request.target_addressdt.entity.host (only for monitors with filter defined)dt.entity.synthetic_locationdt.entity.multiprotocol_monitormulti_protocol.step.idmulti_protocol.request.id | Minimum RTT |
dt.synthetic.multi_protocol.icmp.max_round_trip_time(latest Dynatrace) builtin:synthetic.multiProtocol.icmp.maxRoundTripTime(previous Dynatrace) | numeric | multi_protocol.request.typemulti_protocol.request.target_addressdt.entity.host (only for monitors with filter defined)dt.entity.synthetic_locationdt.entity.multiprotocol_monitormulti_protocol.step.idmulti_protocol.request.id | Maximum RTT |
dt.synthetic.multi_protocol.icmp.request_execution_time(latest Dynatrace) builtin:synthetic.multiProtocol.icmp.requestExecutionTime(previous Dynatrace) | numeric | multi_protocol.request.typemulti_protocol.request.target_addressdt.entity.host (only for monitors with filter defined)dt.entity.synthetic_locationdt.entity.multiprotocol_monitormulti_protocol.step.idmulti_protocol.request.id | Duration between start and end time of request handling (in milliseconds) This metric is always provided, even if actual request execution did not take place (for example, because of exceptions or timeouts). Diagnostic metric—allows for validation of external ping process execution time. |
TCP monitor dimensions
| Name | Type | Description | Example value |
|---|---|---|---|
multi_protocol.request.tcp_port_number | string | TCP request port number, as provided in monitor configuration | 665 |
TCP monitor metrics
| Name | Type | Dimensions | Description |
|---|---|---|---|
dt.synthetic.multi_protocol.tcp.connection_time(latest Dynatrace) builtin:synthetic.multiProtocol.tcp.connectionTime(previous Dynatrace) | numeric | multi_protocol.request.typemulti_protocol.request.target_addressdt.entity.host (only for monitors with filter defined)dt.entity.synthetic_locationdt.entity.multiprotocol_monitormulti_protocol.step.idmulti_protocol.request.idmulti_protocol.request.tcp_port_number | Duration between start time (socket creation and connection) and end time (when confection is successfully established) in milliseconds Metric available only if request execution took place (with no exceptions or timeouts), with a well-defined end time |
DNS monitor dimensions
| Name | Type | Description | Example value |
|---|---|---|---|
multi_protocol.request.dns_record_type | string | DNS record type to be queried by request, as provided in configuration | A, AAAA, CNAME |
DNS monitor metrics
| Name | Type | Dimensions | Description |
|---|---|---|---|
dt.synthetic.multi_protocol.dns.resolution_time(latest Dynatrace) builtin:synthetic.multiProtocol.dns.resolutionTime(previous Dynatrace) | numeric | multi_protocol.request.typemulti_protocol.request.target_addressdt.entity.host (only for monitors with filter defined)dt.entity.synthetic_locationdt.entity.multiprotocol_monitormulti_protocol.step.idmulti_protocol.request.id | Duration between start and end time of the request to the DNS server, in milliseconds Metric available only if request execution took place (with no exceptions or timeouts), with a well-defined end time |
Execution statuses
All network availability monitors
| Code / message | Example | Description |
|---|---|---|
0 HEALTHY | - | All is well. |
-1 UNEXPECTED_ERROR | Resource saturation | Unexpected problem that's usually related to monitor's execution components |
1401 CONSTRAINT_VIOLATED | - | Constraint conditions that were defined in monitor's configuration were not met. |
1604 VALIDATION_ERROR | - | Improper monitor configuration detected |
12013 UNKNOWN_HOST | Error in the hostname | IP address of the host cannot be determined. There can be several issues that can cause this error. - Invalid hostname - DNS server unreachable - DNS cache issues - Firewall or proxy interference |
12033 Execution timeout | Server operates slowly. | Timeout of request execution—there can be several issues that can cause this error. - Network issues - Slow or unresponsive server or service - Connection blocked by firewall rules - Timeout is too small. |
TCP monitor execution statuses
| Code / message | Example | Description |
|---|---|---|
22000 TCP socket connection error | Service is not listening on a specified port. | This status means that the host was identified and available but the TCP connection could not be established or was unexpectedly closed. Additional explanation for the exact exception is provided. The status is used if a java.net.SocketException is thrown during the connection attempt. There can be several issues that can cause this error.- Service is not listening on the specified port. - Service reached resource or connection limit. - Service became unavailable during the socket connection process. |
Sample DQL queries to extract data
These examples use Notebooks  and demonstrate how to work with the results of network availability monitors. They use result metrics as a starting point to explore possibilities of extracting and interpreting data with DQL.
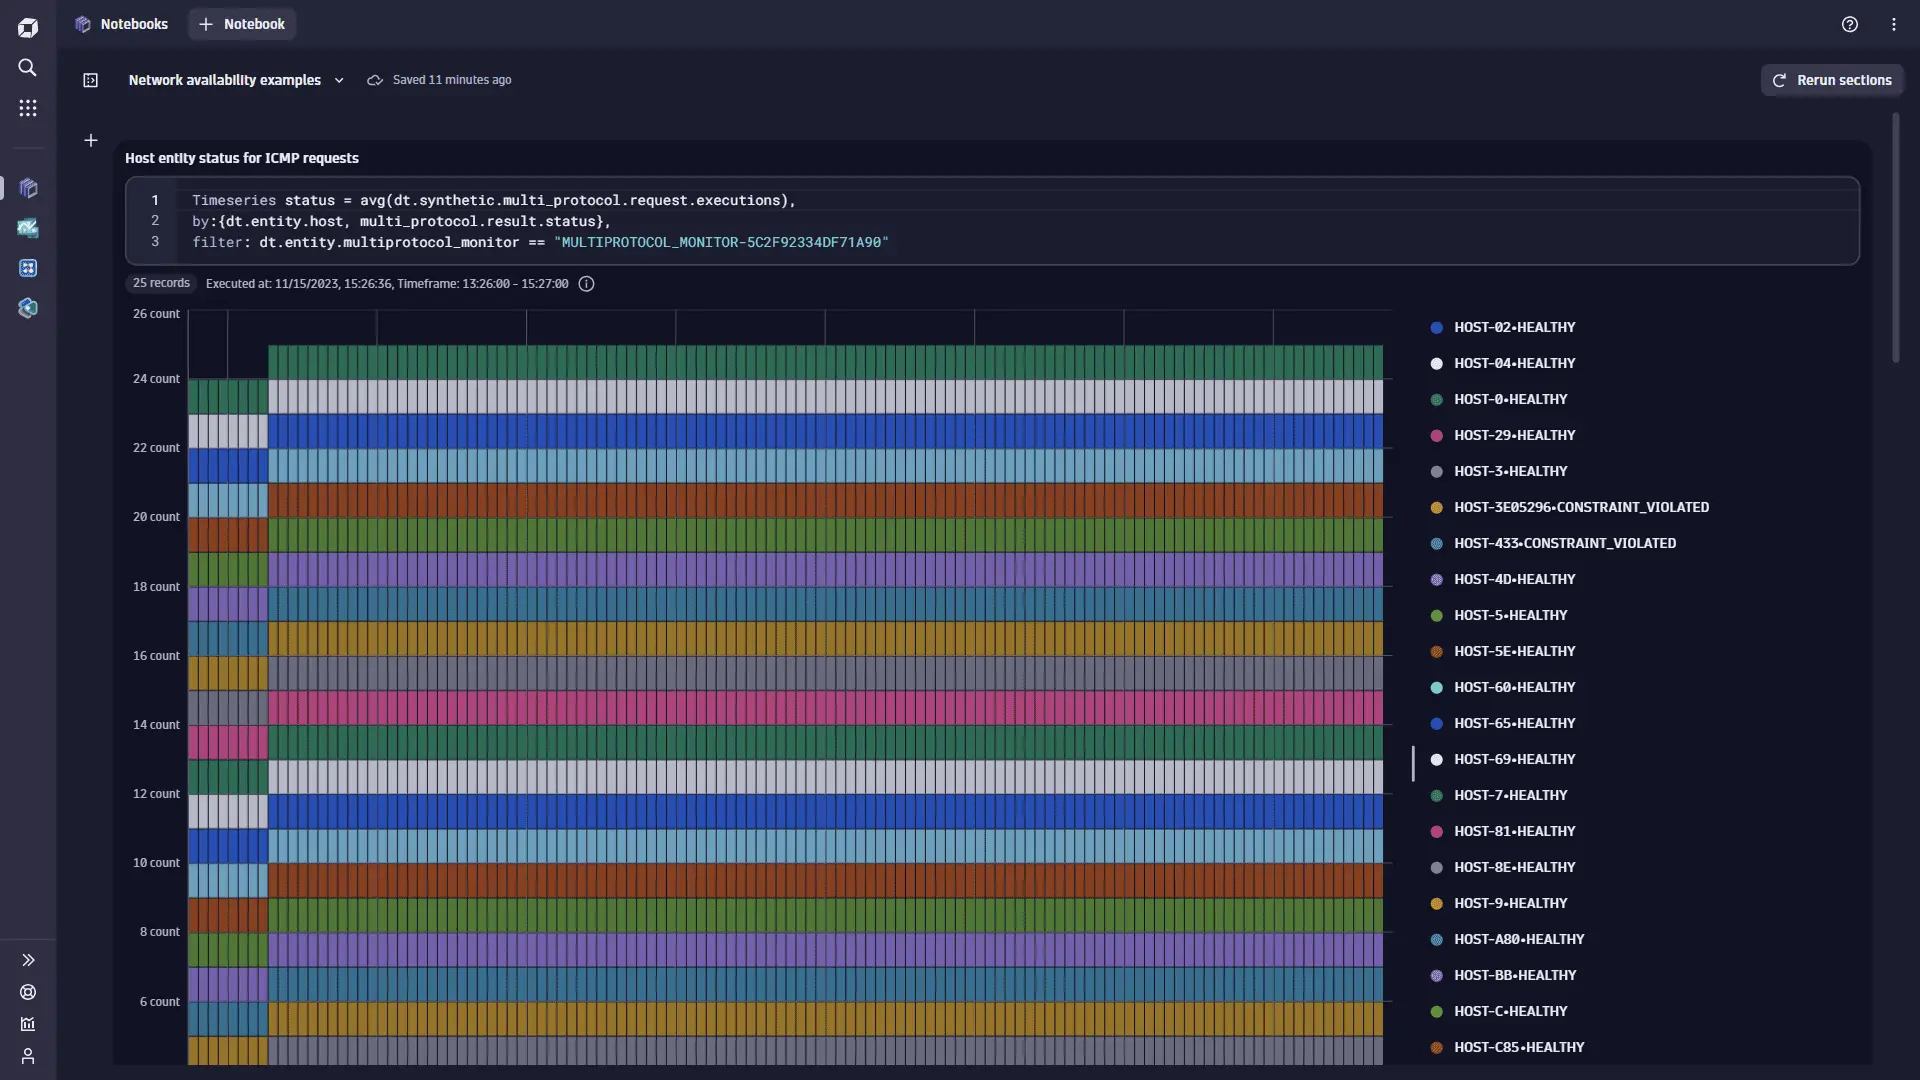
Host entity status for ICMP requests
The monitor MULTIPROTOCOL_MONITOR-5C2F92334DF71A90 executes ICMP requests and filters monitored hosts with "targetFilter": "hostGroup == e2e-synthetic-private-location" (which resolves to about 26 hosts). By using the dt.synthetic.multi_protocol.request.executions metric and splitting it by the dt.entity.host and multi_protocol.result.status dimensions, we can display the status of the connection to a particular monitored host entity in this host group. Some hosts do not fulfill expected success rate; instead of being HEALTHY, their requests are marked as CONSTRAINT_VIOLATED.
Timeseries status = avg(dt.synthetic.multi_protocol.request.executions),by:{dt.entity.host, multi_protocol.result.status},filter: dt.entity.multiprotocol_monitor == "MULTIPROTOCOL_MONITOR-5C2F92334DF71A90"
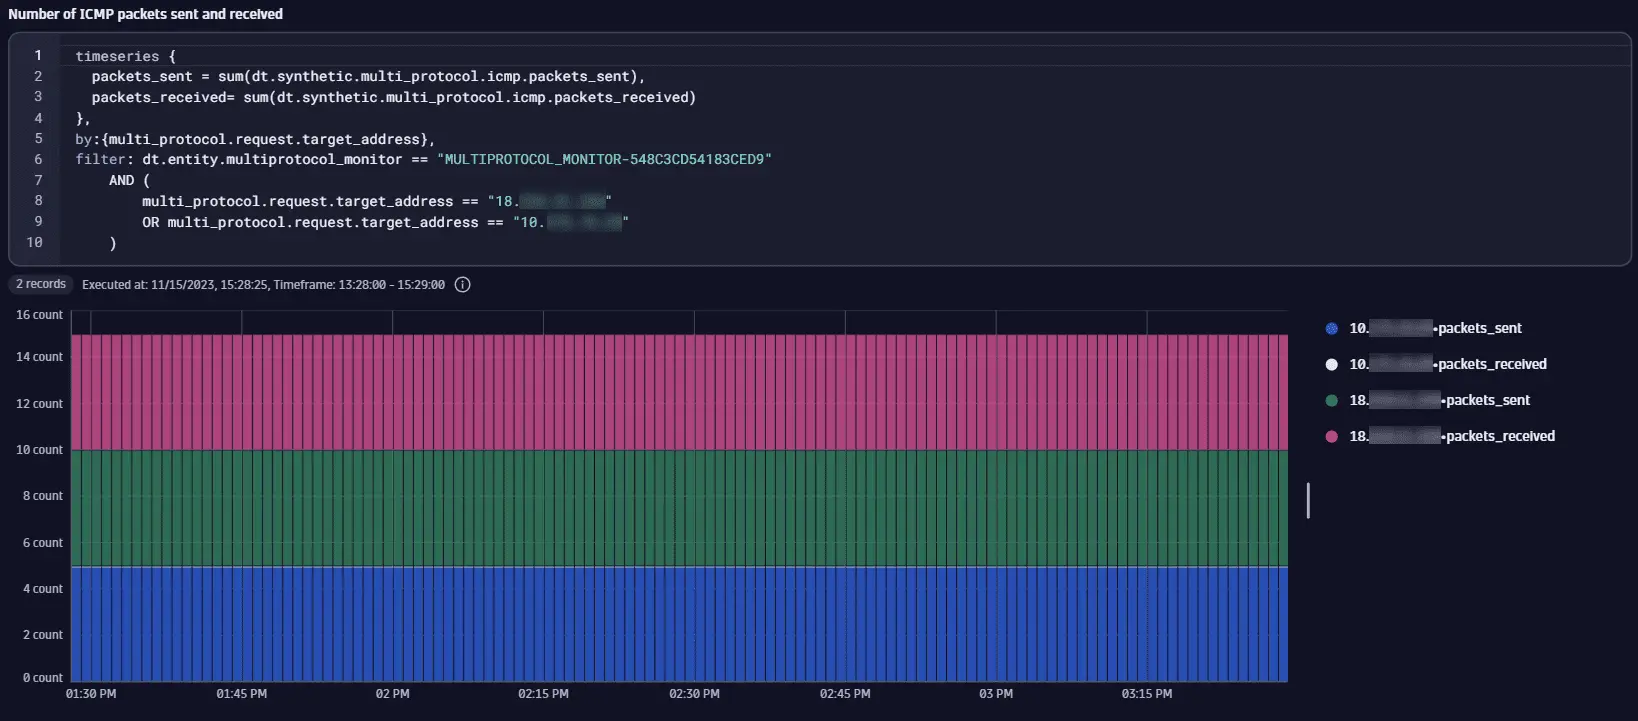
Number of ICMP packets sent and received
The monitor MULTIPROTOCOL_MONITOR-548C3CD54183CED9 executes ICMP requests to hosts with the explicitly defined IP addresses, 18.x.x.x, 10.x.x.x, and 34.x.x.x. Each of these IP addresses maps to a distinct host. We use the sum of the dt.synthetic.multi_protocol.icmp.packets_sent and the sum of the dt.synthetic.multi_protocol.icmp.packets_received metrics to get insight into how many packets were sent and received. We split results by the multi_protocol.request.target_address dimension and filter data for 18.x.x.x and 10.x.x.x only. For 18.x.x.x, the same number of packets were received as were sent, but for 10.x.x.x, all packets are lost and none were received.
timeseries {packets_sent = sum(dt.synthetic.multi_protocol.icmp.packets_sent),packets_received= sum(dt.synthetic.multi_protocol.icmp.packets_received)},by:{multi_protocol.request.target_address},filter: dt.entity.multiprotocol_monitor == "MULTIPROTOCOL_MONITOR-548C3CD54183CED9"AND (multi_protocol.request.target_address == "18.x.x.x"OR multi_protocol.request.target_address == "10.x.x.x")
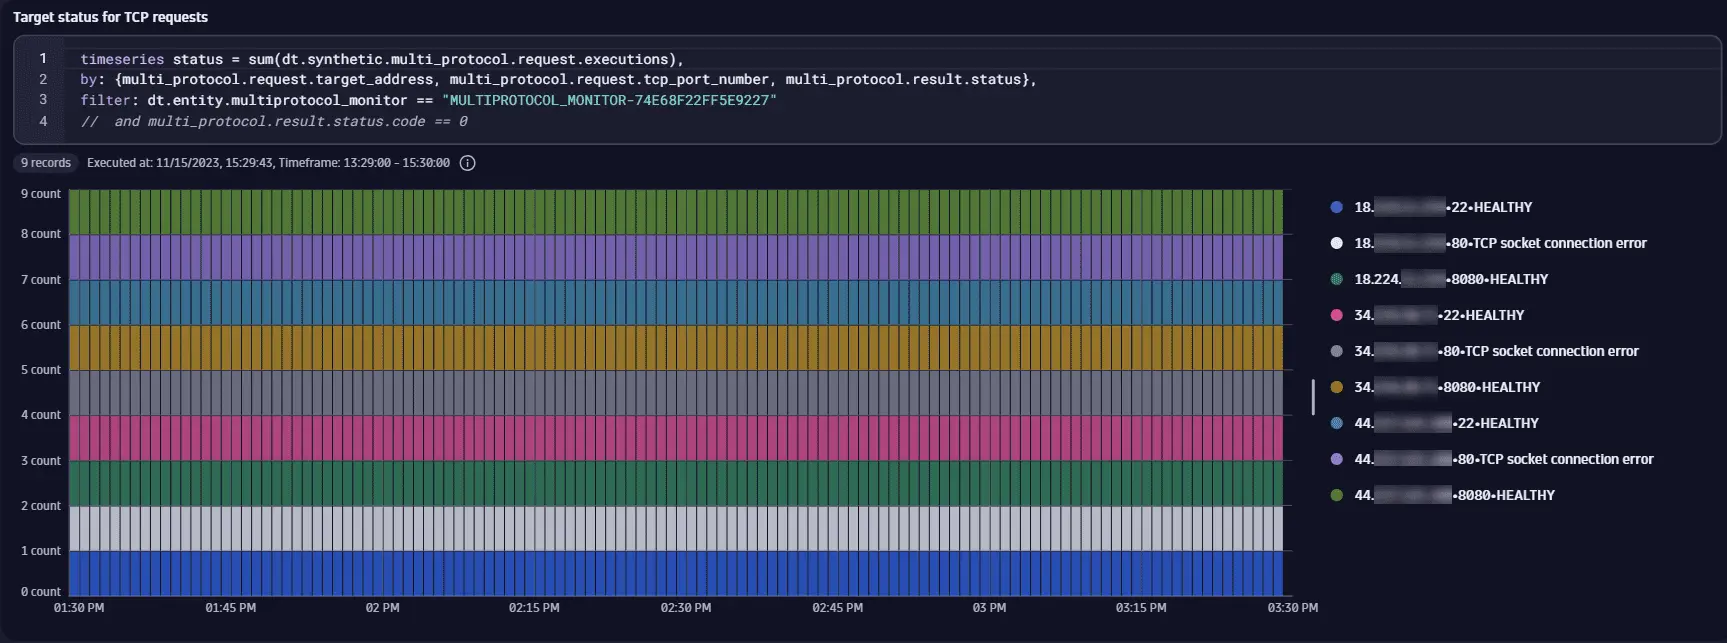
Target status for TCP requests
The monitor MULTIPROTOCOL_MONITOR-74E68F22FF5E9227 executes TCP requests to hosts from a host group that resolves to the IP addresses 18.x.x.x, 34.x.x.x, and 44.x.x.x. By using the dt.synthetic.multi_protocol.request.executions metric and splitting it by the multi_protocol.request.target_address, multi_protocol.request.tcp_port_number, and multi_protocol.result.status dimensions, we can display the status of the TCP connection for an IP-port pair. Each host has the ports 22 (SSH) and 8080 (HTTP server) open, and each connection to the hosts on these ports succeeds with the HEALTHY status. No service uses the standard HTTP port 80. Therefore, connections to all hosts on that port fail with the TCP socket connection error status. Note that results of this query can be limited to just successful requests by filtering by the multi_protocol.result.status.code dimension (code == 0).
timeseries status = sum(dt.synthetic.multi_protocol.request.executions),by: {multi_protocol.request.target_address, multi_protocol.request.tcp_port_number, multi_protocol.result.status},filter: dt.entity.multiprotocol_monitor == "MULTIPROTOCOL_MONITOR-74E68F22FF5E9227"// and multi_protocol.result.status.code == 0
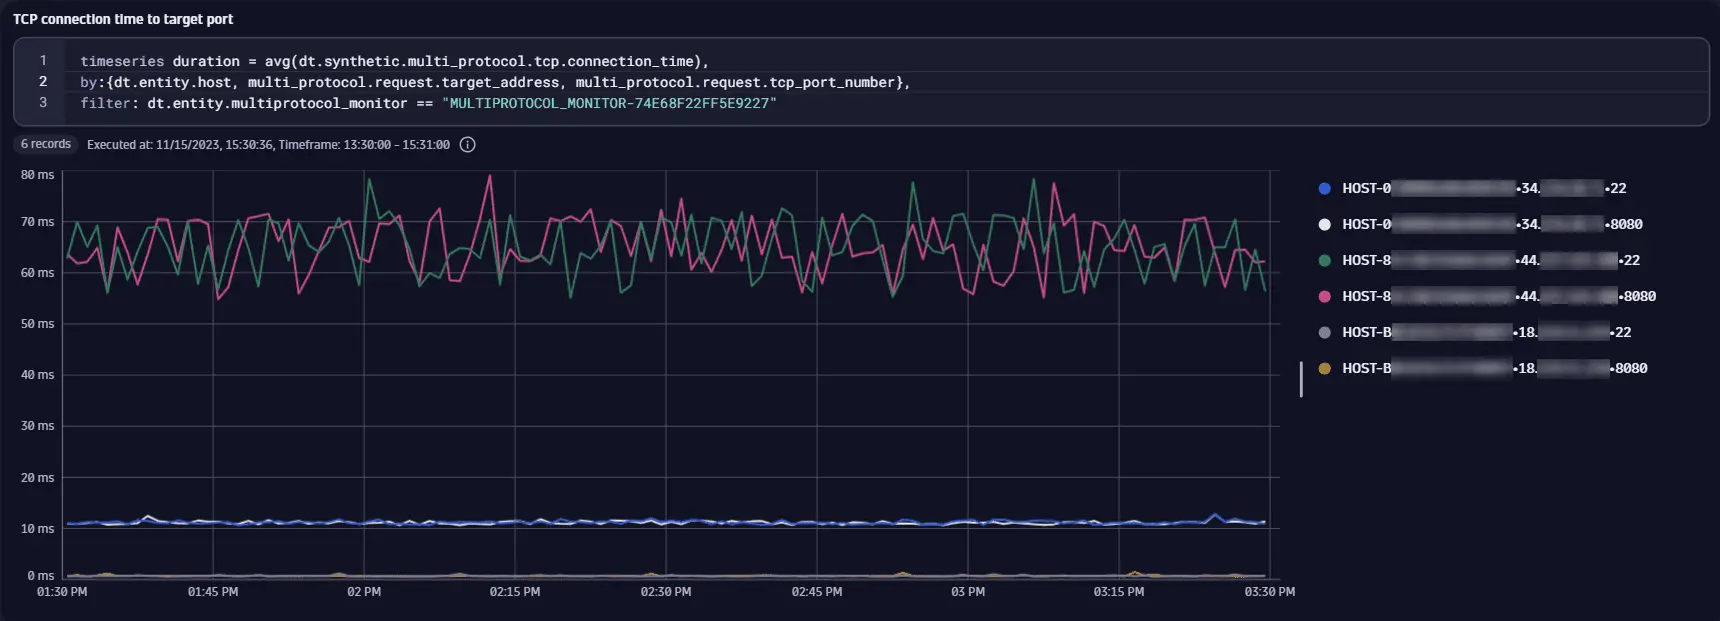
TCP connection time to target port
The monitor MULTIPROTOCOL_MONITOR-74E68F22FF5E9227 executes TCP requests to hosts from a host group that resolves to the IP addresses 18.x.x.x, 34.x.x.x, and 44.x.x.x. In this example, instead of IP addresses, we split the results by monitored host entity IDs. We use average of the dt.synthetic.multi_protocol.tcp.connection_time metric split by the dt.entity.host, multi_protocol.request.target_address, and multi_protocol.request.tcp_port_number dimensions to check typical time taken for a successful connection to the target port for a host. Only ports 22 (SSH) and 8080 (HTTP server) are open, and these are the only ports for which dt.synthetic.multi_protocol.tcp.connection_time is available. The hosts are effectively in different geographical locations (Ohio, Oregon, and North Virginia in the United States), a difference in connection times is expected.
timeseries duration = avg(dt.synthetic.multi_protocol.tcp.connection_time),by:{dt.entity.host, multi_protocol.request.target_address, multi_protocol.request.tcp_port_number},filter: dt.entity.multiprotocol_monitor == "MULTIPROTOCOL_MONITOR-74E68F22FF5E9227"
 Synthetic Classic