Extract a metric from user sessions
- Latest Dynatrace
- Tutorial
OpenPipeline lets you extract custom metrics from user sessions, enabling long-term analyses in  Notebooks and
  Dashboards that go far beyond standard performance monitoring. By combining these metrics with user session properties, you gain the flexibility to uncover insights that are highly tailored to your business objectives.
To illustrate this process, this guide walks you through extracting a customer conversion metric from user sessions, showing the number of sessions that resulted in a customer conversion versus those that did not.
Example scenario
In this tutorial, we’ll use a web shop as our example. The shop is instrumented with the RUM JavaScript, and the captured data is mapped to a frontend named webshop.
Instrumentation was customized to send a user session property successful_checkout whenever a customer successfully completes the checkout process. The property was configured as described in Capture event and session properties for web frontends and then sent via JavaScript API using sendSessionPropertyEvent:
dynatrace.sendSessionPropertyEvent({"session_properties.successful_checkout": true});
With this setup, you can analyze the number of sessions with and without customer conversion by running the following DQL query:
fetch user.sessions| summarize by:{session_properties.successful_checkout}, count()
While this query works well for short-term analysis, it’s not ideal for uncovering long-term patterns, which is much better handled by using a custom metric.
Before you begin
Prior knowledge
Prerequisites
Ensure you have the permissions described in New RUM Experience permissions.
How-to
1. Create a pipeline for metric extraction
-
Go to
 Settings > Process and contextualize > OpenPipeline > User sessions > Pipelines.
 -
To create a new pipeline, select
 Pipeline and enter a name (for example,
 Webshop). -
To configure metric extraction, go to Metric extraction >
Processor > Counter metric and define the processor by entering:- A descriptive Name (for example,
Conversion statistics). - A Matching condition (
true). - A Metric key (
webshop.checkout_statistics). - A metric dimension Under Dimensions
- Select Custom.
- Enter a Field name on record (
session_properties.successful_checkout). - Enter a Dimension name (
successful_checkout). - Enter a Default value (
false).
- A descriptive Name (for example,
-
Select Add dimension.
-
Select Save.
2. Route data to the pipeline
-
Go to
Settings > Process and contextualize > OpenPipeline > User sessions > Dynamic routing. -
To create a new route, select
Dynamic route and specify:-
A descriptive Name (for example,
Webshop route). -
A Matching condition. In our example, the matching condition is:
matchesValue(frontend.name, "webshop") -
The Pipeline containing the processing instructions (
Webshop).
-
-
Select Save.
Conclusion
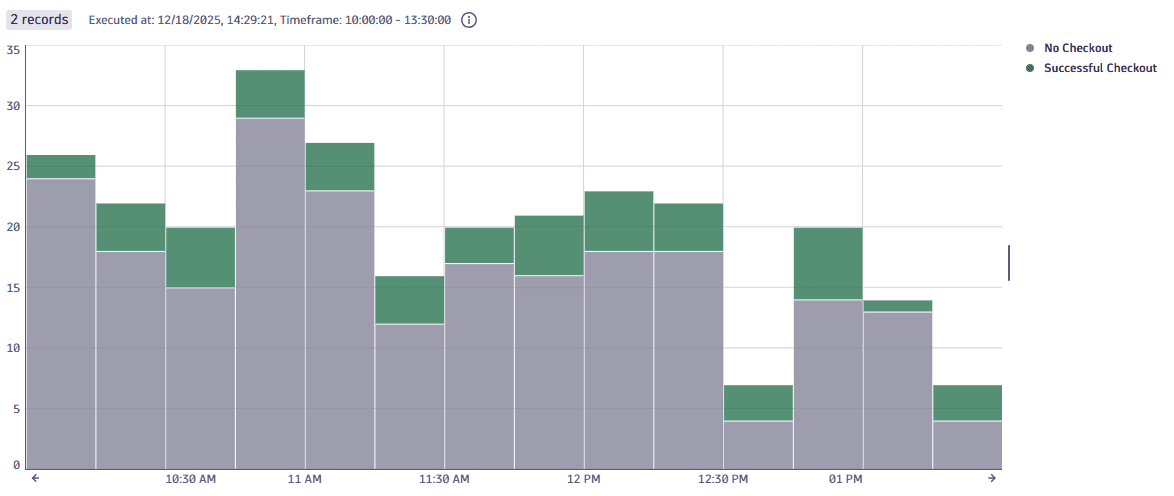
You have successfully extracted a custom metric from user sessions. You can now go to Notebooks and view it, for example using the following query:
timeseries sum(easytravel.checkout_statistics), by: { successful_checkout }, interval: 15m| fieldsAdd checkout_status = if(successful_checkout == "true", "Successful Checkout", else: "No Checkout")
 OpenPipeline