Filter monitoring data via request attributes
- Latest Dynatrace
- 2-min read
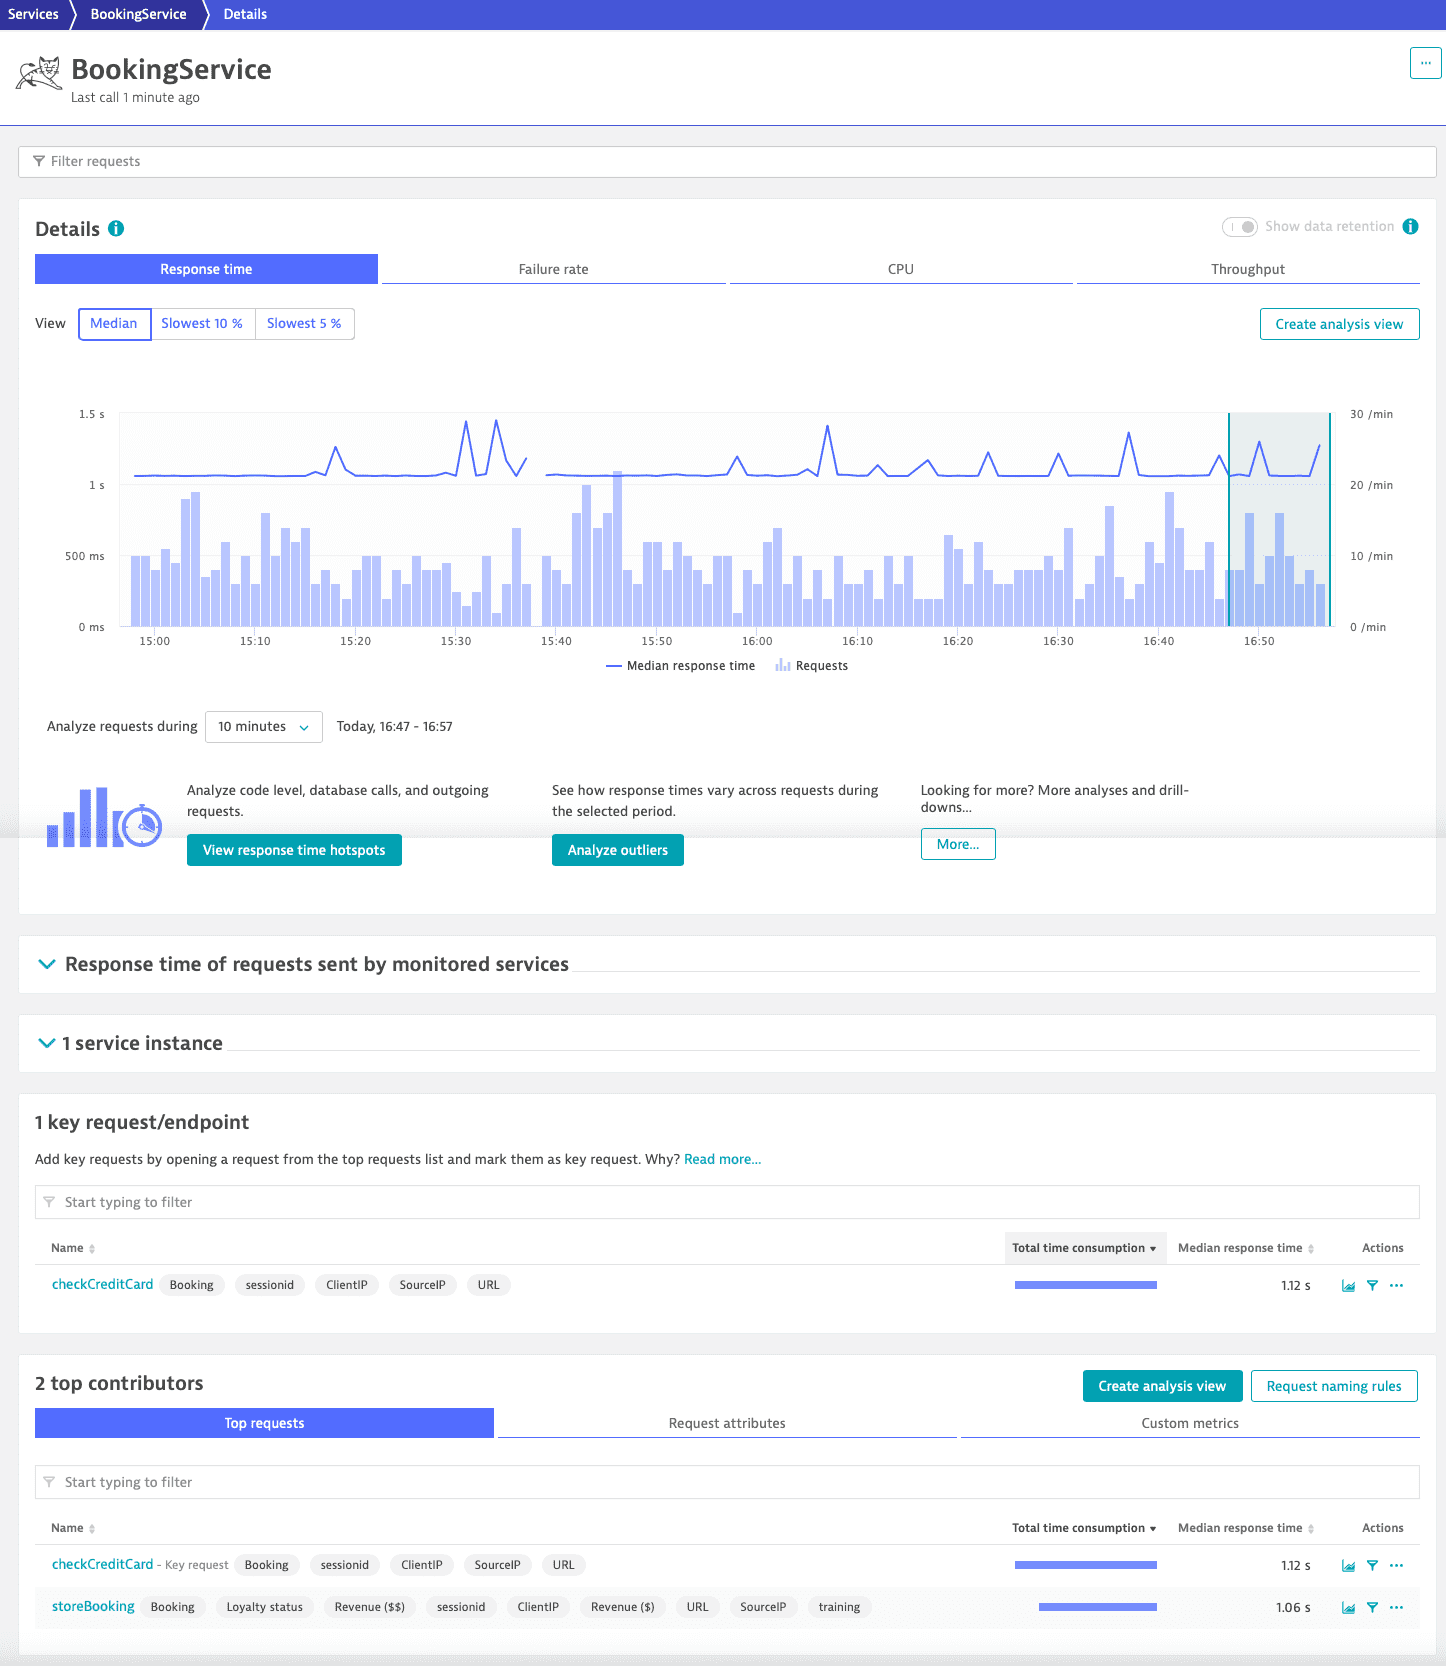
Once you’ve defined your request attributes, they're listed in the related service analysis and indicated as labels for the respective requests.

-
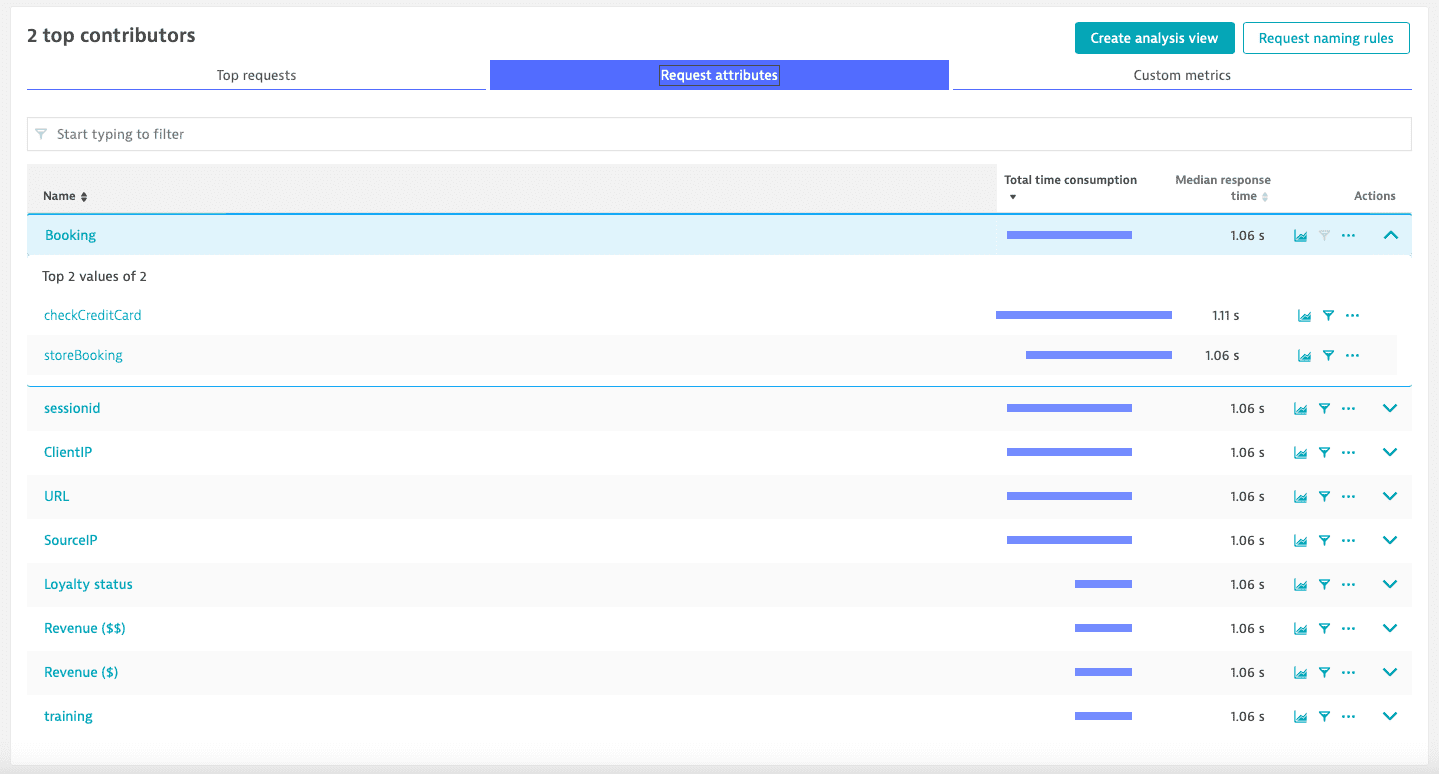
To filter the entire page view down to only those requests that carry a specific attribute, select a request attribute from the Request attribute list.
-
To check the values of a request attribute, expand its row.
By selecting a value, you can filter the page down to requests that carry the specified value for the selected request attribute.
-
The applied request attribute or request attribute value filter persists in further analysis options such as Service flow and Multidimensional analysis.
Example
To filter BookingService requests by request attribute value, we select Request attributes > Booking and choose the value checkCreditCard. The results reflect the current filter settings and show the same metrics as the request table.
 Request attributes' list
- Median response time is the median response time of all requests that contain the request attribute.
- Total time consumption is the sum of response times of all requests in the selected timeframe that have the selected request attribute.
- You can also view the corresponding throughput metrics.
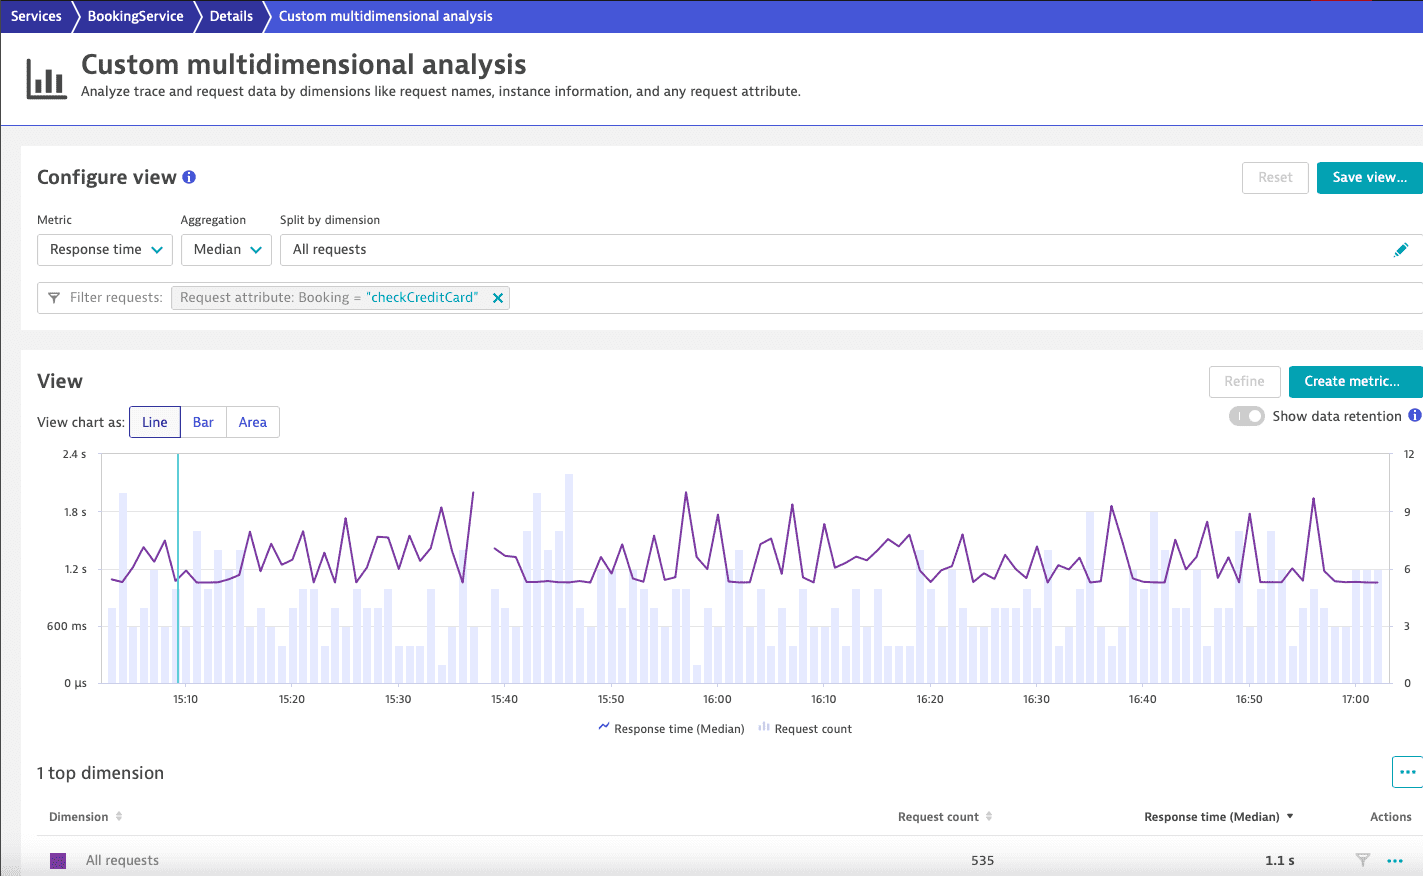
We select Create analysis view to visualize a multidimensional analysis custom view filtered by the selected request attribute value.
 Multidimensional analysis filtered by request attribute value
 -
To filter custom charts by request attribute or request attribute value, create a custom metric based on these conditions.
Without a custom metric, if a request attribute is detected for a service, all data points for the service metric are displayed in the custom charts.