Observability for Developers breakpoints
Preview
Non-breaking Breakpoints
Dynatrace non-breaking breakpoints allow the OneAgent deployed in your application to fetch data from any place in your code, allowing you to observe the current state of your application to quickly find bugs in production, without stopping your application.
Setting Breakpoints
You set the breakpoints within the Live Debugger application by left clicking on the gutter, just like in your own IDE.
Breakpoint Status
Once you set a non-breaking breakpoint, it will have a status associated with it (Active, Pending, Disabled, Error, or Warning). You can view more information about the status by right clicking the breakpoint and selecting Status.
For more information, you can select the Breakpoint status indicator or read more about it on this page.
The following provides a summary of the breakpoint statuses:
Active status occurs when one of or more of your applications has applied the breakpoint and no errors have been reported.
In most cases, once the breakpoint has transitioned to active, you will see snapshots collected the next time the line is executed.
If you fail to see any snapshots arriving, this may be due to any of the following reasons:
-
Incorrect Application
You are not invoking the correct line of code in the correct application instance. -
Long Running Function
You have placed a breakpoint on a long running function. In this runtime, breakpoints are only applied for function calls performed after the Breakpoint was created.
Pending status indicates that the breakpoint has not been applied to any of your applications. This could mean one of the following:
-
No Application instances
The breakpoint could not be applied as no application instance matches the current filter. This could mean one of the following:- The Dynatrace OneAgent has not been installed.
- The Dynatrace OneAgent has been installed, but the application cannot connect to the Dynatrace service.
- The application can connect to the Dynatrace service, but is excluded by the current filter definition.
- The application is currently not running and will be running in the future.
-
Wrong Source File
The source file you used the set the breakpoint is not loaded in any of the applications in the current filter. -
No Code
You have set the breakpoint on a line that has no executable code associated with it. -
(JVM) No Debug Information
You have compiled your classes without debug information. Select here for more information. -
(Node) No Source Maps
You are using a transpiled application without including source maps. Try using a minimal transpilation level, or make sure to add source maps to your deployed application. Check out the source code section for more information. -
(Node) Code is in a Dependency
You are debugging a package deployed as a dependency. This requires setting up your source repository accordingly. -
(Node) Different File Layout
File paths are changed between source repository and deployment. This requires setting up your source repository accordingly.
Disabled status occurs when the breakpoint was disabled due to limits. These include limits applied by the user for that specific breakpoint (e.g. time limit / hit limit).
To see more information on the reason why the breakpoint was disabled, right click on the breakpoint and select Status.
You can re-enable the breakpoint (by resetting the limit counter) through right clicking on the breakpoint and selecting Enable.
Error status occurs when one of or more of your applications has reported an error in processing, applying or executing the breakpoint.
Error messages are clearly documented within the Live Debugger application or IDE, but here are some examples:
- Source file has changed
Dynatrace verifies that the source file you see in our IDE is the file you are deploying in your application. If the file version is wrong, the breakpoint will not be set. If you use source commit detection you will see the correct git commit to use on the App instances page. - Breakpoint collection took too long
Dynatrace employs a safeguard in case a single breakpoint takes too long to collect data from your application. - (Node) Running with a Debugger
You are using the Live Debugger side-by-side with another debugger such as the WebStorm Debugger.
Warning indicates some problems have occurred with the breakpoint, and Dynatrace is trying its best to deliver the data you've requested.
Warning messages are clearly documented within the Live Debugger application or IDE, but here are some examples:
-
Breakpoint collection is sampled due to rate-limiting
Dynatrace employs a built-in rate-limiting mechanism to prevent breakpoints set in hot code paths from impacting application performance. This error indicates the rate limit has been hit and the breakpoint has been rate-limited for the offending application instance. Collection is sampled in order to prevent performance impact on your application. -
(JVM) Source file not found
Dynatrace relies on source file hashing to ensure you are debugging the correct version of the files you are trying to debug. In most JVM based languages, include your source within your Jar/War/Ear archives.
Data Collection
The next time the code you set the breakpoint on is invoked, Dynatrace will collect parts of the application state and send it to the Live Debugger application or the IDE.
Collection Levels
There are several collection levels that you can set to a breakpoint. The collection levels set 3 different values:
- How deep to go in the collection – collection depth
- How much characters to collect from a string – string width
- How much elements to collect from vectors, arrays, lists, etc. - collection width
There are 3 collection levels available:
Level\Language
JVM
Node.js
Low
Collection depth – 2 String width – 128 Collection width - 10
Collection depth – 2 String width – 128 Collection width – 5
Medium
Collection depth – 5 String width – 512 Collection width - 15
Collection depth – 3 String width – 512 Collection width – 10
High
Collection depth – 8 String width – 4096 Collection width - 25
Collection depth – 5 String width – 4096 Collection width – 20
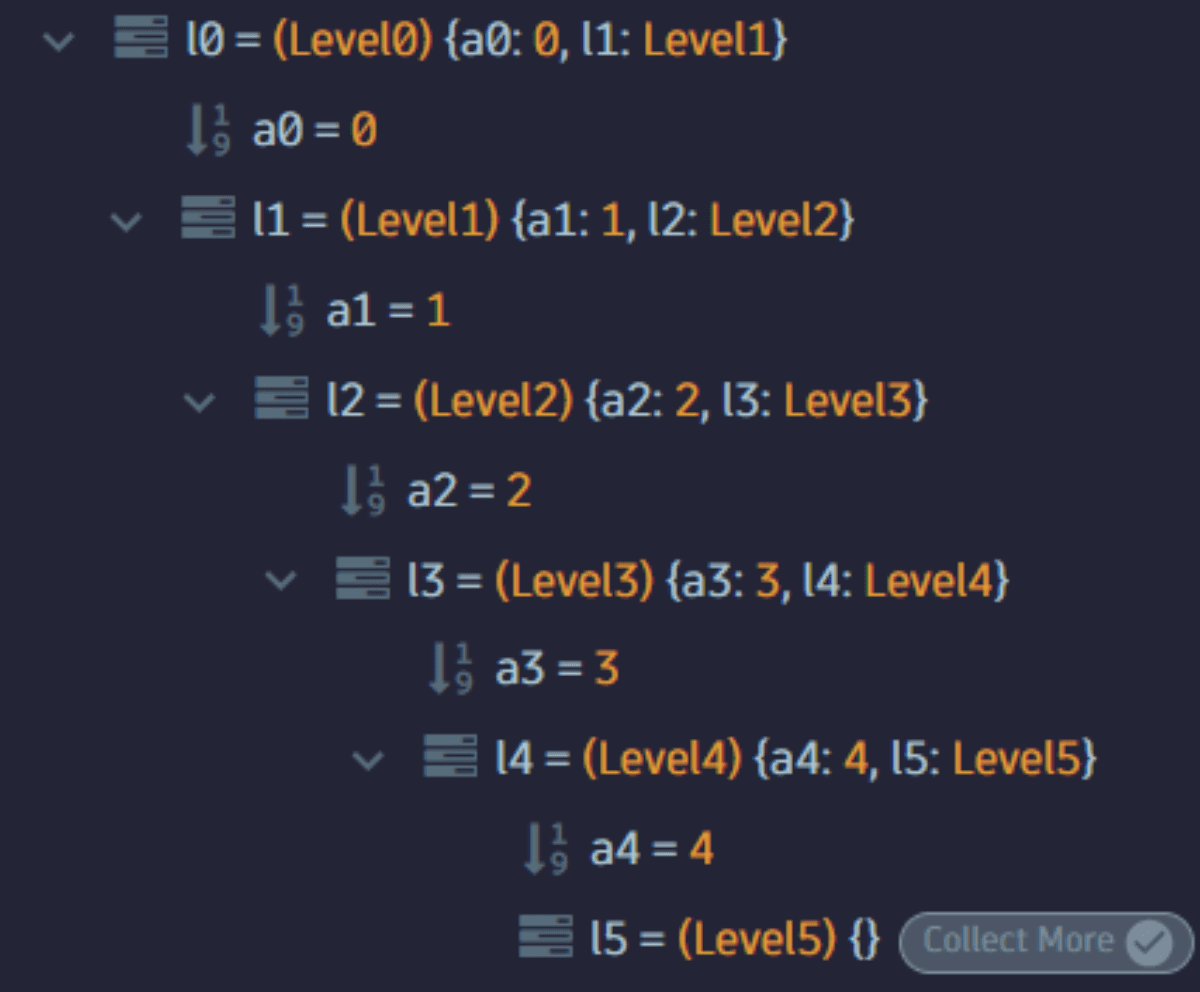
For example, if we have an object with a deeply nested field, we will stop when we reach the maximum collection depth (like in the example below). Note that l5 has more fields, but they weren’t collected because they were too deep.
Breakpoint Limits
You can set limits on individual breakpoints to limit the amount of data that will be collected. When limits are reached, the breakpoint will be automatically disabled. Once disabled, it will not collect additional data. You can re-enable the breakpoint by right-clicking on it and selecting Enable.
The limits can be set based on:
- Time (for example, 1 Hour, 24 hours, a week)
- Hit count (the number of times the breakpoint gets triggered)
Breakpoint default limit values:
- Breakpoint time limit is - 7 days
- Breakpoint hit limit is - 100
- Collection level - Medium
Breakpoint Conditions
Conditional breakpoints allow you to limit the data collected by the agent. You will only collect data when the defined expression evaluates as true. This makes it possible to debug specific scenarios and limit the number of messages you receive. Setting a condition is done by right-clicking on a breakpoint and selecting the Edit option.
Condition types:
- Simple Conditions
Using a simple condition, we can compare a variable with some value (or another variable). - Advanced Conditions
Using an advanced condition, we can define a more complex condition using logical parameters. Use&&for AND statement,||for OR statement,(and)for encapsulation.
Advanced conditions support the following operators and functions:
Operator
Example
Description
==
a==1, b=='bbb', x==y
If the values of two operands are equal, then the condition becomes true.
!=
a!=1, b!='bbb', x!=y
If values of two operands are not equal, then condition becomes true.
>
a>1, x>y
If the value of left operand is greater than the value of right operand, then condition becomes true.
>=
a>=1, x>=y
If the value of left operand is greater than or equal to the value of right operand, then condition becomes true.
<
a<1, x<y
If the value of left operand is less than the value of right operand, then condition becomes true.
<=
a<=1, x<=y
If the value of left operand is less than or equal to the value of right operand, then condition becomes true.
in
'bbb' in a
If the value of the left operand is included in the right operand, then the condition becomes true.
&&
a<=1 && b!='bbb'
If both the operands are true then condition becomes true.
||
a<=1 || b=='bbb'
If any of the two operands are non-zero then condition becomes true.
()
(a<=1``||``b=='bbb') && (x<y)
Parentheses could be used for changing the precedence when evaluating the conditio
[]
arr[4]!=4, dict['a']!=4
Set conditions regarding to a specific sequence’s element - list, dict etc.
size
arr.size() >= 32
Use size instead of len or length on any platform