Get started with Distributed Traces
- How-to guide
- 6-min read
Distributed Traces Classic provides you with a combination of analysis tools to gain insight into your environment's transactions. It combines code-level visibility, topology information, and metadata with the highest level of data granularity and fidelity. In this article, you'll explore the Distributed Traces Classic functionalities and how to leverage them to analyze requests in your environment.
Quick start
To get started with a distributed trace analysis
- Go to Distributed Tracing (previous Dynatrace) or
 Distributed Traces Classic.
 - Optional Use the Overview chart to understand the request count and response time over the selected timeframe.
Data retention
The chart uses trace and request data, which has different data retention periods. For timeframes containing data older than 10 days, you can turn on the Show data retention toggle to better understand which data is available for which period directly from the chart.
- Optional In the table, expand the details of the trace you want to analyze for an overview of its topology, attributes, HTTP information, and timings.
- Select the distributed trace name for in-depth trace analytics.
- Select a time segment to expand the detail tabs.
Get an overview
To configure a view of the distributed traces in your environment
-
Go to Distributed Tracing (previous Dynatrace) or
Distributed Traces Classic.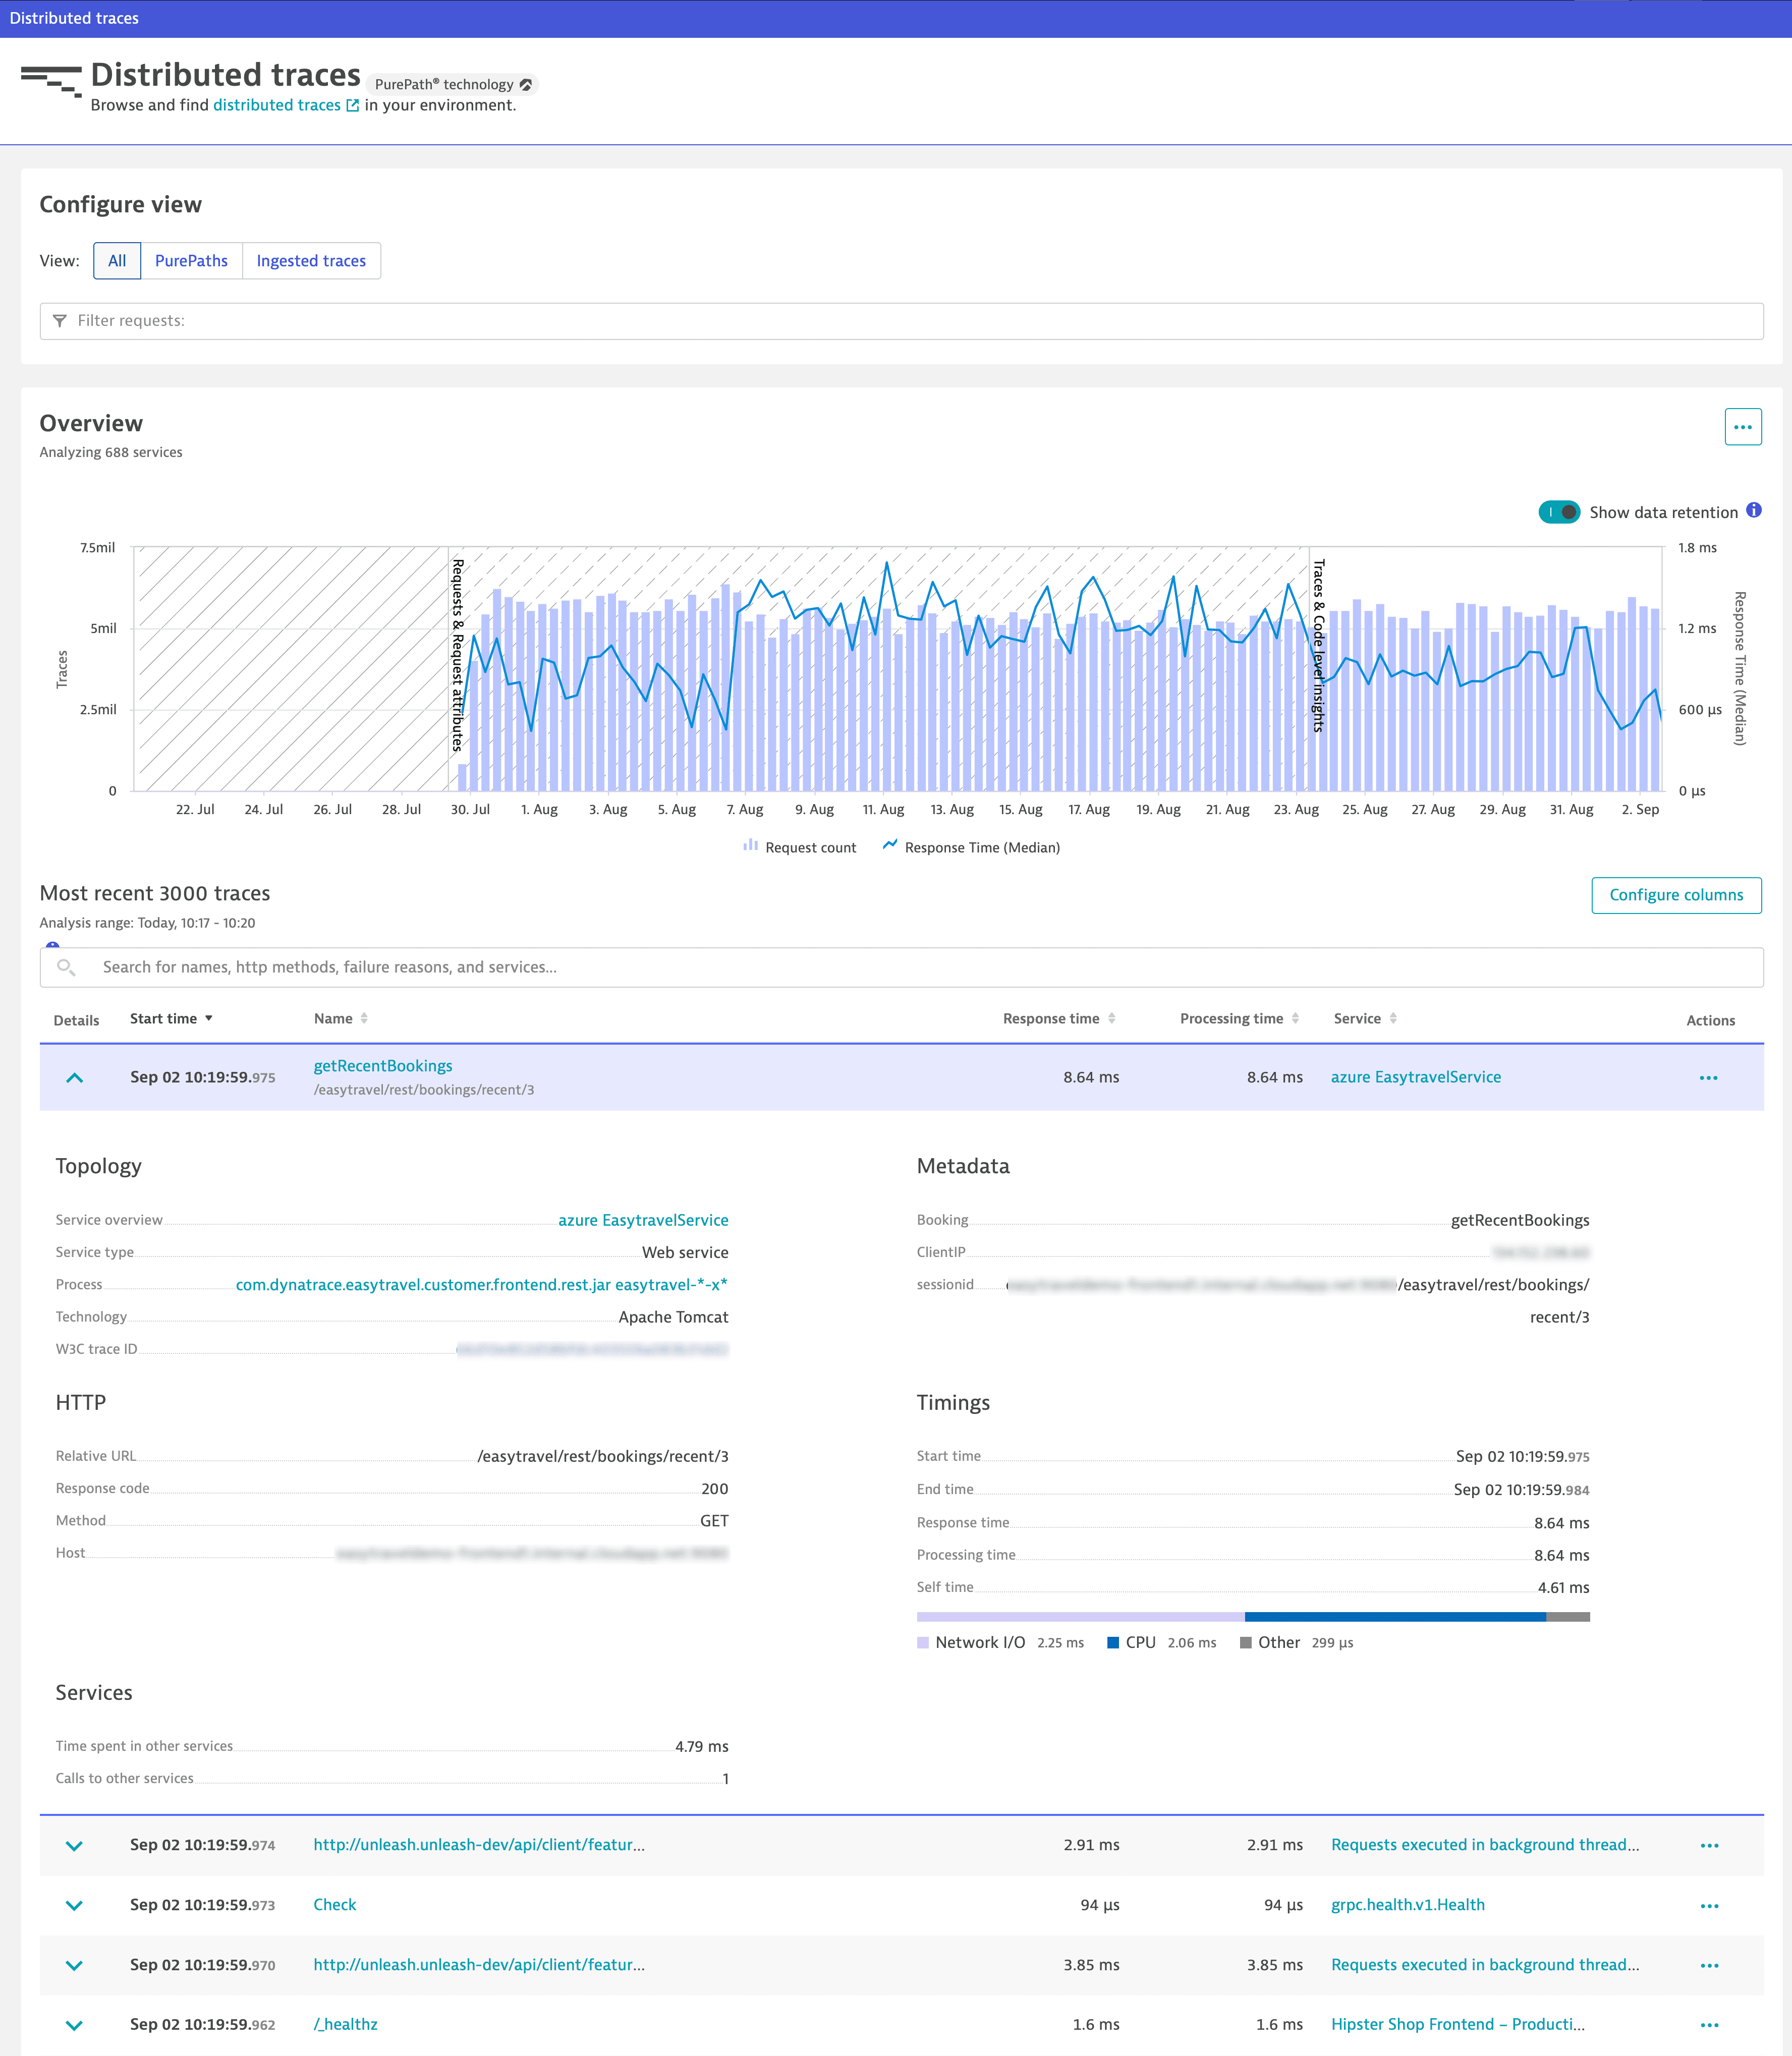
-
Configure a view by setting filters. To filter the distributed traces by
-
Ingestion method
- Select PurePaths to view PurePath® distributed traces captured by OneAgent.
- Select Ingested traces to view distributed traces instrumented with other libraries.
-
Service
Go to Filter requests > Service name and enter the service name. Note that you can access this view also by going to Services (previous Dynatrace) or
 Services Classic > More (…) > Distributed traces for the service.
-
Export overview data
You can export the distributed traces overview table data in a comma-separated values (CSV) file.
-
Go to Distributed Tracing (previous Dynatrace) or
Distributed Traces Classic. -
Optional Narrow down the table results by reconfiguring your view or via the search input field above the table.
The table lists up to the 3,000 most recent traces that are captured during the selected timeframe and within the selected management zone. Depending on the timeframe and the configured view, the list highlights the most important node for the trace.
Find a node
To find a specific node of a trace
- Go to Distributed Tracing (previous Dynatrace) or Distributed Traces Classic.
- Filter the table by the trace ID.
- Select the trace name.
- In the Trace view, find the desired node.
- Go to Distributed Tracing (previous Dynatrace) or
-
In the lower-right corner of the page, select the Show export menu.

-
Select one of the following options.
Option
Exported data
Fields
Number of entries
Export visible data
The currently displayed area of the table, taking into account applied filters
Only visible fields
Up to 50 traces
Export table data
All table data, including traces that are not displayed on the current table page
All the available fields related to distributed traces
All 3,000 most recent traces
Analyze a single trace
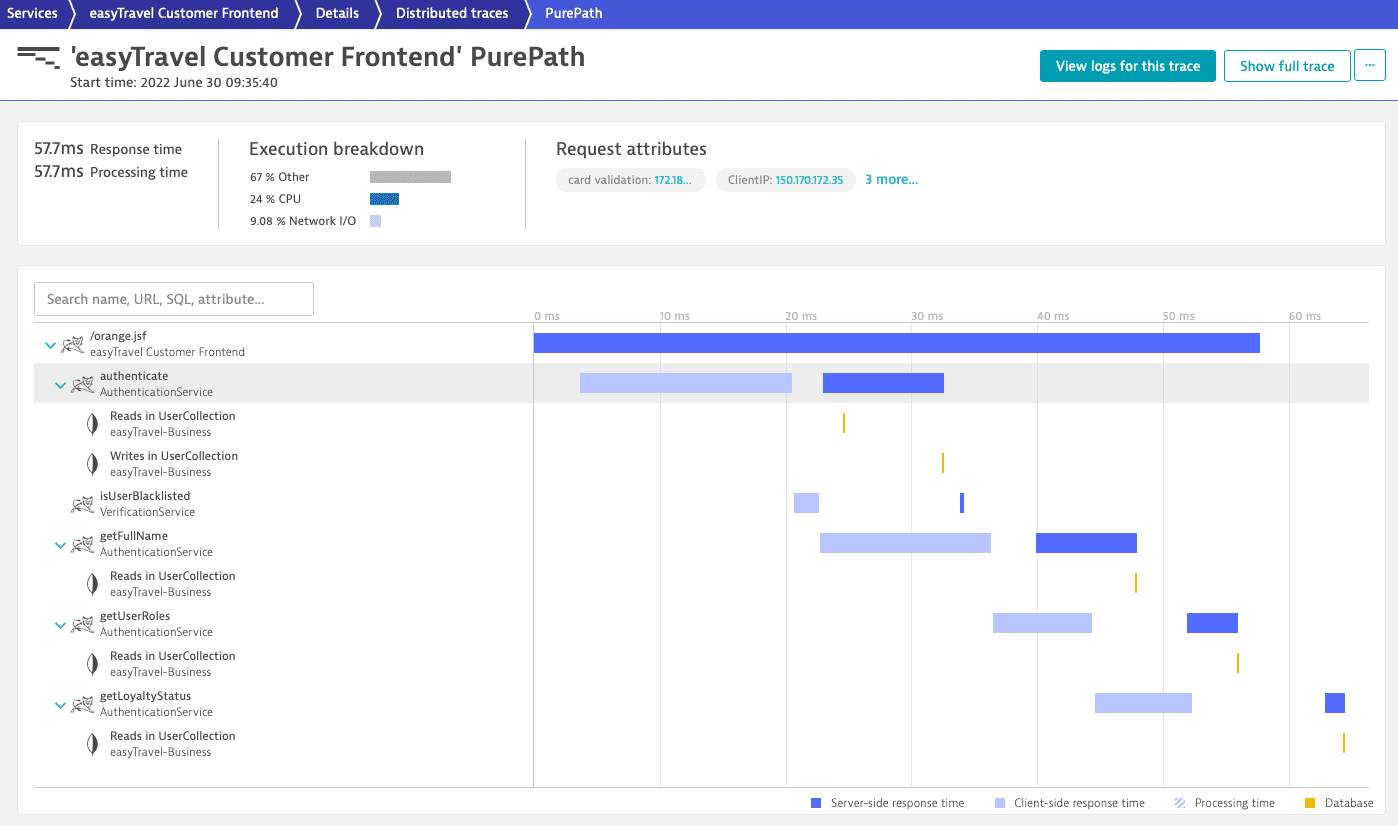
The distributed trace analysis view provides an end-to-end waterfall visualization of the requests in a single trace.
To access the single trace view
-
Go to Distributed Tracing (previous Dynatrace) or
Distributed Traces Classic. -
From the table, select the distributed trace name.
-
Optional Go to the Execution breakdown to learn the trace time distribution.
-
Go to the waterfall chart to learn which services are traversed by the trace and in which order.
-
Select a request to visualize subsequent interactions.
Use the colors and positions of the horizontal bars in the chart to see which requests were executed synchronously (in parallel). They indicate both the sequence and response time of each of the requests.
-
Select a time segment to access in-depth trace analytics in detail tabs, down to code-level information.
-
Choose a detail tab to continue your analysis.
Summary
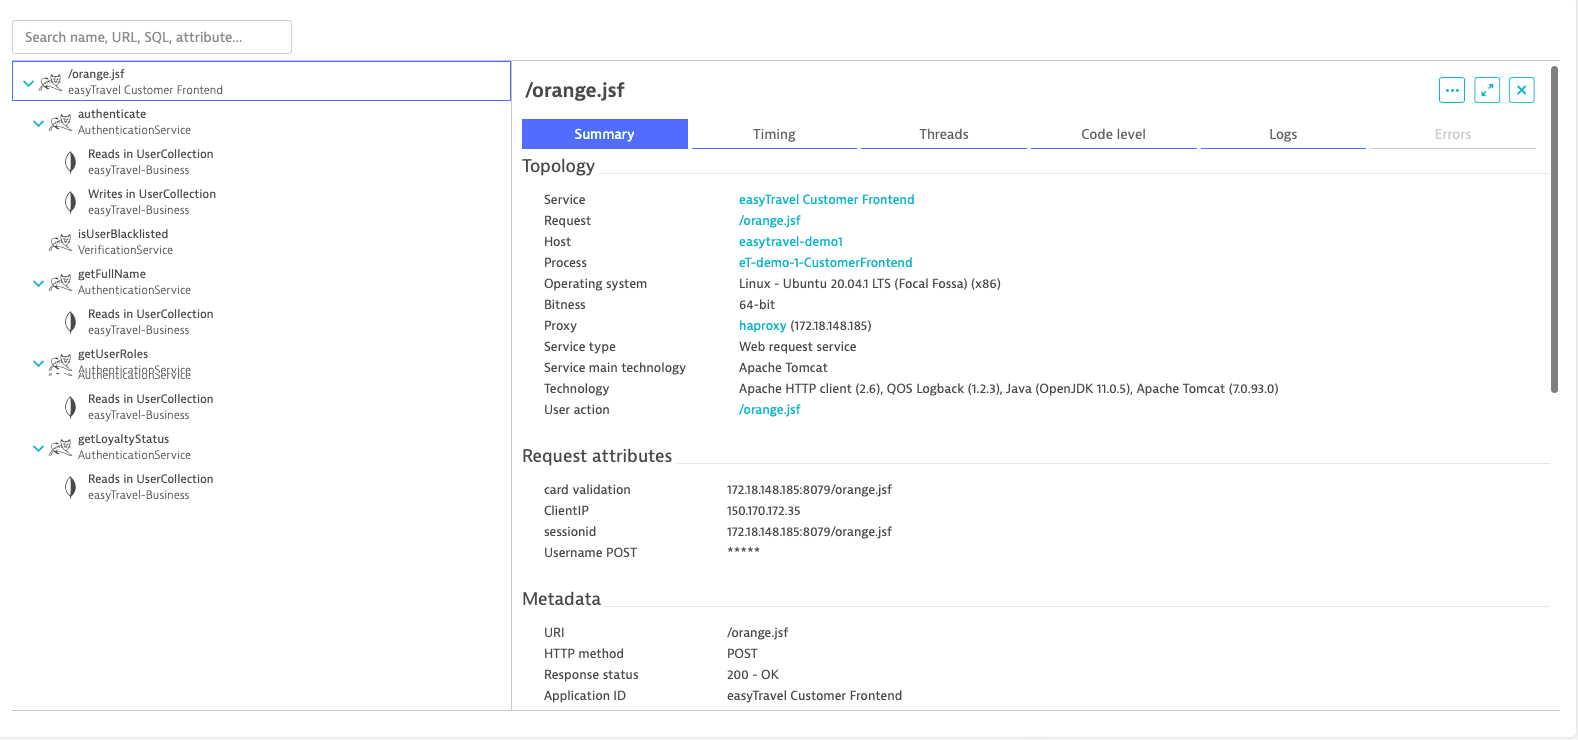
Availability
default
Content
Includes details on metadata, request headers, request parameters, and information about the proxy through which the request was sent.
Values obscured with five asterisks (
*****) imply hidden confidential data, which can be unmasked by users with sufficient permissions. Three or fewer asterisks (***) are used for data aggregation purposes and can't be unmasked.Timings
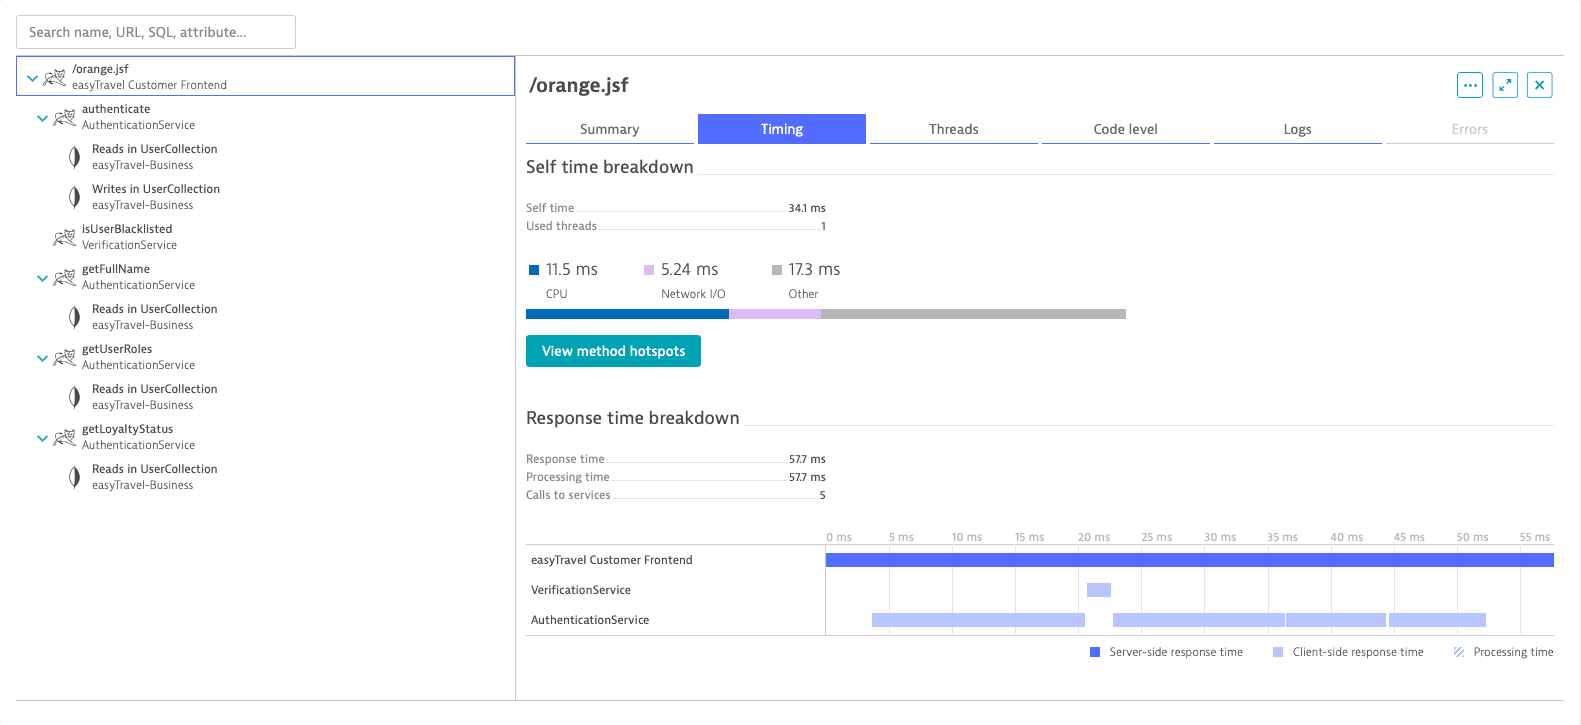
Availability
default
Content
Timing-specific details of services. Select View method hotspots for more details on timing contributions (for example, CPU, wait, sync, lock, and execution time).
Example
The example above shows timing details for the
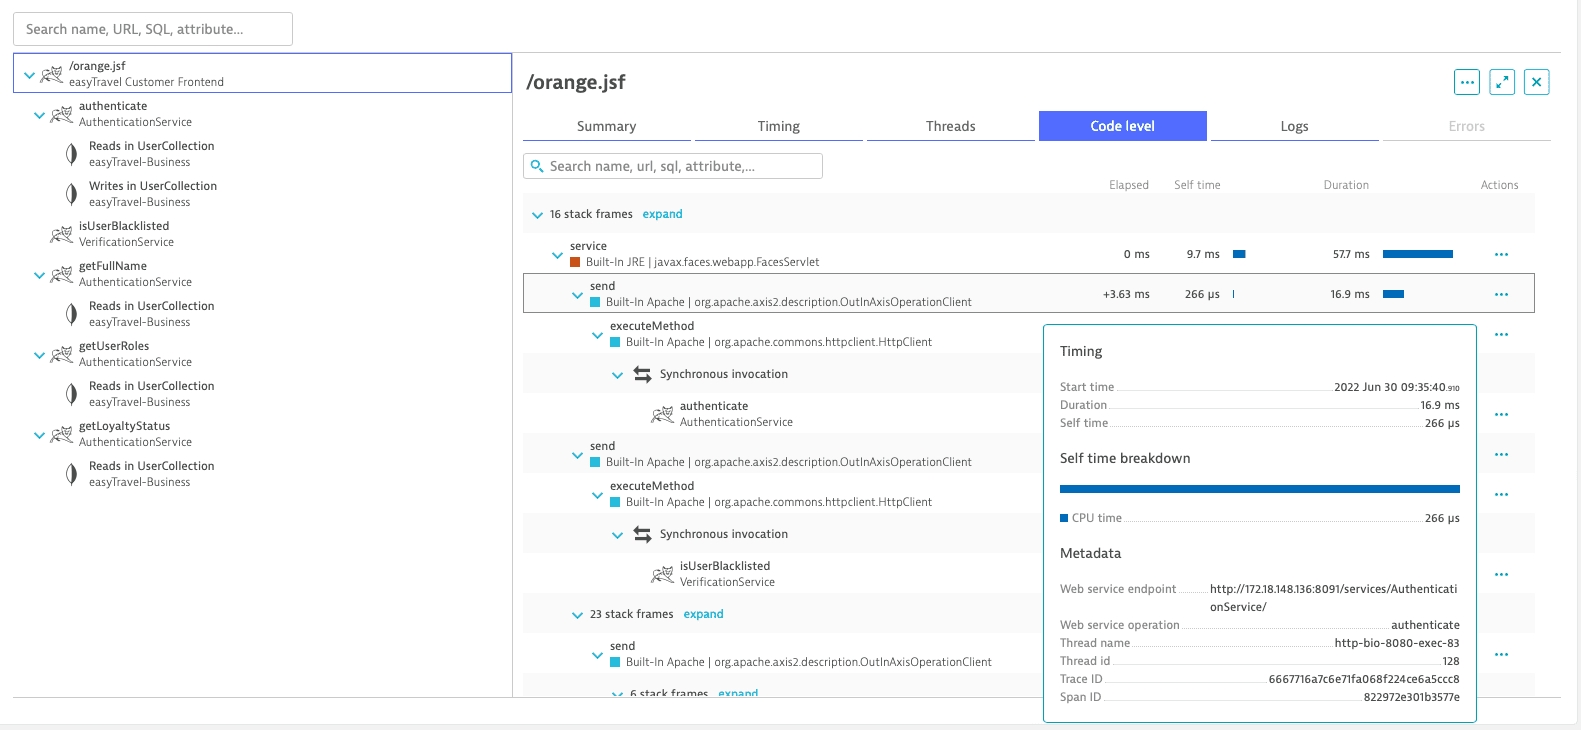
/orange.jsfweb service call. In this case, you see that the request lasts 57.7ms.Code level
Availability
OneAgent required depends on data input 1
Content
Comprehensive code execution of each and every request, including the code-level method executions and their timings, in the exact sequence of events.
Example
In the example above, Dynatrace tells you exactly which method in the
/orange.jsfrequest on theeasyTravel Customer Frontendservice called the respective web services and which specific web-service methods were called. The timings displayed here are the timings as experienced by theeasyTravel Customer Frontend, which, in the case of calls to services on remote tiers, represent the client time.1The volume of code-level information varies depending on importance, timing, and estimated overhead. Typically, slower parts of a request contain more details.
Logs
Availability
Log enrichment required depends on data input1
Content
Log records in the full context of the transaction. All available span IDs are included by default.
- To filter by logs relevant to the selected waterfall node, turn on Strict span filter.
- To see all the logs for a trace, select View logs for this trace.
1To get started, see Log enrichment.
Errors
Availability
depends on data input
Content
Occurring exceptions for failed requests.
Threads
Availability
OneAgent required depends on service type
Integrations
Availability
depends on service type
Frequently asked questions
[declared unavailable by agent] is a placeholder value displayed in the trace view when metadata is not available for OneAgent to capture, due for example to a lack of data visibility or constraints in reporting it, for example, the technology is not supported by OneAgent. We recommend contacting a Dynatrace product specialist via live chat within your Dynatrace environment to understand your case.
Related topics
 Distributed Traces Classic