Problem alerting profiles
- Dynatrace Classic
- 4-min read
To set up alerting and notifications, we recommend using simple workflows. For a conceptual overview, see alerting and notifications.
Problem alerting profiles control the delivery of problem notifications across your organization's alerting channels based on consideration of predefined filters that are based on problem severity, problem duration, custom events, and tags. Problem alerting profiles allow you to control exactly which conditions result in problem notifications and which don't. This includes all problem-push notifications that are sent via the Dynatrace mobile app and displayed in the Dynatrace web UI. Problem alerting profiles can also be used to set up filtered problem-notification integrations with third-party messaging systems like Slack, Opsgenie, and PagerDuty.
Each of your monitoring environments has a default alerting profile that defines the severity level that must be met before an alert is sent out for a detected problem.
Your environment administrator can create new problem alerting profiles that provide fine-grained control over the routing of problem alerts for individual teams or for third-party problem notification integrations, such as Slack, HipChat, and others.
To view your environment's problem alerting profiles, go to Settings > Alerting > Problem alerting profiles. The Default profile is always presented in the list. You can modify it but not delete it.
Alerting profile scope
Alerting profiles provide a powerful filtering mechanism for problem notifications. By combining filter criteria, you can create custom profiles that, for example, delay notification of problems in development environments while immediately alerting on problems detected in production environments. The scope of an alerting profile is defined by
- The management zone.
- Severity rules.
- Event filters.
These conditions are combined by the AND logic. An event must fulfill all conditions to trigger a notification based on the profile.
Tag matching in alerting profiles is exact. If you provide only a key, the tag will match entities with a given key that has no value. For example, if you specify the key Apps without providing any value, it will match an entity with the key Apps and an empty value. However, it will not match the entity AppsRedis that has the same key, but has a non-empty value.
To match key-value tags, you need to provide both the key and the value.
Management zone
The management zone filter reduces the amount of data the alerting profile evaluates. Instead of checking all the data your environment generates, you can focus on just the parts coming from the specified management zone.
By default a new alerting profile uses All management zones, which means that no filter is applied. In most cases you should apply the management zone filter to reduce the profile scope to the scope of your teams' responsibility. Keep in mind that management zones can overlap. If a problem is detected on a service that is defined within multiple management zones, multiple filters will be applied.
Severity rules
Severity rules filter events based on their severity level. For each alerting profile, you can specify up to 100 severity rules. These rules are combined by the OR logic. An event fulfilling any of the rules triggers a notification based on the profile.
You can use the following criteria:
- Severity level.
- How long the problem is open before an alert is sent out—this enables you to avoid alerts for low-severity problems that don't affect customer experience and therefore don't require immediate attention.
- Optional Monitoring entities that have any or all of the specified tags
Rule criteria are combined by the AND logic. All of them must be fulfilled for the rule to be invoked.
Event filters
Event rules filter events based on their properties. For each alerting profile, you can specify up to 20 event rules. Particularly for auto-remediation use cases, it’s helpful to trigger specific actions based on detailed information that’s captured during abnormal situations, for example, triggering alerts in cases where problems are related to process crashes.
You can use the following criteria:
- Predefined events Event type
- Custom events Title, description, and properties of the event
Each of criteria can be inverted by using the negate option. For example, it turns the begins with criterion into does not begin with.
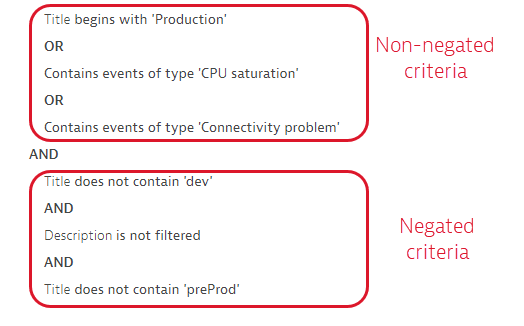
The rules are combined by the following logic:
- All rules that contain negated criteria are grouped by the AND logic.
- All other rules are grouped by the OR logic.
- These two groups (negated and non-negated) are grouped by the AND logic.
Create an alerting profile
To create an alerting profile
- Go to Settings > Alerting > Problem alerting profiles and select Add alerting profile.
- Type a name for the new profile in the Create new alerting profile field and select Create.
- Define the management zone filter.
- Define the severity-level rules for the profile.
- Define the event filter. You can base it one one of the following:
Predefined: a specific built-in event typeCustom: a title, description, and properties of an event
- Review the summary of criteria for your new alerting profile and adapt them if needed.
- Select Done in the upper-right corner to save the new alerting profile.
Alerting profiles API
In addition to the Dynatrace web UI, you can manage your problem alerting profiles via the Settings API. Look for the Problem alerting profiles (builtin:alerting.profile) schema.