Automated bug triaging and ticketing
- Latest Dynatrace
- Tutorial
- 9-min read
- Published Apr 24, 2023
In today's continuous delivery approach, even with extensive QA processes, some errors are only discovered through real-life infrastructure usage as close to production as possible. Dynatrace allows R&D teams to easily react to bugs or problems by integrating a Jira ticket creation workflow to resolve team dependencies.
Introduction
This guide presents a straightforward method for utilizing Dynatrace to clarify ambiguous responsibilities and interdependencies. In this use case, you create an internal tool that takes care of identifying bugs from logs, as well as grouping, triaging, and distributing them to a bug tracker that clarifies ambiguous responsibilities and interdependencies. Such an internal tool will allow you to:
- Detect bugs as early as possible before becoming visible to customers.
- Review and prioritize newly discovered problems and ensure ownership of each item is clearly defined.
- Increase the quality of released product.
Target audience
This article is intended for development team leaders, development teams and anyone who is responsible to triaging and assigning bugs to development teams.
Scenario
Your company operates considerable infrastructure. You use Dynatrace to monitor both the production and pre-production segments of this infrastructure. Dynatrace monitors thousands of hosts and ingests multiple TB of logs per day.
These logs contain valuable information about errors that occurred on the systems that might need to be addressed by the various development teams.
With many teams, distributed systems, interconnected components, and large volumes of log data, it is challenging to clarify responsibilities and interdependencies.
Teams meet for a daily bug meeting and review newly discovered problems to ensure that the ownership of each item is clearly defined.
- Teams want to quickly discover and assess new errors.
- Each development team wants to know how their code behaved in the production and pre-production stages and prioritize, investigate and fix any issues.
The volume makes it impossible to analyze manually, and the large number of teams adds the complexity of bringing the right log lines to the right teams.
Prerequisites
Make sure all of these are true before you start:
Access and permissions
- You should have the necessary permissions to configure and access monitoring tools within Dynatrace.
- You should have permissions to ingest log data into Dynatrace.
- Make sure the following permissions are enabled.
- Grail:
storage:logs:read. For instructions, see Assign permissions in Grail. - Workflows: Permissions to access, view, write, and execute workflows. For details, see Authorization.
You should set permissions required by Workflows to run actions on your behalf. Grant permissions to Workflows (allows the workflow to convert resulting findings into Jira tickets).
To access permissions, go to the Settings menu in the upper-right corner of the Workflows app and select Authorization settings.
- Grail:
- You can integrate Dynatrace with various bug tracking tools and frameworks used in your pipeline.
Knowledge
- You understand how Dynatrace works.
- You know how to set up Dynatrace Dashboards and alerting systems.
- You know how to ingest log data into Dynatrace (Log ingestion via OneAgent), particularly using the Dynatrace API (Log ingestion API) or similar data ingestion methods.
- You have basic understanding of Dynatrace Query Language and how to use DQL queries.
- You know how to set up automated workflows in Dynatrace for automating ticket creation in Jira.
- You have knowledge of how to create Dynatrace application that interacts with the Dynatrace platform via APIs.
Backend service
- You have a backend service that:
- can group log data
- can process log data based on their message content
- can store grouped log data
- can serve grouped log data through API
- is located in your infrastructure and is reachable through EdgeConnect by any Dynatrace application in your tenants
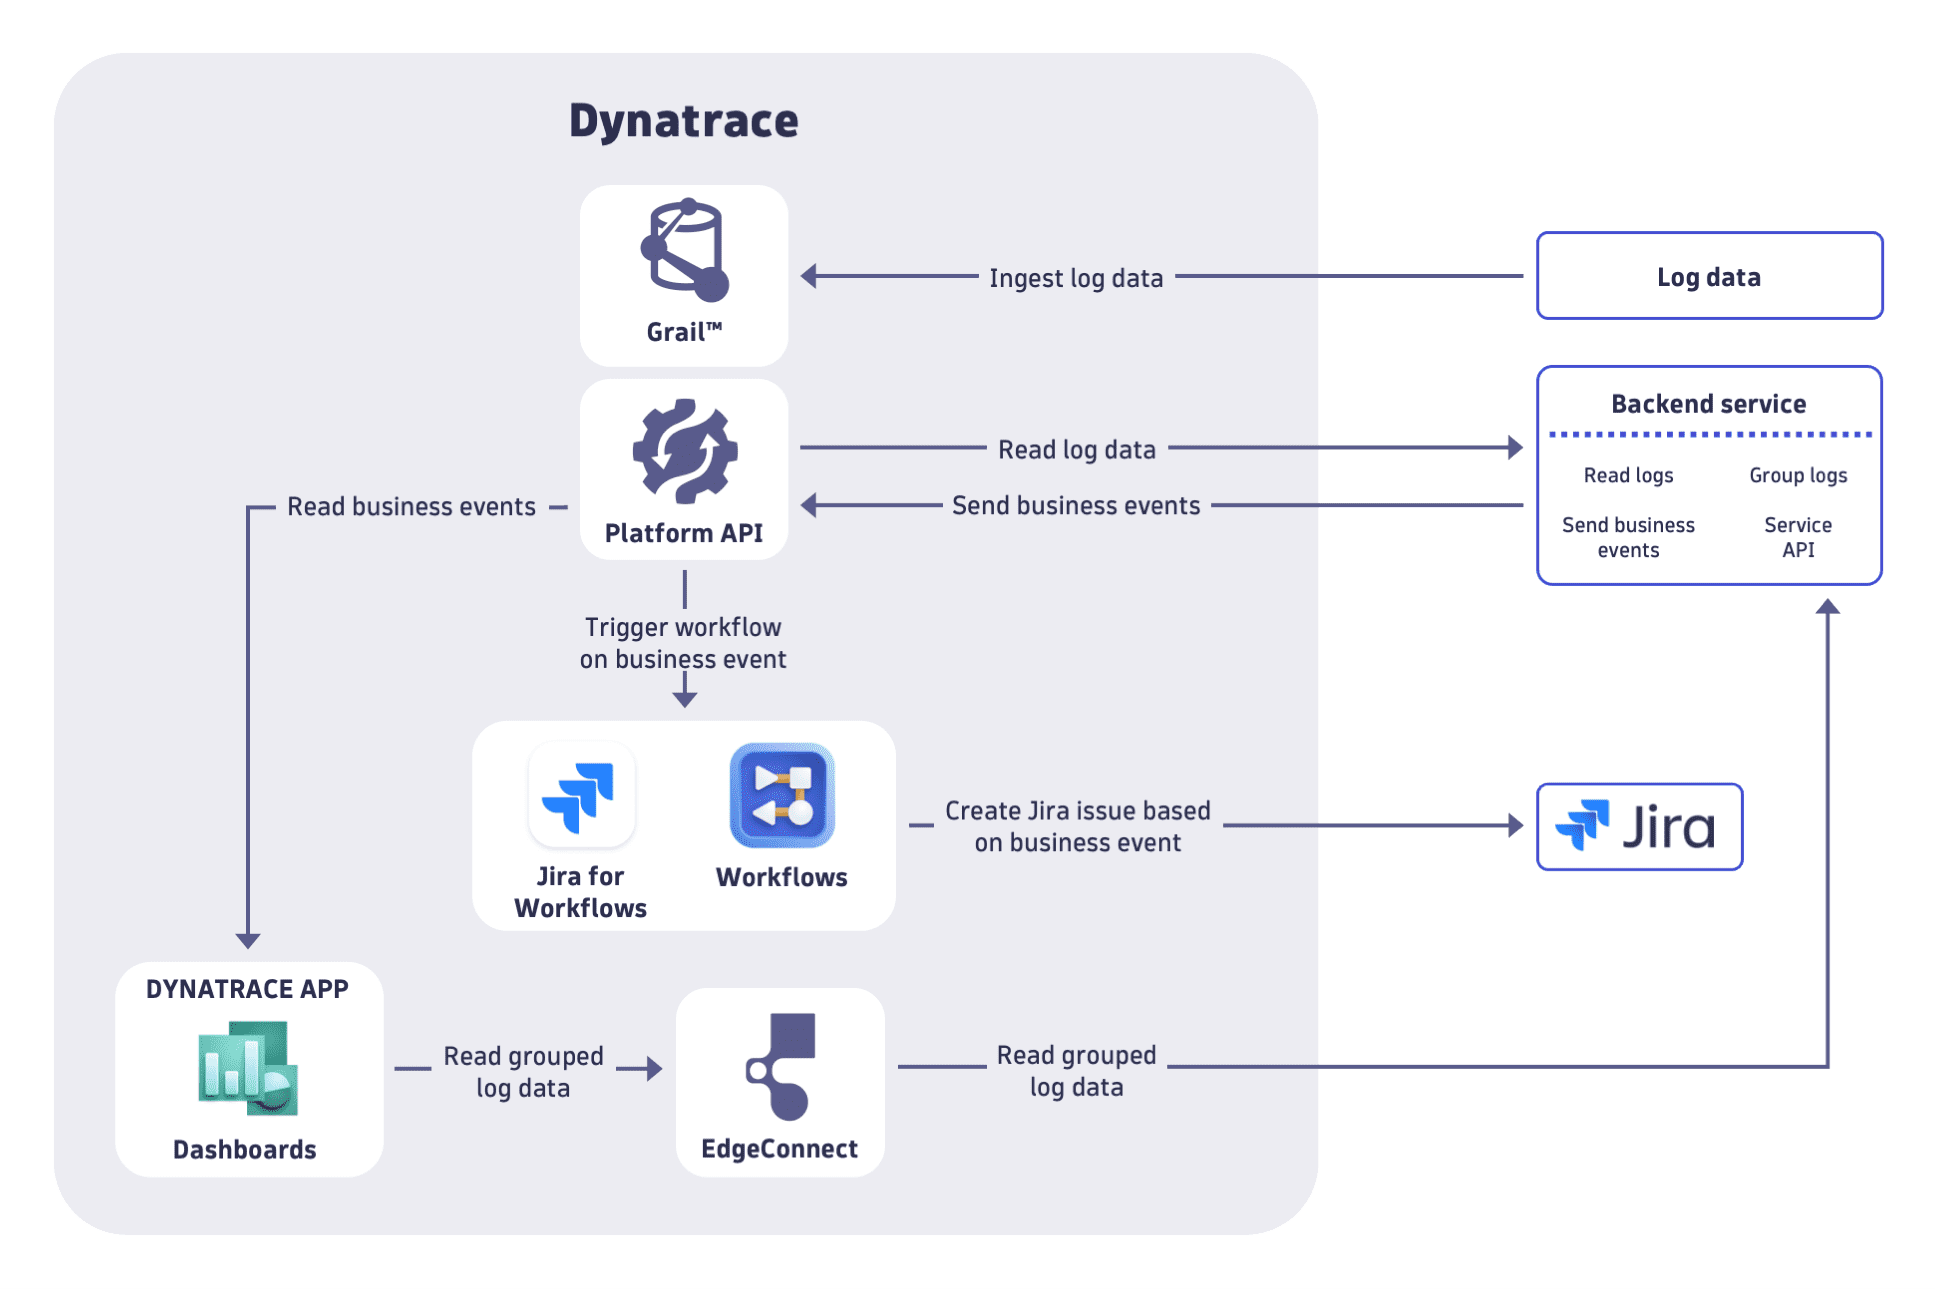
How it works
Dynatrace Automated bug triaging and ticketing consists of three stages:
- Ingesting log data
- Grouping and processing log data
- Using workflows for automated Jira ticketing
Steps
Complete the following steps to create your internal tool for bug triaging and distribution.
 Ingest log data
Ingest log and event data finto Dynatrace using OneAgent or Dynatrace API:
- Log ingestion via OneAgent
Automatically discover and ingest log and event data from a vast array of technologies. It supports multiple configurations of timestamps, masking sensitive data, detecting log rotation patterns, and much more. - Log ingestion API
With generic log ingestion, you can stream log records to a system and have Dynatrace transform the stream into meaningful log messages.
 Group log data
Using your backend service, aggregate and group log data and combine that into business events.
-
Filter log events by severity (critical and high) and timestamp (newest events).
Create specific DQL queries to fetch the logs and have a customised overview. The following query examples allow you to filter log data with specific loglevel value in OneAgent logs (based on specificlog.source) and log data with specific loglevel value for specific process groups (based ondt.entity.process_group)DQL query example to fetch OneAgent log data for a specific timeframe containing specific loglevel value
fetch logs, timeframe:"2023-10-04T00:00:00Z/2023-10-04T04:00:00Z"| filter startsWith(log.source, "/var/log/dynatrace/oneagent/java/")| filter loglevel == "WARN" OR loglevel == "SEVERE"DQL query example to fetch log data for known process groups containing specific loglevel value
fetch logs, timeframe:"2023-10-01T09:03:18Z/2023-10-02T09:03:18Z", scanLimitGBytes: -1| filter dt.entity.process_group == "PROCESS_GROUP-9C77F43CE98EAA17" ORdt.entity.process_group == "PROCESS_GROUP-a3444fa7ad1c3d41" ORdt.entity.process_group == "PROCESS_GROUP-e50850ceefbd9c7f" ORdt.entity.process_group == "PROCESS_GROUP-689574f4e137425c" ORdt.entity.process_group == "PROCESS_GROUP-37925f9c37724091"| filter ((loglevel == "WARN" ORloglevel == "WARNING" ORloglevel == "SEVERE" ORloglevel == "ERROR" ORloglevel == "CRITICAL" ORloglevel == "ALERT")) -
Group log messages.
Group similar log messages together to avoid duplicates and, based on tags or group metadata, identify teams that are likely the correct owners of the bug. Save the metadata, such as timestamp, thread name, class name, and log level. -
Process the log message.
For the log message processing, split the message into tokens and categorize them as mandatory word (conventionally prefixed with##), word, separator, and non-relevant word (dynamic log parts as IDs or timestamps). The grouping message of a log is then built asclassname(if present), plus the first four more relevant words, plus all remaining mandatory words.To summarize, the log records are grouped by:
- Tags
- Group metadata
- Related process group events
 Create Dynatrace Workflow
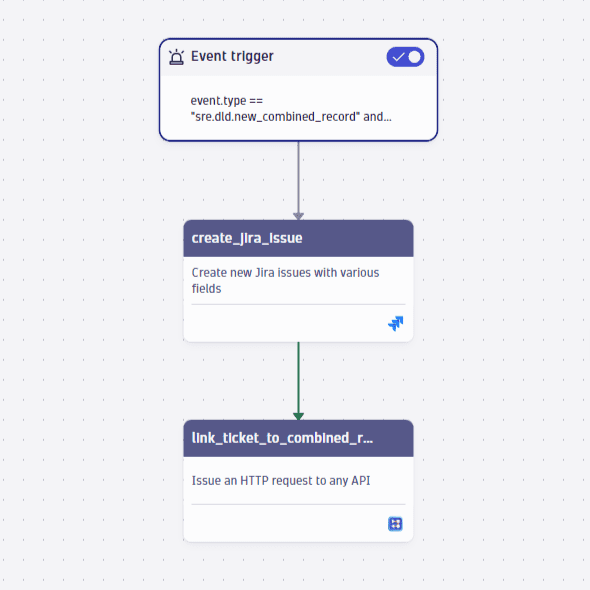
Create workflow based on business event to automatically create and assign Jira tickets.
- Check out Create workflows in Dynatrace Workflows for more information on building a workflow.
- Check out Jira Connector to find out more about using Jira workflow actions.
Show me the relevant workflow task
 Create Dynatrace Application
Create Dynatrace Application to consume and present grouped log data.
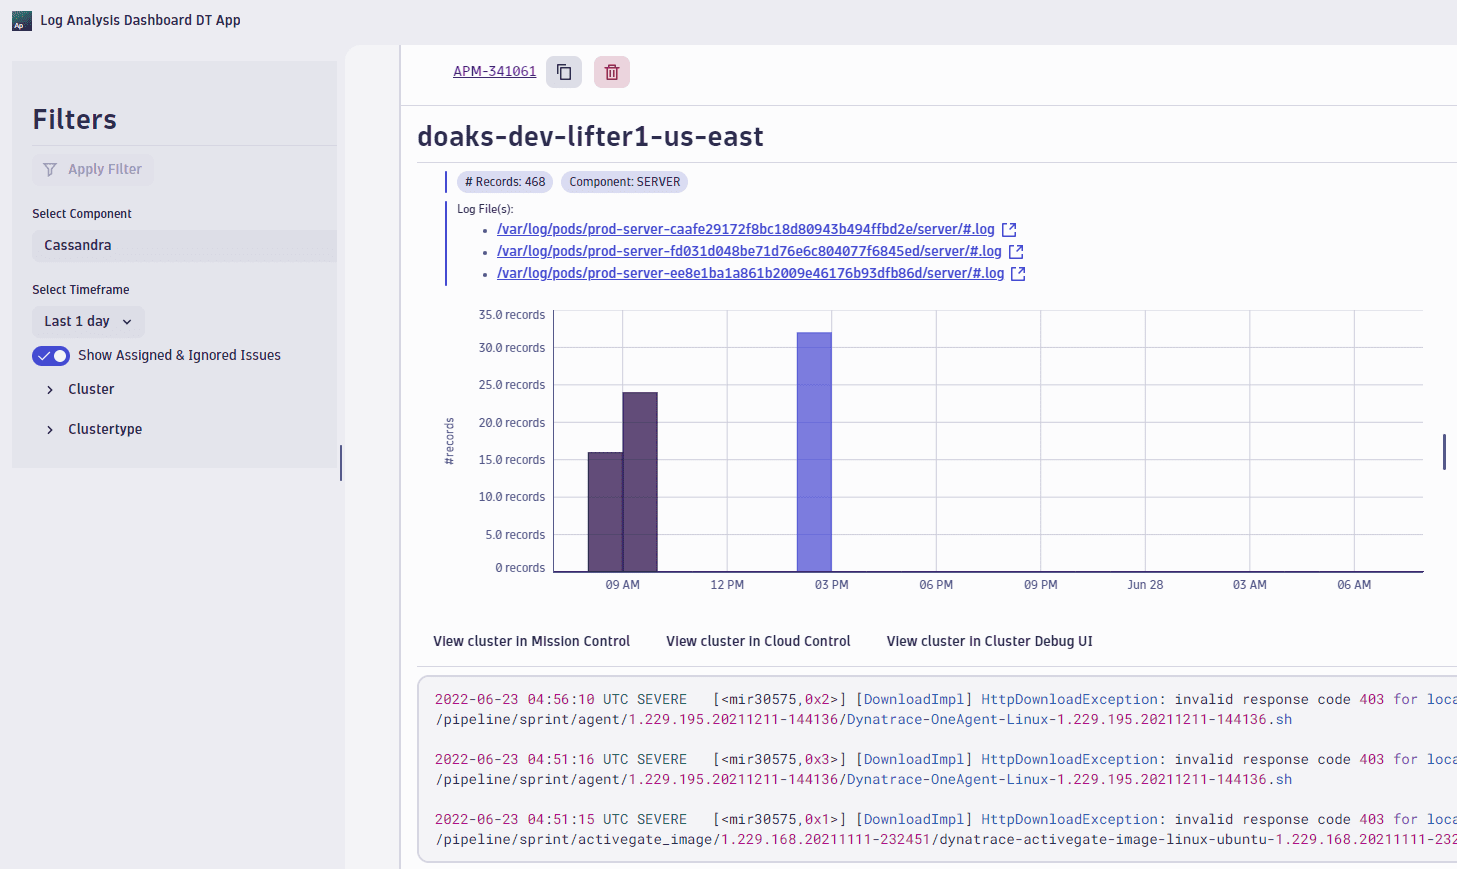
Using Dynatrace AppEngine create a dashboard application that consumes the grouped log data and based on this preliminary triaging and vetting, creates Jira issues in the correct projects assigned to the right teams.
Connect the dashboard application to the backend (via the EdgeConnect) and execute API calls. Dynatrace applications can also interact with your on-premises systems which you can run in your corporate network.
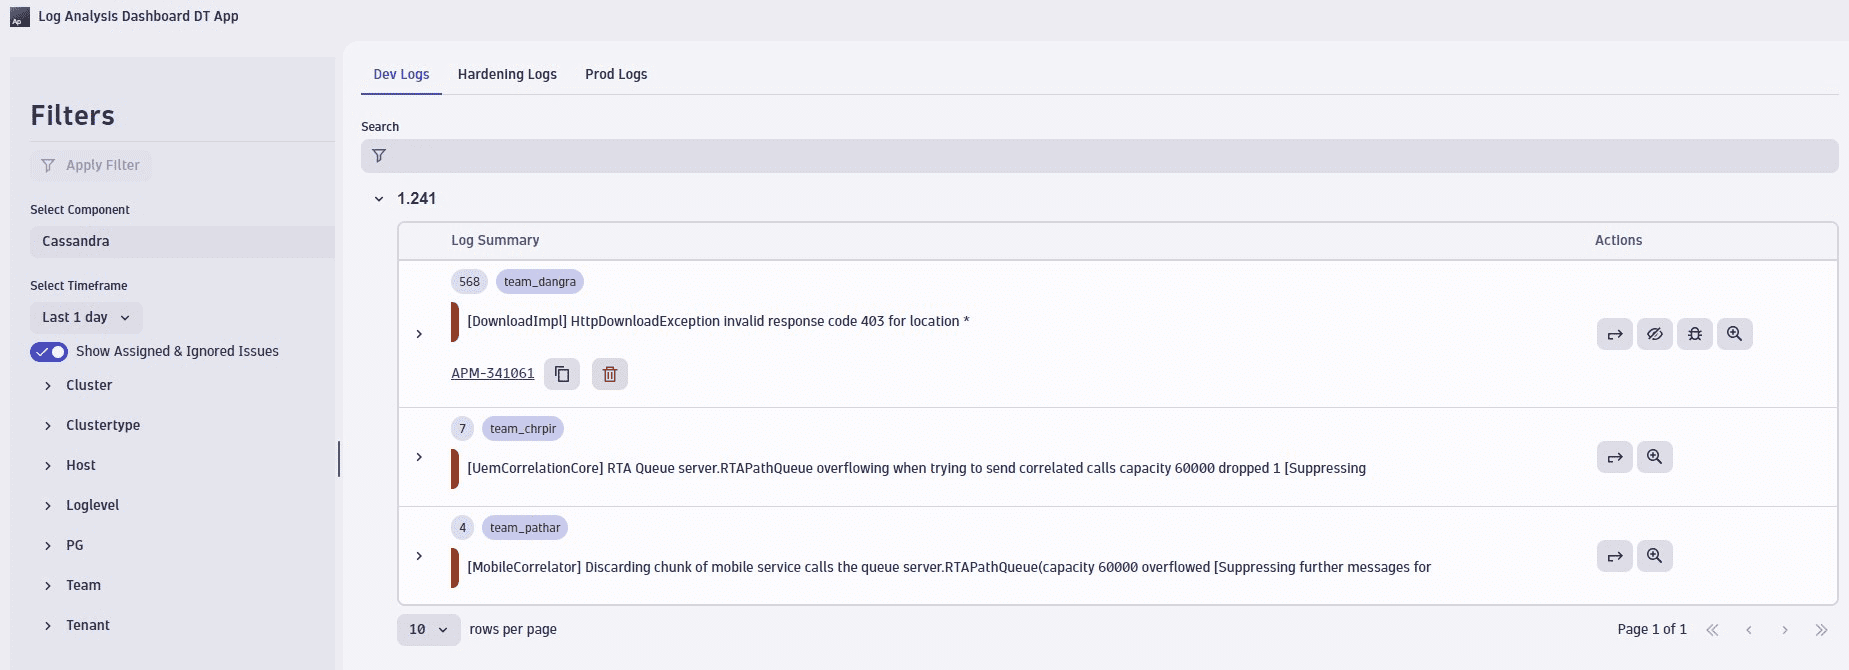
The dashboard application will analyze error or warning logs that indicate bugs in the code or system configuration that needs to be enhanced (for example, low CPU or low disk space). It can show in the overview the grouped logs for which tickets and comments can be automatically or manually created.
Conclusion
By implementing dashboard application with Dynatrace and including it in a daily meeting, teams can effectively detect, triage, and prioritize bugs, and automatically assign tickets to the right teams eliminating dependencies between teams. Teams have an overview for the component and services they are interested in and this allows them to focus and to respond quicker to problems before they reach the production and customers.
All teams have the same view of newly discovered bugs and can claim ownership in a self-service fashion. For all bugs, responsibilities and ownership can be clarified in a daily sync of less than half an hour. Without this common view, discussions would be dispersed and could easily take hours.
This results in higher quality of the product, elimination of manual correlation and ultimately also impacts the required effort for customer support.