Distributed Tracing
- Latest Dynatrace
- Overview
- 3-min read
Prerequisites
Permissions
The following table describes the required permissions.
Installation
Make sure the app is installed in your environment.
Get started
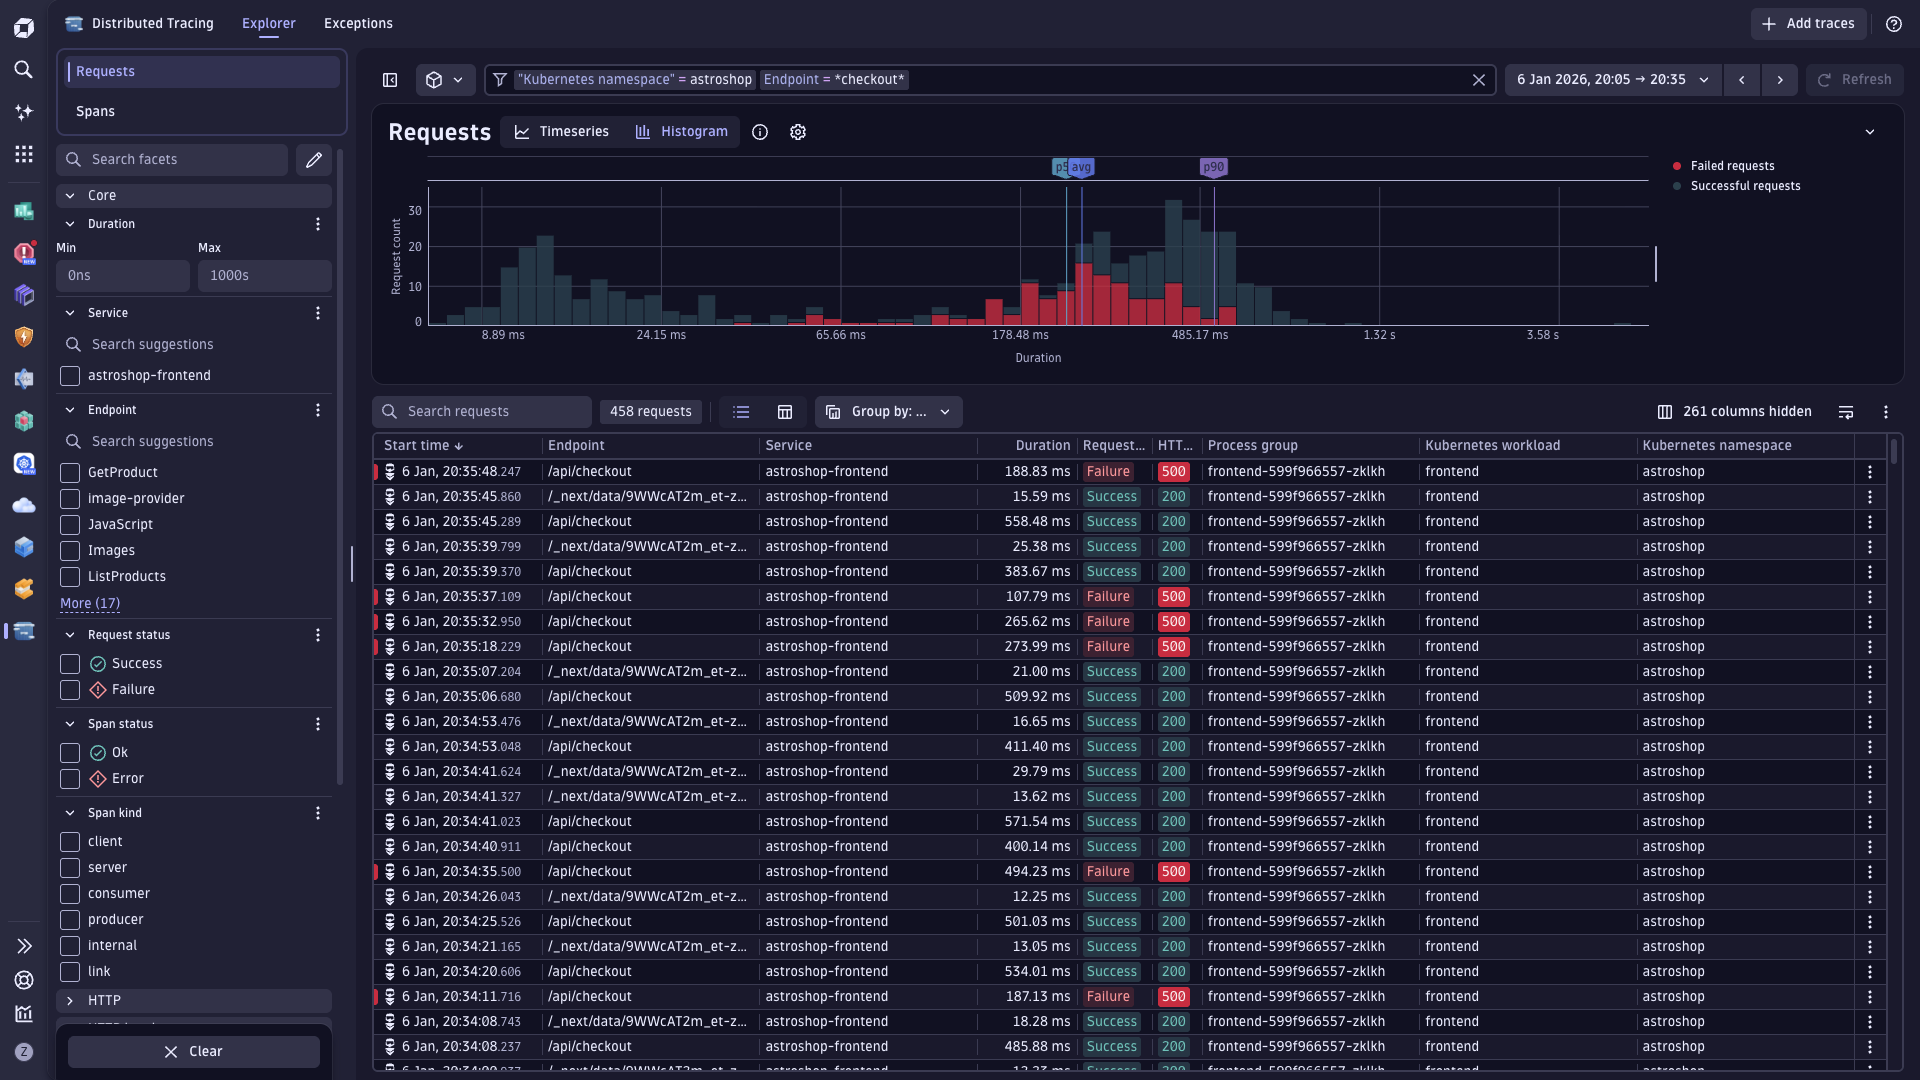
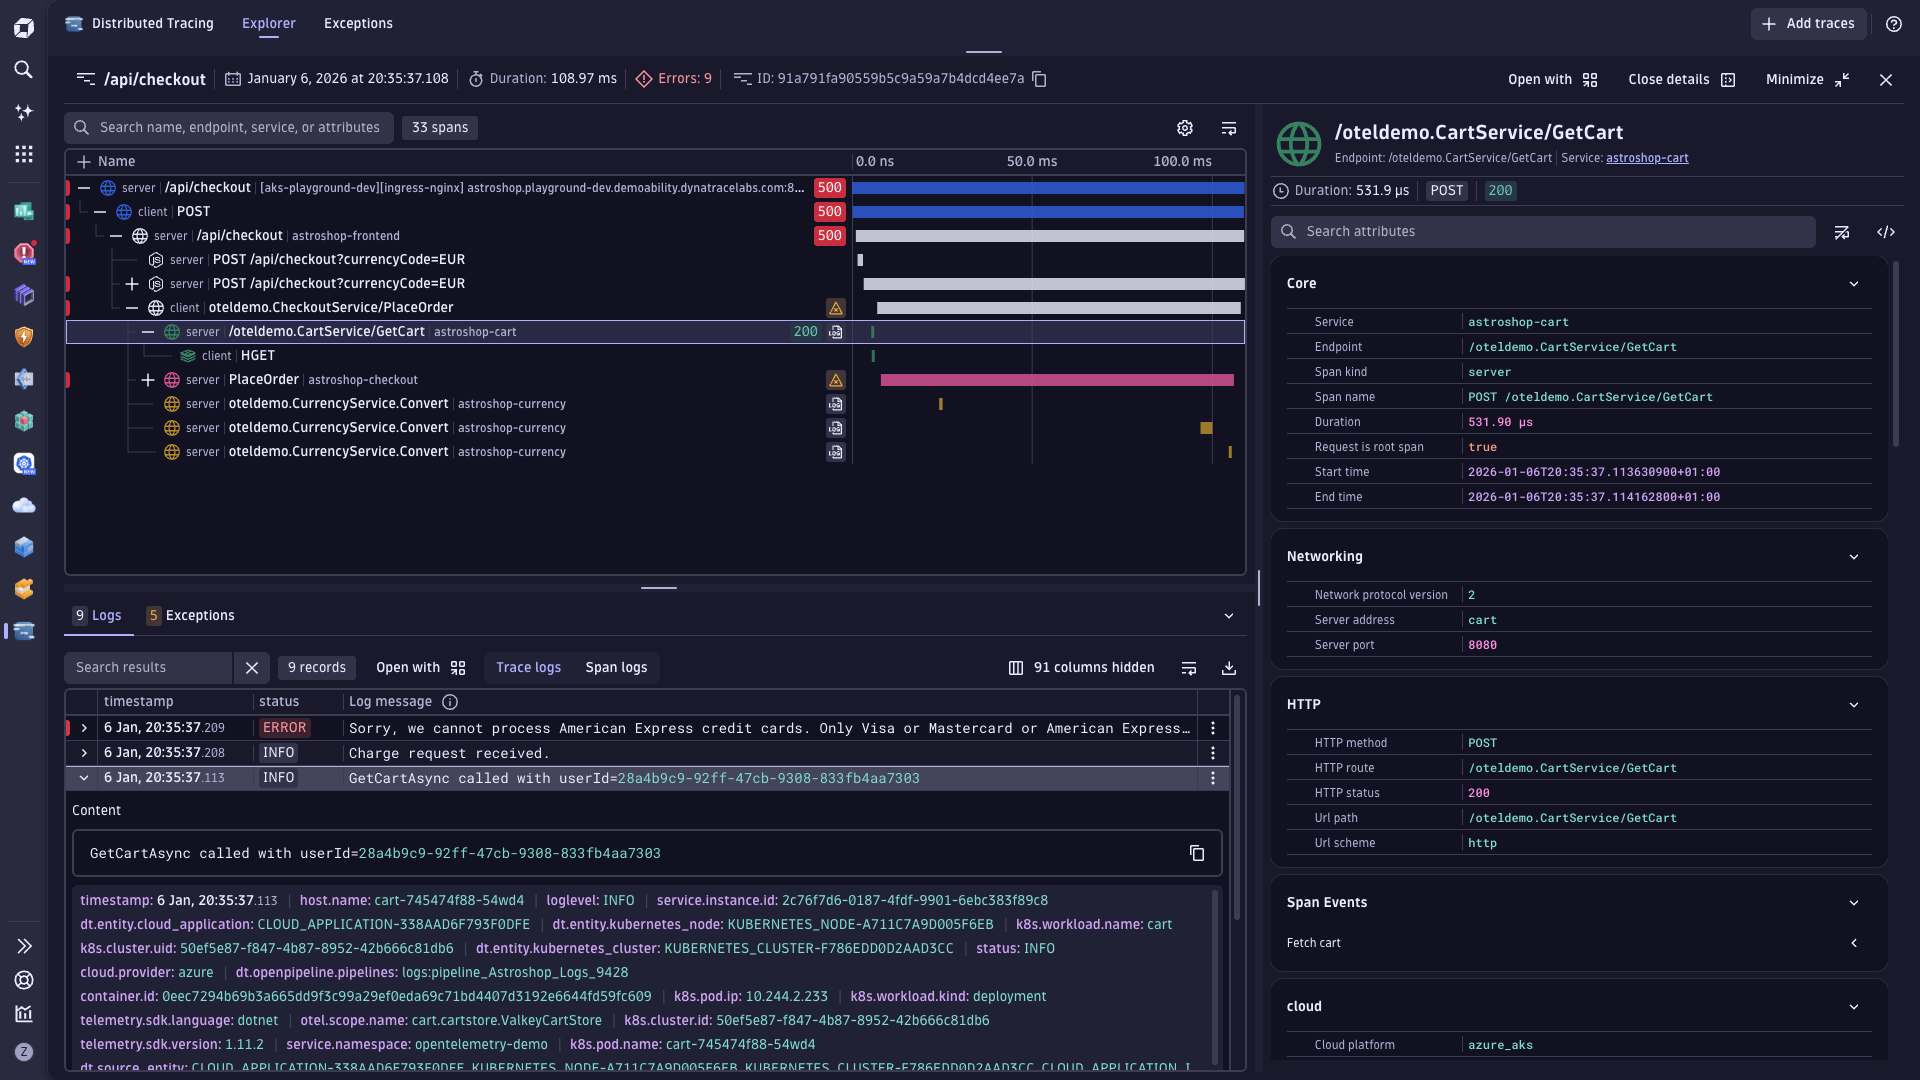
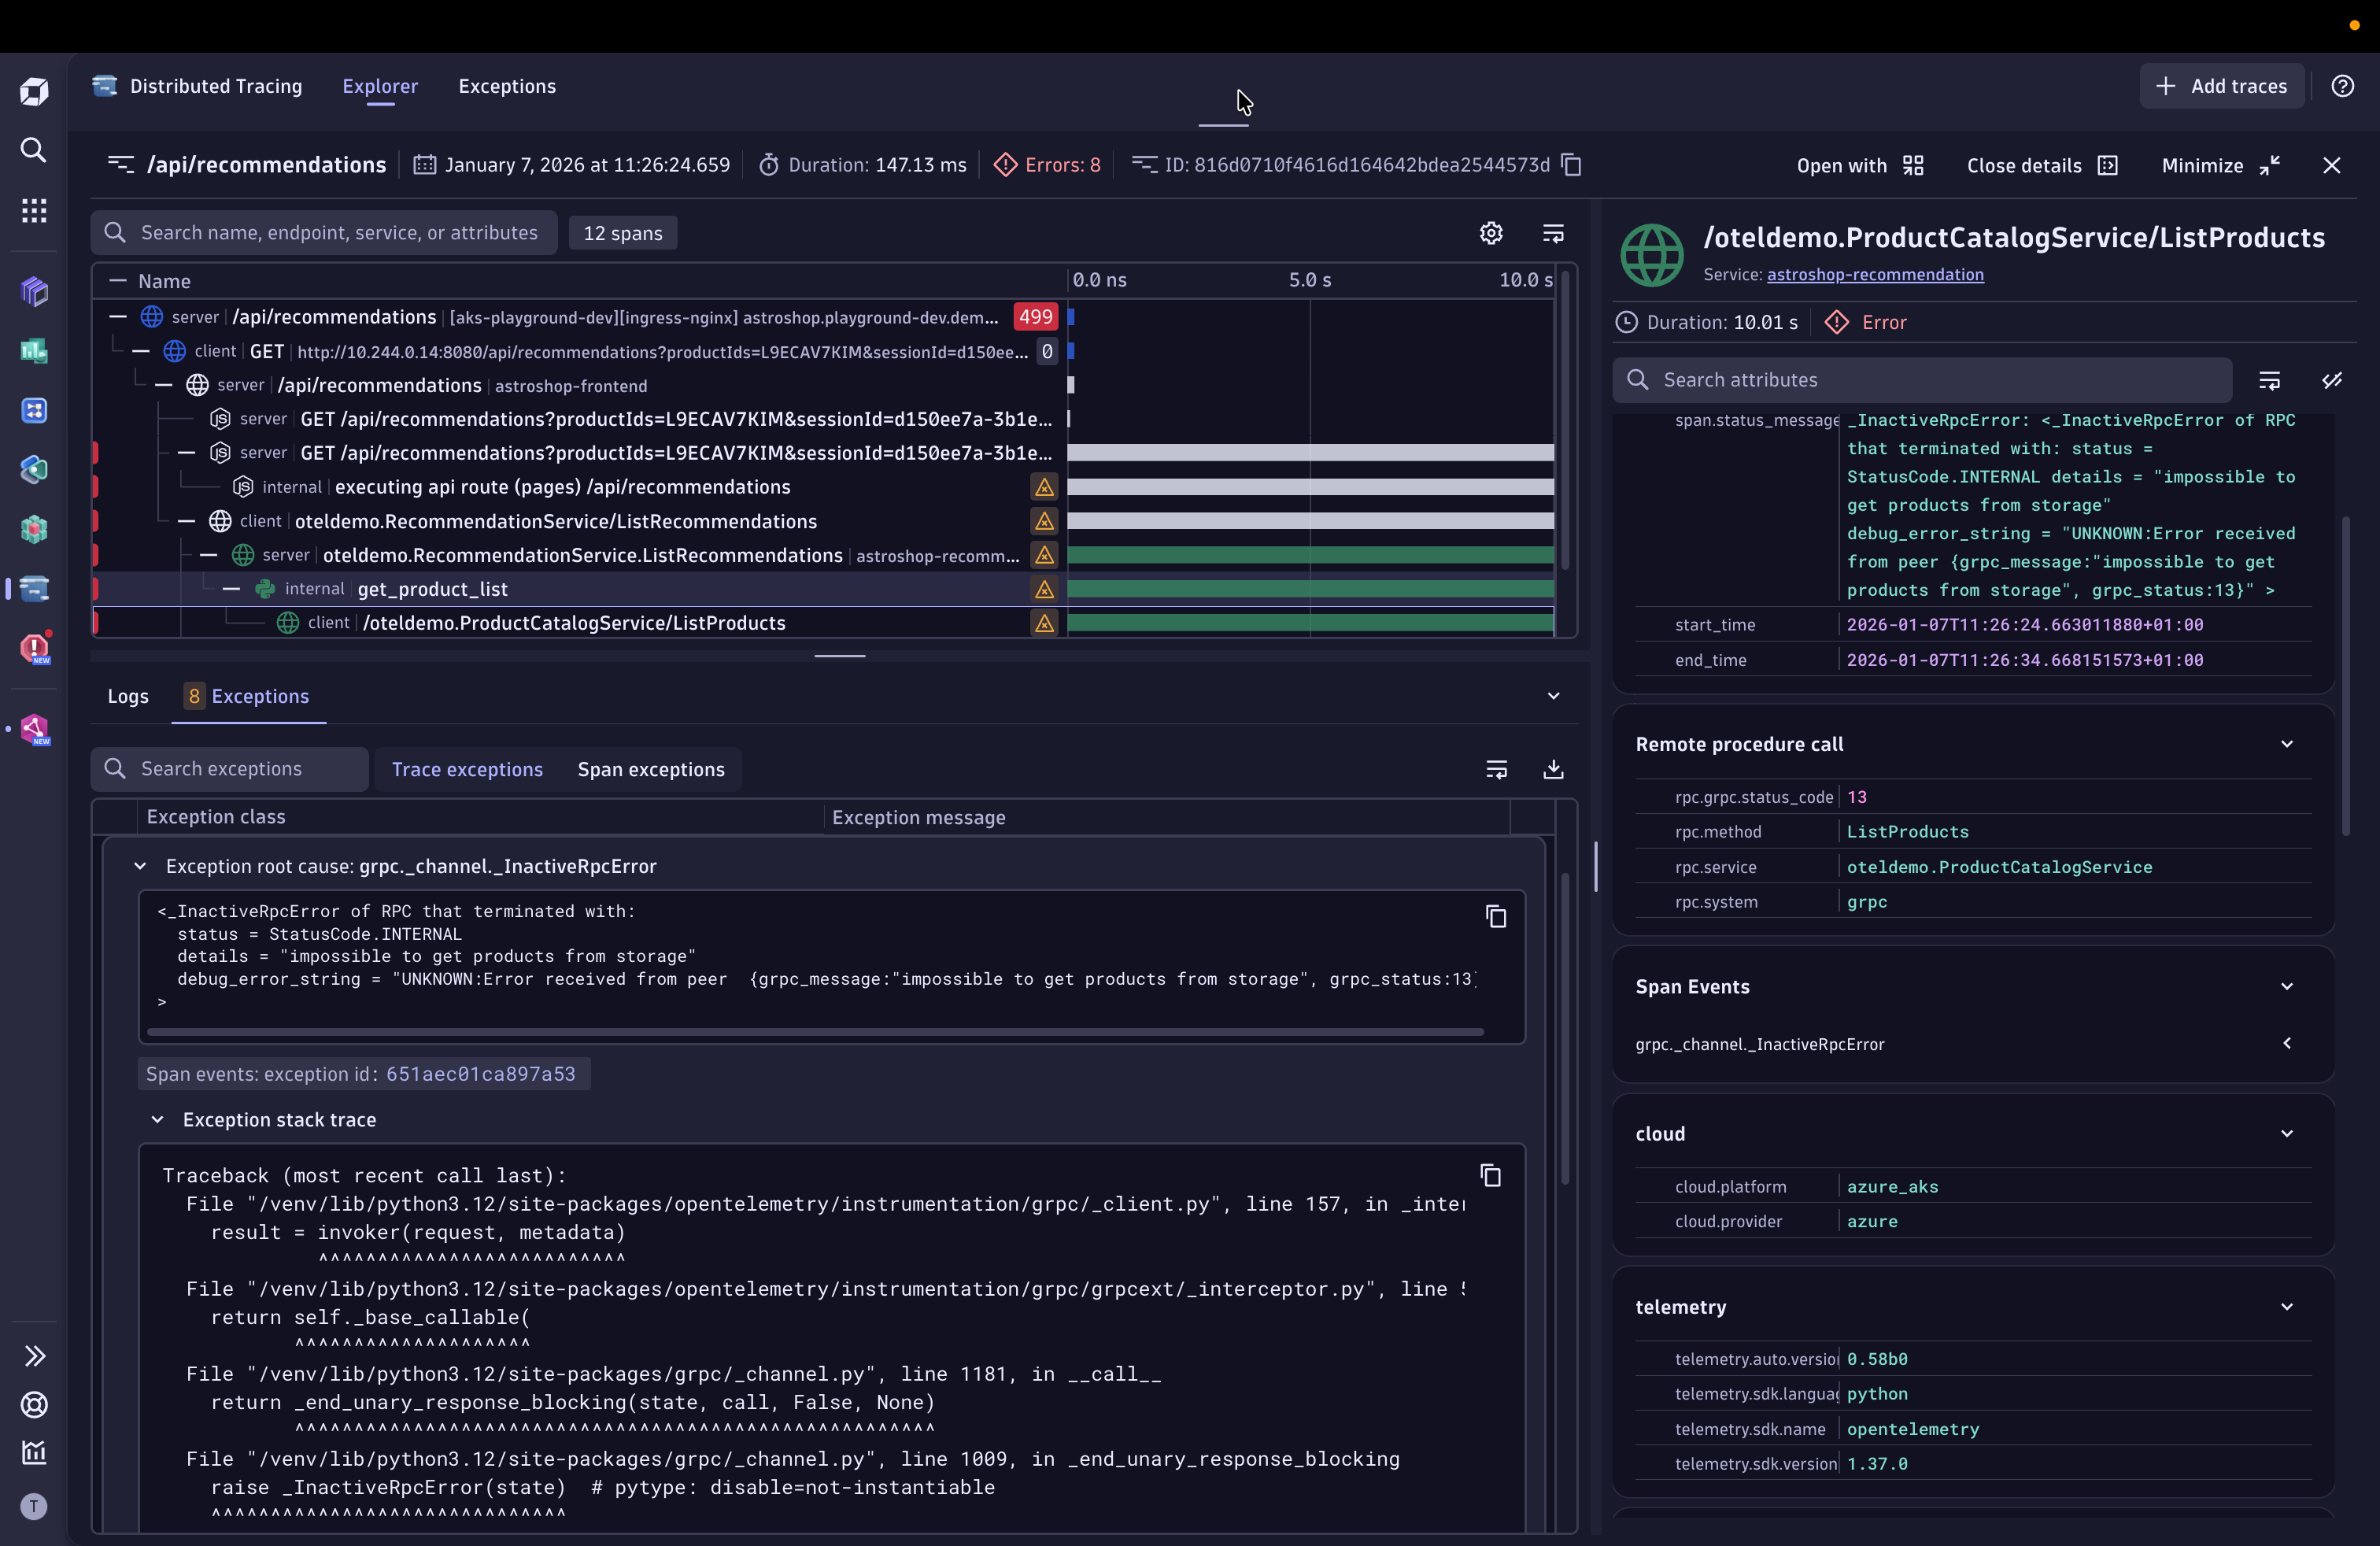
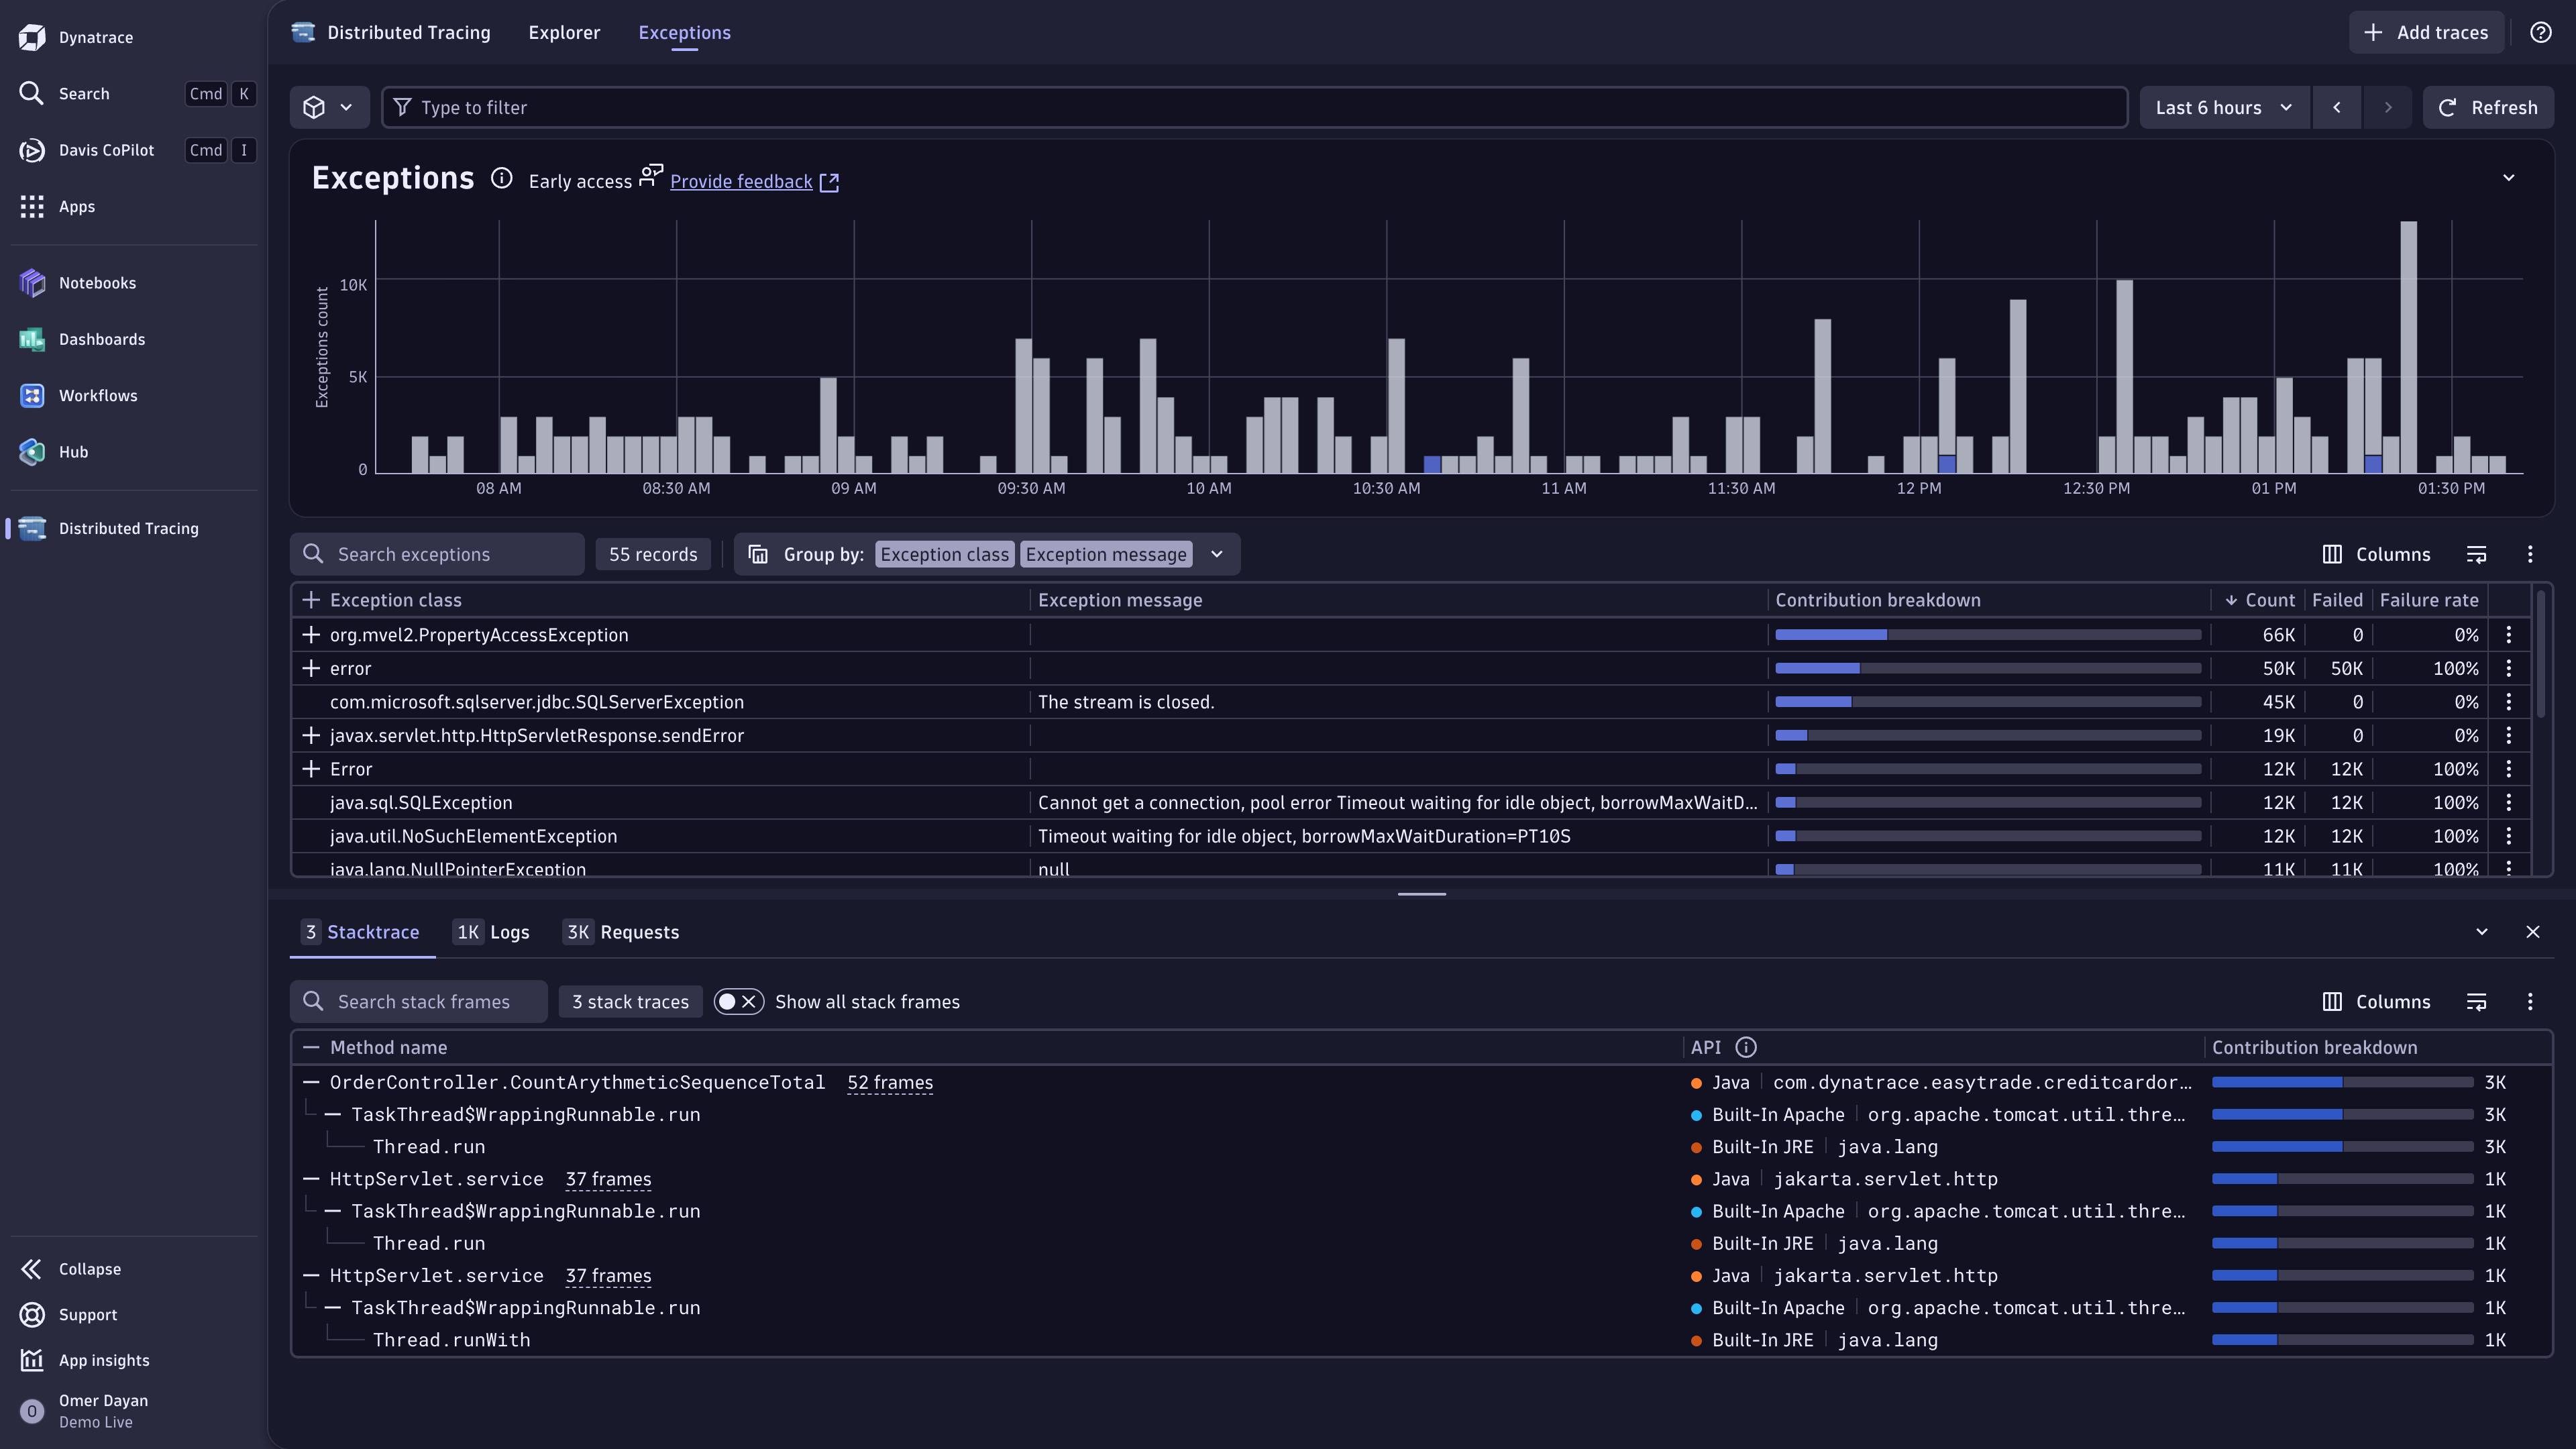
Distributed Tracing powered by Grail helps you get the most out of your trace data in Dynatrace. It enables the ingestion and processing of petabytes of trace data, allowing you to monitor and troubleshoot errors and performance issues in complex distributed software systems at scale. Trace data follows the Dynatrace trace-span data model, so the analysis of all related information and attributes is intuitive and can be done via  Distributed Tracing and Dynatrace Query Language (DQL). The trace data is stored in Grail, so you can leverage the power of Grail to analyze even unknown unknowns.
Distributed Tracing user-friendly interface is designed with engineers, SREs, and performance architects in mind, making it easy to visually analyze your trace data right away.
Learning modules
Go through the following process to learn using Distributed Tracing:
- Explanation
- Learn more about distributed tracing core concepts and terminology.
- How-to guide
- Instrument your applications with OneAgent or OpenTelemetry to start ingesting trace data into Dynatrace.
- How-to guide
- Enable Dynatrace OneAgent to capture the values of SQL bind variables.
- How-to guide
- Manage permissions for Distributed Tracing powered by Grail.
- How-to guide
- Manage data storage and retention for Distributed Tracing powered by Grail.
- Reference
- Understand span and trace context propagation in Dynatrace and how to set them up.
- Tutorial
- Utilize traces, logs, and DQL to visualize raw data and identify abnormal patterns.
- Explanation
- Analyze and filter trace data at the request and span level with advanced filtering, facets, and charts in the Distributed Tracing app.
- Tutorial
- Explore advanced tracing analysis capabilities on Grail.
Concepts
Distributed tracing concepts, including traces and spans, are fundamental to understanding how requests flow through distributed systems. Familiarity with these concepts enables effective monitoring and root cause analysis. See Distributed tracing concepts for key terms and definitions.
Use cases
Use Distributed Tracing for:
-
Troubleshooting: Find out why requests fail and prevent future issues.
-
Performance optimization: Understand system performance and identify bottlenecks to improve reliability and user experience.
-
Detailed analysis: Look into individual trace details for deeper insights.
-
Exploratory analysis: Use free-form analysis to discover and explore unknown unknowns on the fly.
-
Discovering unknown unknowns: Be prepared for the unknown by using free-form analysis to explore and dissect data on the fly.
-
Synthesizing traces and monitoring signals: View trace data in context with other signal like logs, business events, or metrics.
FAQ
Why do I see the message "The new tracing experience is coming to your environment soon!" when starting the Distributed Tracing app?
The new tracing experience is rolled out in stages to extend access to Dynatrace SaaS DPS customers until March 2025. The availability timing depends on the geographic region and the overall trace volume of your account. For more information, reach out to your Customer Success Manager.
Are traces in Distributed Traces Classic views still available?
Yes. Once you start analyzing traces in the Distributed Tracing app, you can continue to use Distributed Traces Classic side by side.
Which licensing package covers Distributed Tracing?
DPS FullStack and/or Custom Traces Classic. No additional costs apply when you're using the new Distributed Tracing app.
I modified facets. Can I reset them to the recommended way?
Yes. Go to Distributed Tracing and select Show facets > Reset to default.
Can I use primary Grail tags to filter traces?
Yes. Primary tags are available as free facets and in the filter field in Distributed Tracing. For details, see Filter with primary Grail tags.
How can I remove span.kind links with null duration?
Update to the latest version of OneAgent.
Not all traces available in Distributed Traces Classic are visible in the Distributed Tracing app.
- Make sure you have the latest version of OneAgent.
- Make sure the OneAgent feature Forward Tag 4 trace context extension is on; this ensures OneAgent-captured traces are compatible with the W3C trace context standard.
I see incomplete end-to-end traces in the Distributed Tracing app that are shown complete in Distributed Traces Classic.
- Make sure you have the latest version of OneAgent.
- Make sure the OneAgent feature Forward Tag 4 trace context extension is on; this ensures OneAgent-captured traces are compatible with the W3C trace context standard.
How can I filter for traces that are collected by OneAgent or ingested via OpenTelemetry?
- Go to Distributed Tracing.
- In the facet list, enter
span sourceand select the source you're interested in.
Does the new distributed tracing experience support cross-environment tracing?
Not yet.

Explore in Dynatrace Hub
Analyze and slice distributed traces by any attribute and from any source.
Distributed Tracing