Set up the Dynatrace GCP metric and/or log integration in a Kubernetes container (legacy)
- Latest Dynatrace
- How-to guide
- 16-min read
- Published Mar 12, 2021
- Deprecated
This page describes how to install version 0.1 of the GCP integration in a Kubernetes container, which is scheduled for deprecation.
- If you are making a fresh installation, you should deploy the GCP metric and/or log integration (v.1.0) in a Kubernetes container.
- If you already have version 0.1 of the GCP integration installed, you should migrate to version 1.0.
To ingest metrics and/or logs from Google Cloud, you need to deploy a container on GKE (it also works on Google Autopilot). After it's deployed, you get metrics for services defined in the configmap, preset dashboards, and predefined alerts.
Set up generic log ingestion Optional
For complete observability of your workloads, be sure to set up generic log ingestion before installation. This requires additional configuration and a second container to forward the logs. See below for instructions.
-
Create a Pub/Sub topic and add a subscription to it. There are two ways to do this:
In the Google Cloud console
Set up a Pub/Sub topic and add a subscription to it.
When editing the subscription, we recommend the following values:
- Acknowledgement deadline:
120seconds - Message retention duration:
1day - Retain acknowledged messages: not selected
In Google Cloud Shell
Run the following shell script in the GCP project you've selected for deployment.
Be sure to replace
<your-subscription-name>and<your-topic-name>with your own values.wget https://raw.githubusercontent.com/dynatrace-oss/dynatrace-gcp-monitor/master/scripts/deploy-pubsub.shchmod +x deploy-pubsub.sh./deploy-pubsub.sh --topic-name <your-topic-name> --subscription-name <your-subscription-name> - Acknowledgement deadline:
-
Configure log export to send the desired logs to the GCP Pub/Sub topic created in the previous step.
-
If you choose to use an existing ActiveGate during deployment, configure ActiveGate for generic log ingestion.
Prerequisites
To deploy the Dynatrace GCP Monitor in a Kubernetes container, you need to make sure the following GCP and Dynatrace requirements are met.
GCP requirements
Permissions
Running the deployment script requires a list of permissions. You can create a custom role (see below) and use it to deploy dynatrace-gcp-monitor.
- Create a YAML file named
dynatrace-gcp-monitor-helm-deployment-role.yamlwith the following content:
dynatrace-gcp-monitor-helm-deployment-role.yaml
title: Dynatrace GCP Monitor helm deployment roledescription: Role for Dynatrace GCP Monitor helm and pubsub deploymentstage: GAincludedPermissions:- container.clusters.get- container.configMaps.create- container.configMaps.delete- container.configMaps.get- container.configMaps.update- container.deployments.create- container.deployments.delete- container.deployments.get- container.deployments.update- container.namespaces.create- container.namespaces.get- container.pods.get- container.pods.list- container.replicaSets.create- container.replicaSets.get- container.replicaSets.getScale- container.replicaSets.getStatus- container.replicaSets.list- container.secrets.create- container.secrets.delete- container.secrets.get- container.secrets.list- container.secrets.update- container.serviceAccounts.create- container.serviceAccounts.delete- container.serviceAccounts.get- container.services.create- container.services.delete- container.services.get- container.statefulSets.create- container.statefulSets.delete- container.statefulSets.get- container.statefulSets.update- iam.roles.create- iam.roles.list- iam.roles.update- iam.serviceAccounts.actAs- iam.serviceAccounts.create- iam.serviceAccounts.getIamPolicy- iam.serviceAccounts.list- iam.serviceAccounts.setIamPolicy- pubsub.subscriptions.create- pubsub.subscriptions.get- pubsub.subscriptions.list- pubsub.topics.attachSubscription- pubsub.topics.create- pubsub.topics.getIamPolicy- pubsub.topics.list- pubsub.topics.setIamPolicy- pubsub.topics.update- resourcemanager.projects.get- resourcemanager.projects.getIamPolicy- resourcemanager.projects.setIamPolicy- serviceusage.services.enable- serviceusage.services.get
- Run the command below, replacing
<your_project_ID>with the project ID where you want to deploy the dynatrace integration.
gcloud iam roles create dynatrace_monitor.helm_deployment --project=<your_project_ID> --file=dynatrace-gcp-monitor-helm-deployment-role.yaml
Be sure to add this role to your GCP user.
Tools
If you run the deployment from GCP Cloud Shell, you don't need to install additional tools.
If you run the deployment from any host with bash, you need to install:
Settings
If you run the deployment on an existing GKE standard cluster, you need to:
If you run the deployment on an existing GKE Autopilot cluster, or on a new Autopilot cluster that will be automatically created by deployment script, there are no additional settings.
Dynatrace requirements
Review the requirements for ActiveGate and tokens as described below.
ActiveGate
For ActiveGate, you have two options:
- Have the installation script create a dedicated ActiveGate (default option). Recommended
- Use an existing ActiveGate version 1.213+. Required
Tokens
The requirements for API and PaaS tokens are as follows:
- Create an API token
- Enable the following permissions for the API token as needed:
- To ingest metrics: Ingest metrics (API v2), Read configuration (API v1), Write configuration (API v1)
- To ingest logs: Ingest logs (API v2)
- To ingest both logs and metrics: Ingest logs (API v2), Ingest metrics (API v2), Read configuration (API v1), Write configuration (API v1)
- Create a PaaS token (if you choose to set up a new ActiveGate during deployment)
Install
To install the GCP Monitor in a Kubernetes cluster, follow the instructions below.

Download the helm deployment package in Google Cloud Shell

Determine the URL for your environment

Configure parameter values

Connect your Kubernetes cluster

Run the script
Download the helm deployment package in Google Cloud Shell
Download and run the installation script below, making sure to replace <VERSION> with the release version you want to download, for example 0.1.19.
Be sure to choose one of the versions before release-1.0.0, as the newer versions require different installation instructions.
wget -q "https://github.com/dynatrace-oss/dynatrace-gcp-monitor/releases/download/release-<VERSION>/helm-deployment-package.tar"; tar -xvf helm-deployment-package.tar; chmod +x helm-deployment-package/deploy-helm.sh
Determine the URL for your environment
- For Dynatrace SaaS:
https://<your-environment-id>.live.dynatrace.com - For Dynatrace Managed:
https://<your-domain>/e/<your-environment-id> - For ActiveGate (if you choose to use an existing ActiveGate to ingest logs):
https://<your-active-gate-IP-or-hostname>:9999/e/<your-environment-id>
To determine <your-environment-id>, see environment ID.
Configure parameter values
The values.yaml file located in helm-deployment-package/dynatrace-gcp-monitor allows you to set the required and optional parameter values. See below for the complete list of parameters available for this integration.
Parameters for metrics and logs ingestion (deployment type: all)
| Parameter name | Description | Default value |
|---|---|---|
gcpProjectId | The GCP project ID where the Dynatrace GCP Monitor should be deployed. Use the GCP project of log Sink Pub/Sub subscription. For details, see Set up generic log ingestion. | Your current project ID |
deploymentType | Set to 'all'. | all |
dynatraceAccessKey | Your Dynatrace API token with the required permissions according to your selected deployment. For details, see Token requirements. | |
activeGate.dynatracePaasToken | Your PaaS token. For details, see Token requirements. | |
dynatraceUrl | Your Dynatrace environment endpoint. For details, see Determine the URL for your environment. | |
logsSubscriptionId | The ID of your log Sink Pub/Sub subscription. For details, see Set up generic log ingestion. |
Optional additional parameters for metrics and logs ingestion
Optional
| Parameter name | Description | Default value |
|---|---|---|
activeGate.useExisting | Set to true if you choose to use an existing ActiveGate to ingest logs. For details, see ActiveGate requirements. | false |
dynatraceLogIngestUrl | Your ActiveGate endpoint used to ingest logs to Dynatrace. For details, see Determine the URL for your environment. | |
requireValidCertificate | If set to true, Dynatrace requires the SSL certificate of your Dynatrace environment. | true |
selfMonitoringEnabled | Send custom metrics to GCP to quickly diagnose if dynatrace-gcp-monitor processes and sends metrics/logs to Dynatrace properly. | false |
dockerImage | Dynatrace GCP Monitor docker image. We recommend using the default value, but you can adapt it if needed. | dynatrace/dynatrace-gcp-monitor |
logIngestContentMaxLength | The maximum content length of a log event. Should be less than or equal to the setting on your Dynatrace environment. | 8192 |
logIngestAttributeValueMaxLength | The maximum length of the log event attribute value. If it exceeds the server limit, content will be truncated. | 250 |
logIngestRequestMaxEvents | The maximum number of log events in a single payload to the logs ingestion endpoint. If it exceeds the server limit, payload will be rejected with code 413. | 5000 |
logIngestRequestMaxSize | The maximum size in bytes of a single payload to the logs ingestion endpoint. If it exceeds the server limit, payload will be rejected with code 413. | 1048576 |
logIngestEventMaxAgeSeconds | Determines the maximum age of a forwarded log event. Should be less than or equal to the setting on your Dynatrace environment. | 86400 |
printMetricIngestInput | If set to true, the GCP Monitor outputs the lines of metrics to stdout. | false |
serviceUsageBooking | Service usage booking is used for metrics and determines a caller-specified project for quota and billing purposes. If set to source, monitoring API calls are booked in the project where the Kubernetes container is running. If set to destination, monitoring API calls are booked in the project that is monitored. For details, see Monitor multiple GCP projects - Step 4. | source |
useProxy | Depending on the value you set for this flag, the GCP Monitor will use the following proxy settings: Dynatrace (set to DT_ONLY), GCP API (set to GCP_ONLY), or both (set to ALL). | By default, proxy settings are not used. |
httpProxy | The proxy HTTP address; use this flag in conjunction with USE_PROXY. | |
httpsProxy | The proxy HTTPS address; use this flag in conjunction with USE_PROXY. | |
importDashboards | Import predefined dashboards for selected services. | true |
importAlerts | Import predefined alerting rules for selected services. | true |
gcpServicesYaml | Configuration file for GCP services. | |
queryInterval | Metrics polling interval in minutes. Allowed values: 1 - 6 | 3 |
Parameters for metrics-only ingestion (deployment type: metrics)
| Parameter name | Description | Default value |
|---|---|---|
deploymentType | Set to 'metrics'. | all |
dynatraceAccessKey | Your Dynatrace API token with the required permissions according to your selected deployment. For details, see Token requirements. | |
dynatraceUrl | Your Dynatrace environment endpoint. For details, see Determine the URL for your environment. |
Optional additional parameters for metrics-only ingestion
Optional
| Parameter name | Description | Default value |
|---|---|---|
requireValidCertificate | If set to true, Dynatrace requires the SSL certificate of your Dynatrace environment. | true |
selfMonitoringEnabled | Send custom metrics to GCP to quickly diagnose if dynatrace-gcp-monitor processes and sends metrics/logs to Dynatrace properly. | false |
dockerImage | Dynatrace GCP Monitor docker image. We recommend using the default value, but you can adapt it if needed. | dynatrace/dynatrace-gcp-monitor |
printMetricIngestInput | If set to true, the GCP Monitor outputs the lines of metrics to stdout. | false |
serviceUsageBooking | Service usage booking is used for metrics and determines a caller-specified project for quota and billing purposes. If set to source, monitoring API calls are booked in the project where the Kubernetes container is running. If set to destination, monitoring API calls are booked in the project that is monitored. For details, see Monitor multiple GCP projects - Step 4. | source |
useProxy | Depending on the value you set for this flag, the GCP Monitor will use the following proxy settings: Dynatrace (set to DT_ONLY), GCP API (set to GCP_ONLY), or both (set to ALL). | By default, proxy settings are not used. |
httpProxy | The proxy HTTP address; use this flag in conjunction with USE_PROXY. | |
httpsProxy | The proxy HTTPS address; use this flag in conjunction with USE_PROXY. | |
importDashboards | Import predefined dashboards for selected services. | true |
importAlerts | Import predefined alerting rules for selected services. | true |
gcpServicesYaml | Configuration file for GCP services. | |
queryInterval | Metrics polling interval in minutes. Allowed values: 1 - 6 | 3 |
Parameters for logs-only ingestion (deployment type: logs)
| Parameter name | Description | Default value |
|---|---|---|
gcpProjectId | The GCP project ID where the Dynatrace GCP Monitor should be deployed. Use the GCP project of log Sink Pub/Sub subscription. For details, see Set up generic log ingestion. | Your current project ID |
deploymentType | Set to 'logs'. | all |
dynatraceAccessKey | Your Dynatrace API token with the required permissions according to your selected deployment. For details, see Token requirements. | |
activeGate.dynatracePaasToken | Your PaaS token. For details, see Token requirements. | |
dynatraceUrl | Your Dynatrace environment endpoint. For details, see Determine the URL for your environment. | |
logsSubscriptionId | The ID of your log Sink Pub/Sub subscription. For details, see Set up generic log ingestion. |
Optional additional parameters for logs-only ingestion
Optional
| Parameter name | Description | Default value |
|---|---|---|
activeGate.useExisting | Set to true if you choose to use an existing ActiveGate to ingest logs. For details, see ActiveGate requirements. | false |
dynatraceLogIngestUrl | Your ActiveGate endpoint used to ingest logs to Dynatrace. For details, see Determine the URL for your environment. | |
requireValidCertificate | If set to true, Dynatrace requires the SSL certificate of your Dynatrace environment. | true |
selfMonitoringEnabled | Send custom metrics to GCP to quickly diagnose if dynatrace-gcp-monitor processes and sends metrics/logs to Dynatrace properly. | false |
dockerImage | Dynatrace GCP Monitor docker image. We recommend using the default value, but you can adapt it if needed. | dynatrace/dynatrace-gcp-monitor |
logIngestContentMaxLength | The maximum content length of a log event. Should be less than or equal to the setting on your Dynatrace environment. | 8192 |
logIngestAttributeValueMaxLength | The maximum length of the log event attribute value. If it exceeds server limit, content will be truncated. | 250 |
logIngestRequestMaxEvents | The maximum number of log events in a single payload to the logs ingestion endpoint. If it exceeds the server limit, payload will be rejected with code 413. | 5000 |
logIngestRequestMaxSize | The maximum size in bytes of a single payload to the logs ingestion endpoint. If it exceeds the server limit, payload will be rejected with code 413. | 1048576 |
logIngestEventMaxAgeSeconds | Determines the maximum age of a forwarded log event. Should be less than or equal to the setting on your Dynatrace environment. | 86400 |
Connect your Kubernetes cluster
- If you want to have a new GKE Autopilot cluster created by the deployment script, add
--create-autopilot-clusterto the script. No connection is needed in this case, because the deployment script will connect to the new cluster automatically. - If you run the deployment on an existing GKE standard cluster or an existing GKE Autopilot cluster, you can connect to your cluster from the GCP console or via terminal. Follow the instructions below.
- In your GCP console, go to your Kubernetes Engine.
- Select Clusters > Connect.
- Select Run in Cloud Shell.
Run the script
- If you run the deployment on an existing GKE standard cluster or an existing GKE Autopilot cluster, the script will create an IAM service account with the necessary roles and deploy
dynatrace-gcp-monitorto your Kubernetes cluster. - If you run the deployment with the
--create-autopilot-clusteroption, the script will automatically create the new GKE Autopilot cluster and deploydynatrace-gcp-monitorto it.
To run the script, follow the instructions below.
You have two options:
- Run the script without parameters if you want to use the default values provided (
dynatrace-gcp-monitor-safor the IAM service account name anddynatrace_monitorfor the IAM role name prefix):
cd helm-deployment-package./deploy-helm.sh
- Run the script with parameters if you want to set your own values (be sure to replace the placeholders with your desired values):
cd helm-deployment-package./deploy-helm.sh [--service-account <service-account-to-be-created/updated>] [--role-name <role-to-be-created/updated>]
Verify installation
To check whether installation was successful
-
Check if the container is running.
After the installation, it may take couple of minutes until the container is up and running.
kubectl -n dynatrace get pods -
Check the container logs for errors or exceptions. You have two options:
-
For deployments of type 'metrics', run:
kubectl -n dynatrace logs -l app=dynatrace-gcp-monitor -c dynatrace-gcp-monitor-metrics -
For deployments of type 'logs', run:
kubectl -n dynatrace logs -l app=dynatrace-gcp-monitor -c dynatrace-gcp-monitor-logs -
For deployments of type 'all', run:
kubectl -n dynatrace logs -l app=dynatrace-gcp-monitor -c dynatrace-gcp-monitor-metricskubectl -n dynatrace logs -l app=dynatrace-gcp-monitor -c dynatrace-gcp-monitor-logs
-
Check if dashboards are imported (for deployments of type 'metrics' or 'all').
Go to
 Dashboards Classic and filter by Tag for Google Cloud. A number of dashboards for Google Cloud Services should be available.
View metrics and/or logs
After deploying the integration, depending on your deployment type, you can:
- See metrics from monitored services: go to Metrics.
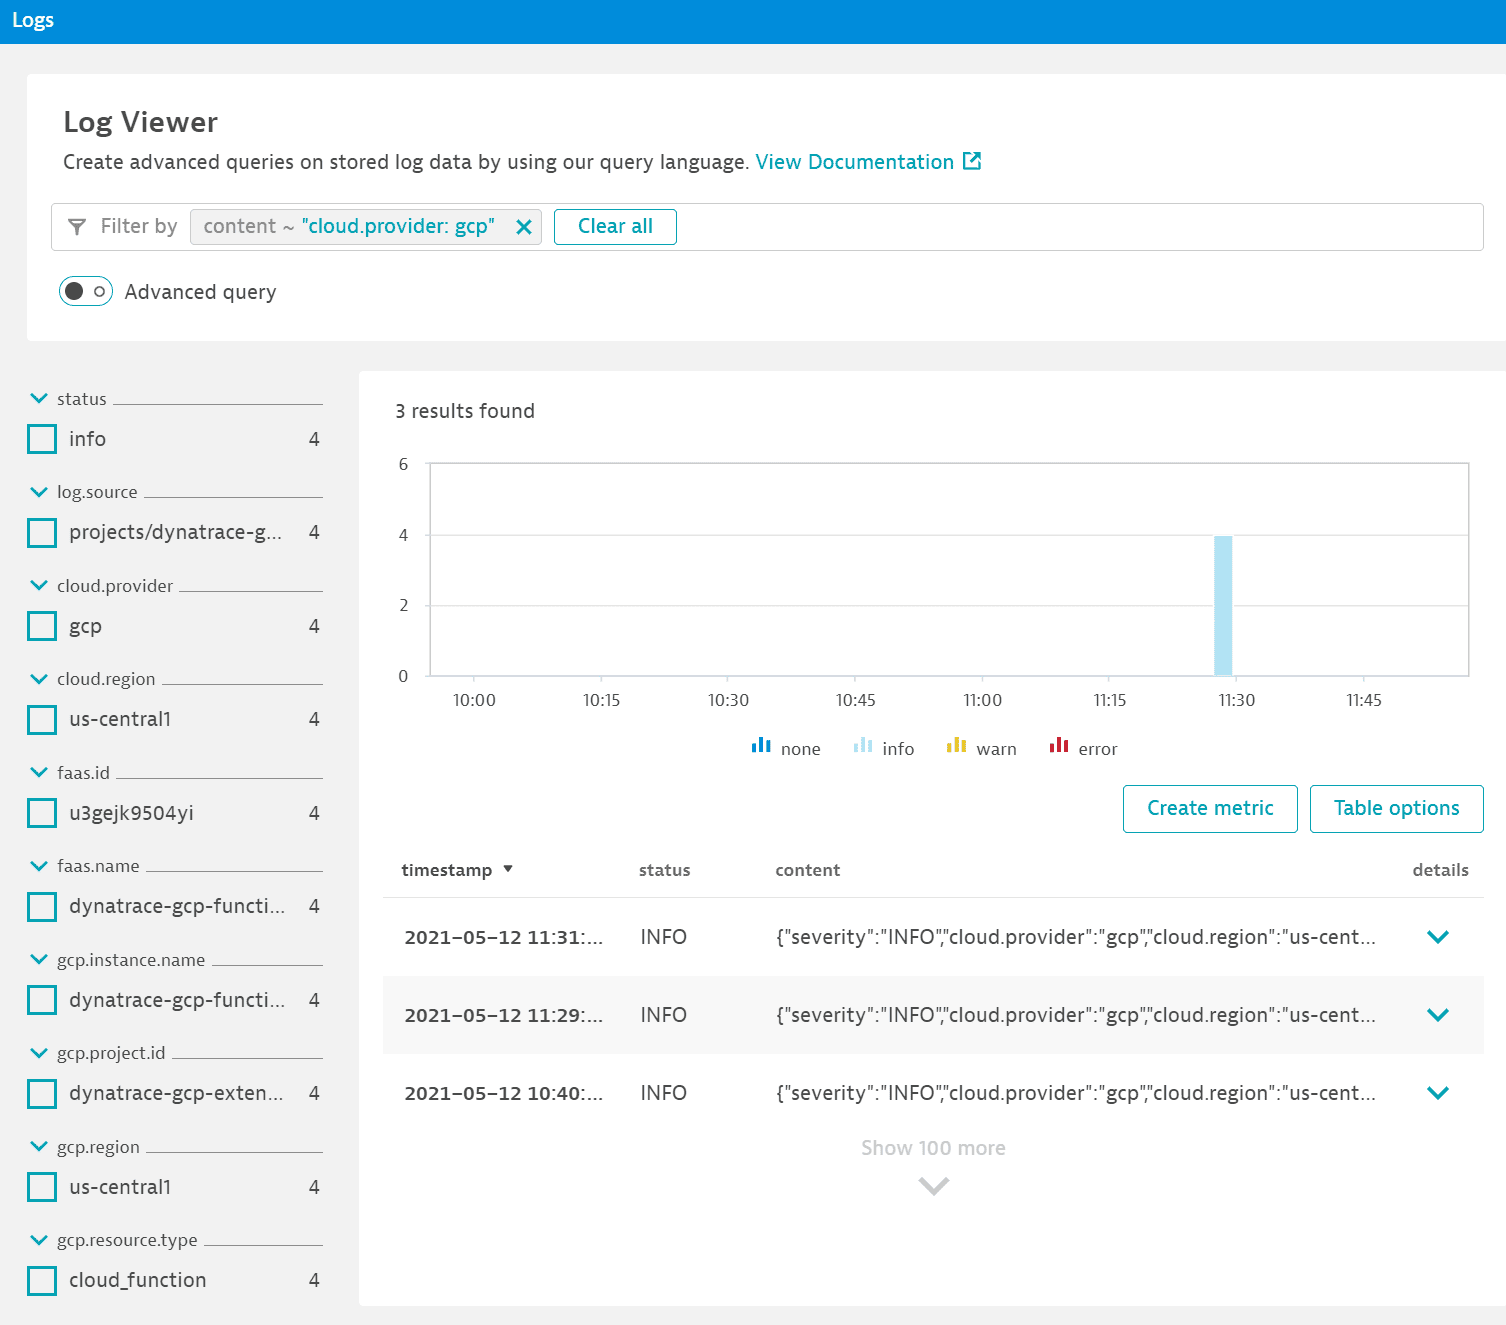
- View and analyze GCP logs: in Dynatrace, go to
 Logs & Events Classic and, to look for GCP logs, filter by
 cloud.provider: gcp.
Troubleshooting
To investigate potential deployment and connectivity issues, see Troubleshoot Google Cloud monitoring setup.