Extensions Creator
- Latest Dynatrace
- How-to guide
- 3-min read
With  Extensions Creator, you can create your own Dynatrace extensions to run SQL queries, query SNMP devices, ingest WMI, JMX, or Prometheus metrics.
Get started

Requirements
Permissions
The following table describes the required permissions.
Create and deploy an extension
Create a new extension
To create a new extension
-
Go to
Extensions Creator and select Create. -
Choose a datasource from the list and a name for your extension.
The name must start with
custom:and can only contain lowercase letters, numbers, and dashes. -
Select Add to create your extension.
Extensions Creator doesn't support Python datasource. This datasource requires a Python environment and the easiest way to create Python extensions is using the VSCode Extension with Python SDK.
Configure what data gets collected
The main extension interface consists of a table with a list of groups. Each group defines what data to collect and how to ingest it (metrics, dimensions, logs).
When you create a new extension, it contains one default group. Edit this group by selecting its row. The contents of the group appear below the table and depend on the datasource. For example, if you choose a datasource of SQL Oracle type, you can define the query to run, the frequency of the collection, and how to map the results to metrics and dimensions.
To add more groups, select Group.
You can configure deployment targets and credentials separately in  Extensions.
Deploy
When you deploy your extension, you add it to the Dynatrace environment. To deploy an extension, you need to sign it first. This is a security measure to ensure only trusted extensions are added to the environment.
Sign the extension
When your configuration is complete, select Deploy, and choose one of the options:
- I have a certificate: Upload your existing certificate and private key to sign the extension. Recommended for production extensions.
- I don't have a certificate: The app generates a self-signed certificate. Suitable for testing, but not recommended for production.
Deploy to the environment
Once you have selected or created a certificate, you can
- Select Sign and publish to deploy the extension to Dynatrace.
- Select Sign and download to deploy it later or share it, and then deploy via Extensions.
Only one version of an extension can be active at a time. Before redeploying a modified extension, increment the Version field.
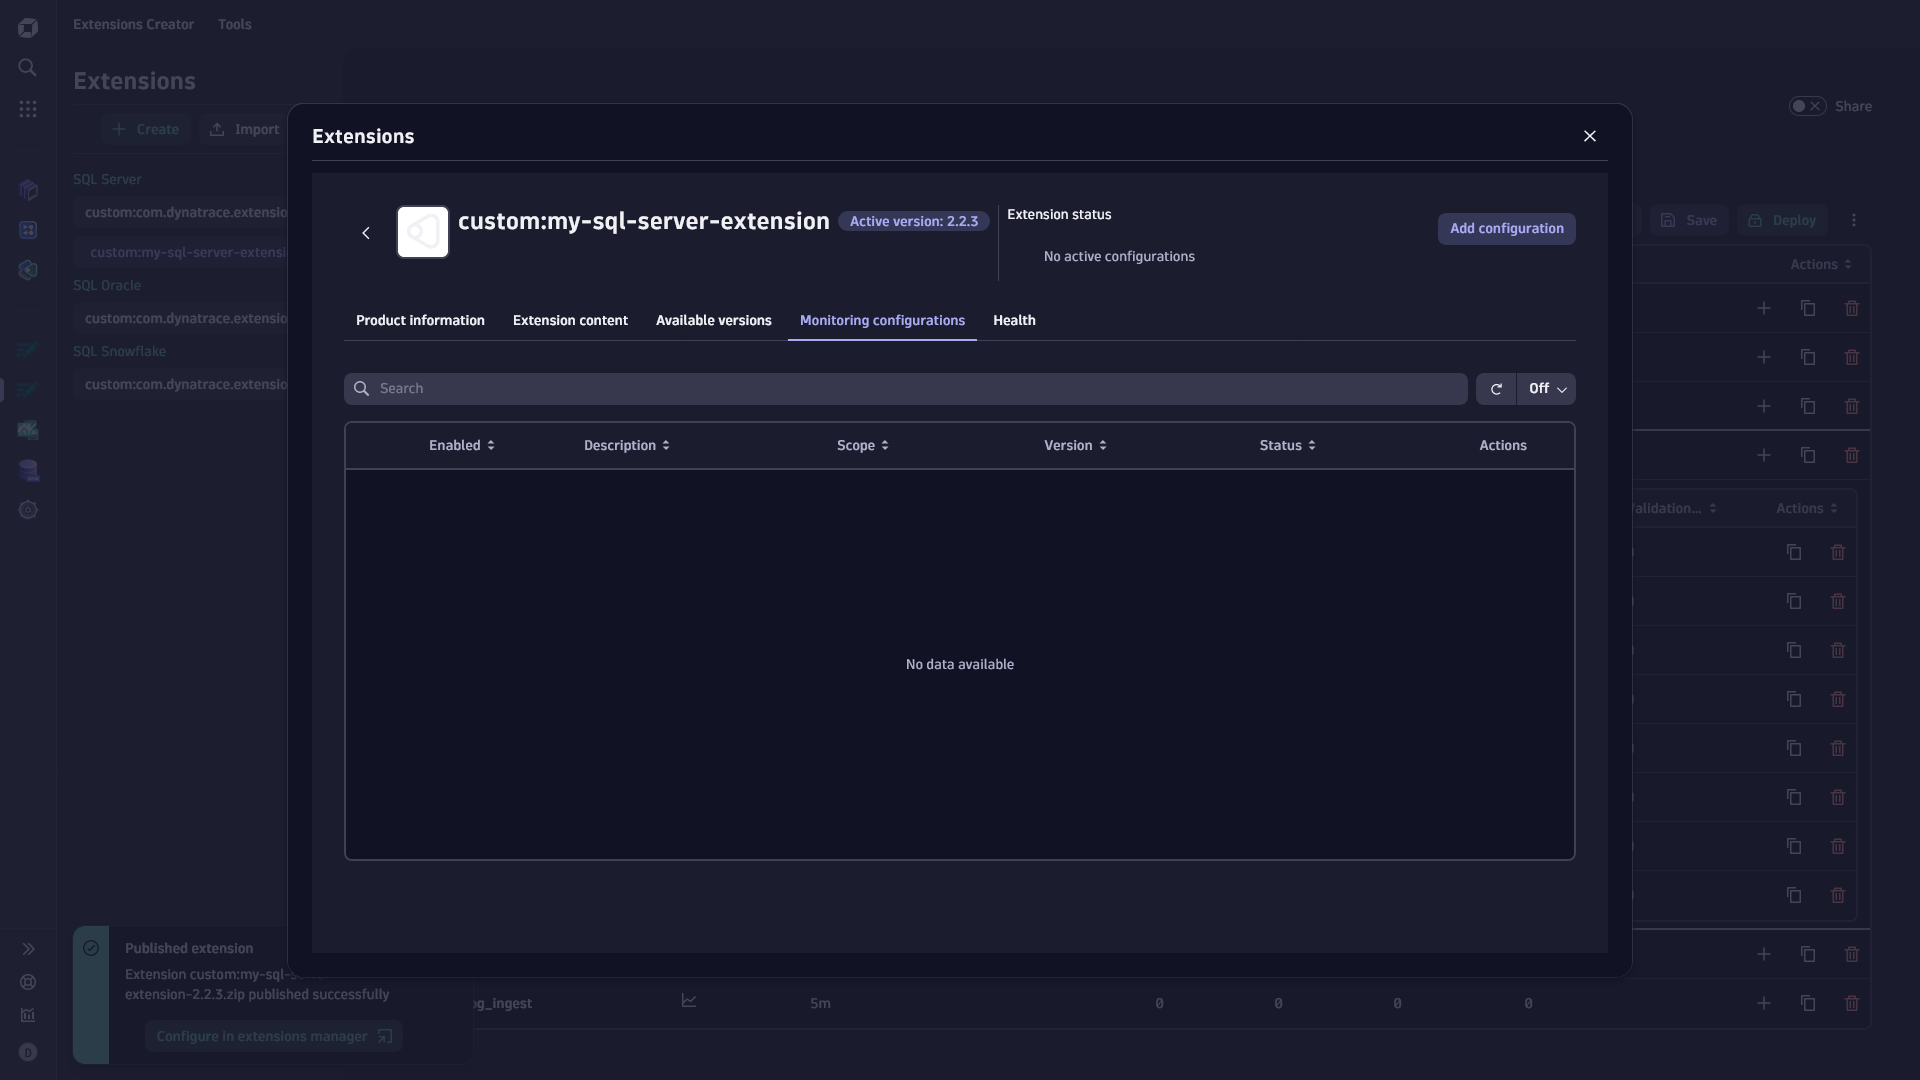
Monitor
Once deployed, use Extensions to manage monitoring configurations — deployment targets, credentials, and other configuration parameters.
To open the monitoring configuration, select Configure in Extensions Manager after deploying, or select Monitor from the extension card menu. You can also navigate directly to Extensions and find your extension in the list.
Share your extension
By default, extensions are private and editable only by the creator. To share with other users in your organization, turn on sharing using the Share toggle.
Manage ownership
Extensions in Extensions Creator are standard documents. To transfer ownership to another user, go to ![]() Settings, under General > Document management, and filter by
Settings, under General > Document management, and filter by Type = Extension YAML.
Import existing extensions
To edit an extension not created in the app (for example, an official Dynatrace extension), select Import. This lists all extensions currently deployed in your environment. Select to create an editable copy, which you can modify and redeploy under a different name.
You can also import an extension zip file by selecting Upload from file.
Edit the extension YAML
For features not exposed in the app interface, select Yaml to edit the extension.yaml file directly in a code editor with syntax highlighting and validation. For details, see the extension.yaml documentation.
JMX Browser
For JMX extensions, the JMX Browser lets you explore MBeans and attributes on your target system and add them to your extension configuration.
Select JMX Browser to see a list of processes monitored by OneAgent that expose JMX metrics. Select a process, then select a domain from the list to browse its MBeans. Select an MBean to view its attributes and add them as metrics or dimensions.
If an attribute is non-numeric, use an accessor to extract a numeric value from it, or collect it as a dimension instead. For example, to collect used heap memory from the HeapMemoryUsage attribute, use an accessor to extract the used property.
