Use OneAgent with OpenTelemetry data
- Latest Dynatrace
- How-to guide
- 3-min read
- Published Sep 30, 2025
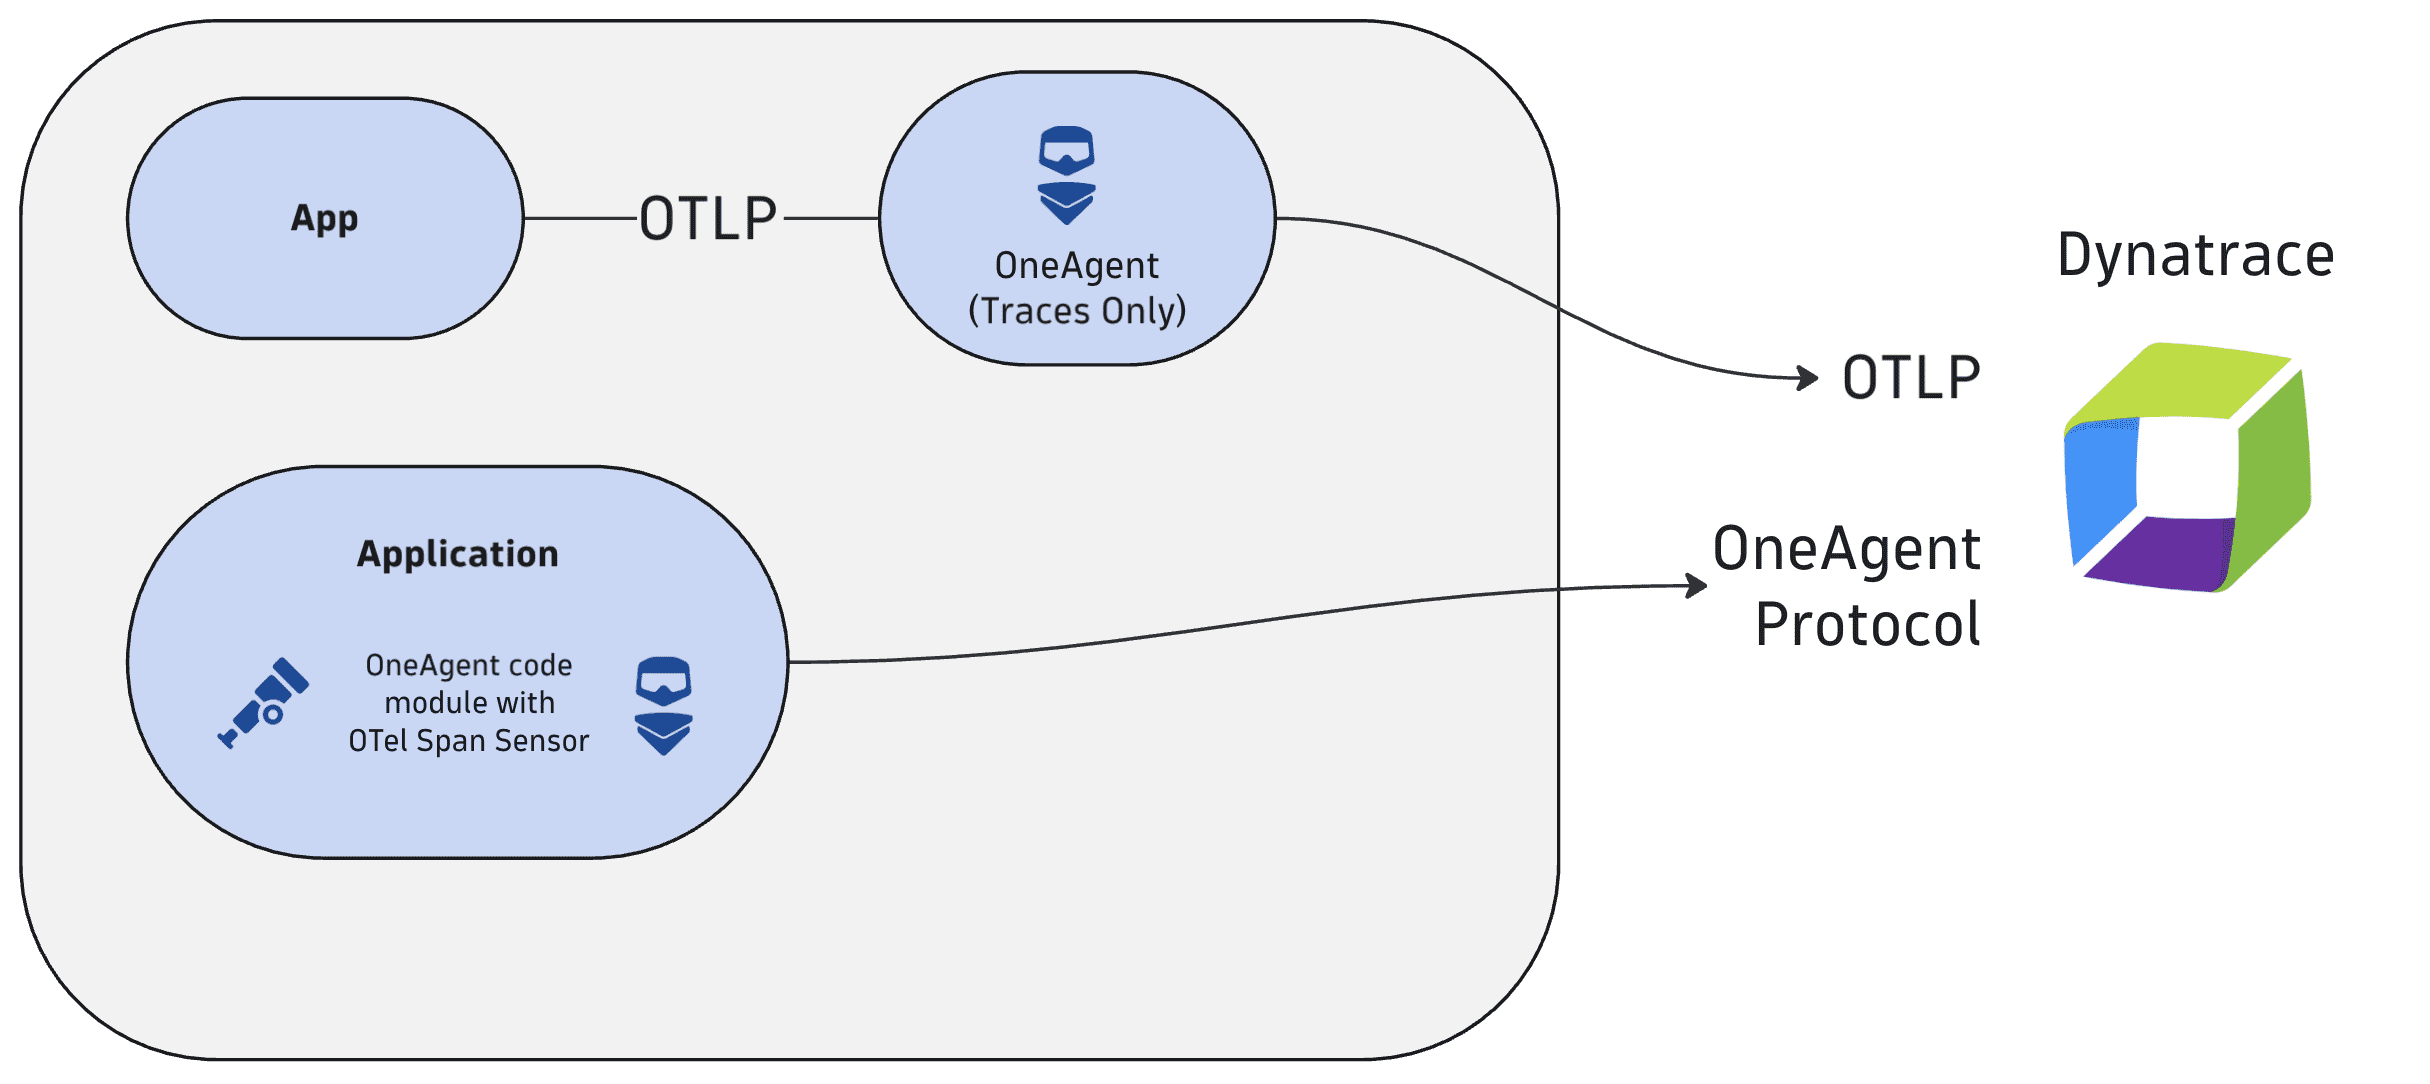
There are two ways to use OneAgent with OpenTelemetry:
- Send OpenTelemetry traces to the Dynatrace OTLP API endpoints.
- Detect OpenTelemetry spans from trace data, using the OneAgent code module's OpenTelemetry Span Sensor.
For most use cases, Dynatrace recommends exporting OTLP directly to Dynatrace without deploying a OneAgent.
Send OpenTelemetry traces to the OTLP endpoint exposed by OneAgent
Dynatrace OneAgent offers a local-only OTLP endpoint for traces. This is shown in the figure above, where the application uses the local-only OTLP endpoint.
- Local-only means OneAgent provides the endpoint exclusively at
127.0.0.1(localhost). - Traces-only means OneAgent only accepts tracing information, not metrics or logs.
OneAgent does not support content compression using the HTTP header Content-Encoding yet. Pay particular attention to that when instrumenting a Ruby application as the OpenTelemetry SDK for Ruby uses by default Content-Encoding: gzip.
If you need to use content compression, please export to SaaS, the Collector, or ActiveGate.
To send traces to OneAgent, you first need to enable the Extension Execution Controller. You can do this globally for the whole environment, for host groups, or only for specific hosts.
Enable at the environment level
- Go to Settings and select Preferences > Extension Execution Controller.
- Turn on Enable Extension Execution Controller.
- Turn on Enable local HTTP Metric, Log and Event Ingest API.
Enable for a host group
-
Go to
 Deployment Status > OneAgents.
 -
On the OneAgent deployment page, turn off Show new OneAgent deployments.
-
In the Filter by field, enter Host group, and then select the host group you want to configure from the dropdown list.
The host list is now filtered by the selected host group. Each listed host has a Host group:
<group name>link, where<group name>is the name of the host group that you want to configure.The Host group property is not displayed when the selected host doesn't belong to any host group.
-
Select the host group name in any row.
As you have filtered by host group, all displayed hosts go to the same host group.
- In the host group settings, select Extension Execution Controller.
- Turn on Enable Extension Execution Controller.
Enable for a single host
- Go to
 Hosts Classic.
 - Find and select your host to display the host overview page.
- In the upper-right corner of the host overview page, select More (…) > Settings.
- In the host settings, select Extension Execution Controller.
- Turn on Enable Extension Execution Controller.
With the EEC enabled, the OneAgent installations on the respective hosts will start accepting OTLP traces on URL http://localhost:14499/otlp/v1/traces.
OneAgent uses the TCP port 14499 as default port for this endpoint. You can change the port with oneagentctl.
The EEC ingestion endpoint is only available with Full-Stack and Infrastructure Monitoring deployments. It is not available with containerized setups. Please use ActiveGate as export endpoint for container applications.
Export details
Calls to these API endpoints need to adhere to the following protocol details:
- Use of HTTP—gRPC is not yet supported
- Use of the binary format of Protocol Buffers—JSON is not yet supported
- Does not support content compression using the
Content-Encodingheader
Authentication
Because it's a local-only endpoint, OneAgent does not require authentication.
Network requirements
-
Make sure there are no local restrictions for the used TCP port (default: 14499)
Because the OTLP communication is exclusively local, there should not be much network configuration to consider unless you have restricted local network communication, in which case you need to make sure there are no local restrictions on the used TCP port (default: 14499).
Detect OpenTelemetry spans using the OneAgent code module's OpenTelemetry Span Sensor
The OneAgent code module includes an OpenTelemetry Span Sensor which can create new spans based on OpenTelemetry API calls. This is shown in the figure above, where the code module (with the OpenTelemetry Span Sensor) sends data via the OpenTelemetry protocol.
Use this approach
- For services that are already instrumented by OneAgent automatically.
- To extend visibility into frameworks and libraries instrumented with OpenTelemetry.
- To customize the distributed traces.
This feature is for advanced users only, who want to create custom spans using OpenTelemetry API calls.
The feature described on this page provides the same functionality as the OneAgent SDK for span detection, but uses OpenTelemetry instead.
If you enable this feature while also exporting OTLP data, you will create duplicate spans.
OpenTelemetry span data can be captured for Java, Go, Node.js, PHP, and .NET, on all platforms supported by OneAgent. For setup and configuration of the OneAgent Span Sensor, see Enable the OpenTelemetry Span Sensor for OneAgent.
When the OneAgent OpenTelemetry Span Sensor is enabled, API calls like this example are automatically detected and included in the trace waterfall view. Since OneAgent captures these spans automatically, exporting them to an OTLP endpoint will create duplicate traces.
The following example shows what OneAgent would detect and stitch into the OneAgent trace without the complexity of manual propagation.
GET /calculate-price/ABC123 # OneAgent├── SELECT FROM products # OneAgent├── calculate-discount # OpenTelemetry│ ├── seasonal-rules # OpenTelemetry│ └── loyalty-calculation # OpenTelemetry└── INSERT INTO prices # OneAgent
These auto-instrumented spans are woven together with your manual OpenTelemetry spans into a single trace.
@RestControllerpublic class PricingController {private static final Tracer tracer = GlobalOpenTelemetry.getTracer("pricing-service");@GetMapping("/calculate-price/{productId}")public PriceResponse calculatePrice(@PathVariable String productId) {Product product = productRepository.findById(productId);Span calcSpan = tracer.spanBuilder("calculate-discount").setAttribute("product.category", product.getCategory()).startSpan();double discount;try (Scope scope = calcSpan.makeCurrent()) {discount = applySeasonalRules(product);discount += applyCustomerLoyalty(product);} finally {calcSpan.end();}return priceRepository.save(new PriceResponse(product, discount));}private double applySeasonalRules(Product product) {Span span = tracer.spanBuilder("seasonal-rules").setAttribute("season", "winter-sale").startSpan();try (Scope scope = span.makeCurrent()) {return calculateSeasonalDiscount();} finally {span.end();}}private double applyCustomerLoyalty(Product product) {Span span = tracer.spanBuilder("loyalty-calculation").startSpan();try (Scope scope = span.makeCurrent()) {return calculateLoyaltyDiscount();} finally {span.end();}}}