Monitor daily LLM cost burn rate using records-based custom alerts
- Latest Dynatrace
- Tutorial
- 3-min read
- Published May 28, 2026
Record-based custom alert monitors how many records match a specific condition within a defined timeframe. When any record goes outside your expected threshold,  Anomaly Detection creates an alert. This approach allows you to:
- Detect violations in time-aggregated data, such as burn rate or on the report level, within a given timeframe.
- Optimize resource allocation in a timely manner, based on a defined timeframe.
Scenario
Suppose your organization allocates a monthly LLM budget of $10,000 and wants to monitor daily burn rate to implement proactive cost controls. To achieve this, you can divide the monthly budget into a daily baseline (for example, around $300/day) and set alert thresholds to detect a cost drift early. In this scenario, you want to:
- Collect the record with aggregated input and output token usage data from the whole day.
- Set an alerting condition to be a range of $400–$450 that will send you a warning if any records containing a total cost that falls within that range.
Who is this for?
This guide is written for anyone who:
- Is responsible for budget tracking and resource allocation
- Wants to monitor and alert on SLO burn rate
What will you learn?
In this tutorial, you'll learn how to:
- Configure a records-based custom alert
- Choose an alert identity field
- Monitor aggregated data using records and complex DQL
Before you begin
Prerequisites
- Dynatrace SaaS environment powered by Grail and AppEngine.
Prior knowledge
Set up a custom alert for LLM burn rate monitoring
1. Create a custom alert
- Go to Anomaly Detection.
- Select
 New alert > Create your own custom alert to create a new alert.
 - Go to the Advanced tab and expand Set scope.
2. Configure a records-based custom alert
-
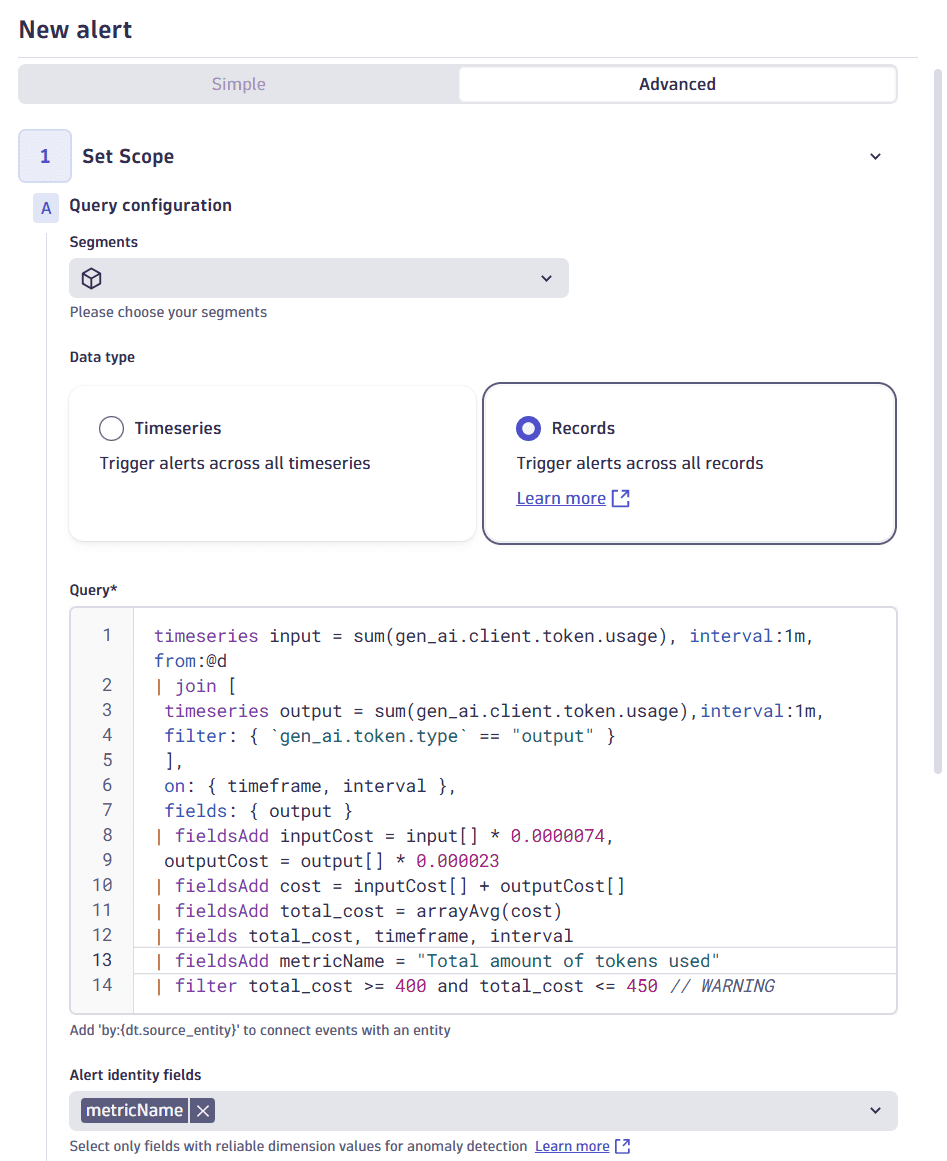
In Data type, choose Records.
-
In Query, provide the DQL query to fetch and filter your data. Here's an example of a query that creates a
total_costalerting condition from400to450and detects any records from the whole day (from:@d) withtotal_costvalue matching the condition.timeseries input = sum(gen_ai.client.token.usage), interval:1m, from:@d| join [timeseries output = sum(gen_ai.client.token.usage),interval:1m,filter: { `gen_ai.token.type` == "output" }],on: { timeframe, interval },fields: { output }| fieldsAdd inputCost = input[] * 0.0000074,outputCost = output[] * 0.000023| fieldsAdd cost = inputCost[] + outputCost[]| fieldsAdd total_cost = arrayAvg(cost)| fields total_cost, timeframe, interval| fieldsAdd metricName = "Total amount of tokens used"| filter total_cost >= 400 and total_cost <= 450 // WARNINGfrom:@dallows you to track data from the beginning of the day to its end. If you don't specify afromparameter, the default of 2 hours is used. To learn more, see Anomaly detection configuration. -
In Alert identity fields, choose the
metricNamefield.Choosing correct alert identity fieldsTo ensure that your custom alert works as intended, you need to choose only the stable fields that create a unique alert instance.
In this example, your query outputs four fields:
total_cost,timeframe,interval, andmetricName.-
Choose
metricName: this is a stable dimension with a constant string value that stays the same over time and across all alerts.- If you choose
metricNameas the alert identifier, Anomaly Detection creates one alert for a metricNamewith valueTotal amount of tokens used, regardless of changes intotal_costvalue. This ensures that any updates regarding the threshold violation are kept inside a single alert, providing clear insights into the event.
- If you choose
-
Don't choose
total_cost: this is a typical volatile dimension, a numeric value field that changes over time. For example,total_costcan increase from410to425within an hour depending on the LLM token usage.- If you choose this field as the alert identifier, Anomaly Detection creates a new alert after each change in cost value, which can result in duplicate and false alerts.
- If you choose this field as the alert identifier,
For more examples of choosing a proper alert identity field, see Anomaly detection configuration.
-
An example of configured records-based alert scope and query
3. Configure an event template using additional fields
You can use both volatile and stable fields to enrich your event description and get a better insight.
-
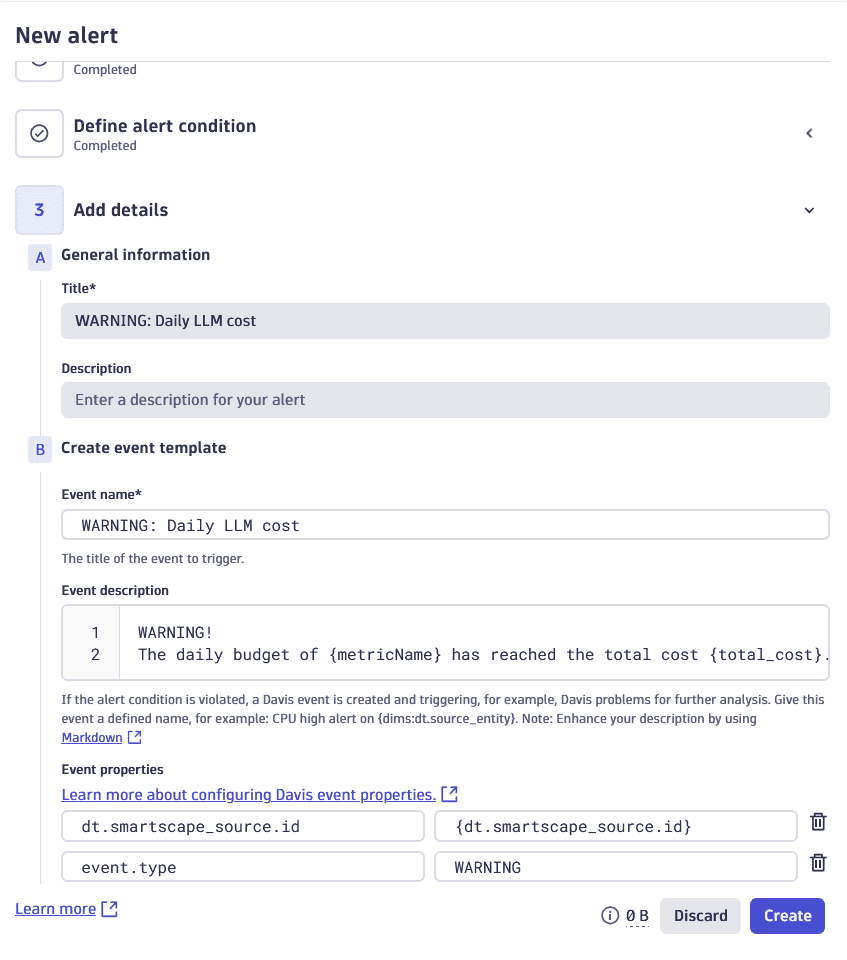
Set Title to
WARNING: Daily LLM cost. -
Set Event name to
WARNING: Daily LLM cost. -
Set Event description to the following:
WARNING!The daily budget of {metricName} has reached the total cost {total_cost}. -
Provide the Event properties:
-
Set
dt.smartscape_source.idvalue to{dt.smartscape_source.id}. -
Set
event.typevalue toWARNING.The
WARNINGevent type doesn't open a problem, but can be used in dashboards and sent as a Slack message. If you want Anomaly Detection to open a problem after a threshold violation:- Change the last query line to:
| filter total_cost >= 450 // CRITICAL. - Set
event.typevalue toCUSTOM_ALERT.
- Change the last query line to:
-
An example of a configured warning event template
Conclusion
You have created a custom alert that captures input and output token usage on a daily basis and tracks data from the whole day. If any matching records are found, you receive a WARNING alert, which allows you to implement proactive cost controls, such as result caching, cheaper model variants, or prompt optimization.
Going forward, you can adapt and edit the query to divide and monitor incoming data at different granularities—user, feature, model—so you can get insight into which of them drive spending.
Anomaly Detection