Metrics API v2 - Best practices
- Reference
This page summarizes best practices for configuring and revising your metrics.
Think about the dimensions you need
Every metric supports dimensions to enrich your metric with context, such as where the metric was measured. These dimensions can then be filtered and aggregated at query time.
You can see your dimensions when using the metric ingestion protocol.
What's a dimension tuple?
A combination of dimensions is called a dimension tuple.
Example dimension tuples
The following example creates a metric with two dimensions, host.name and owner.
cpu.temperature, host.name="Alice's PC", owner="Alice" gauge,50 1699625420cpu.temperature, host.name="Alice's Raspberry Pi", owner="Alice" gauge,40 1699625420cpu.temperature, host.name="Bob's PC", owner="Bob" gauge,60 1699625420
The data above creates the following dimension tuples.
(host.name="Alice's PC", owner="Alice")(host.name="Alice's Raspberry Pi", owner="Alice")(host.name="Bob's PC", owner="Bob")
Avoid volatile dimensions
Choosing the right dimensions for your metric is essential to getting the most out of Dynatrace. Volatile dimensions can produce unintended results, increase costs, and slow query performance.
What's a volatile dimension?
Short-lived IDs and timestamps are volatile dimensions. If your dimension value is a UUID, epoch timestamp, or numerical value, consider whether it's truly necessary for your use case.
Example volatile dimension
The following example is a common misconfiguration using syntax from the metric ingestion protocol:
cpu.temperature, host.name="Alice's PC", measured_at="1699625420" gauge,50 1699625420cpu.temperature, host.name="Alice's PC", measured_at="1699625421" gauge,50 1699625421cpu.temperature, host.name="Alice's PC", measured_at="1699625422" gauge,49 1699625422cpu.temperature, host.name="Alice's PC", measured_at="1699625423" gauge,49 1699625423
The dimension measured_at uses an epoch timestamp to track when the data was measured.
- This is unnecessary, as the timestamp is already provided;
measured_atonly duplicates it. - Since it creates a new dimension tuple with every new data point, it will reach the cardinality limits after 1 million seconds online—just 11 days.
Avoid high-cardinality limits
To mitigate the negative effects of volatile dimensions, Dynatrace enforces cardinality limits.
What's a cardinality limit?
A cardinality limit is a limit to the number of dimension tuples you can ingest.
In Dynatrace, classic metrics have multiple dimension tuple limits:
Limit
Value
Note
Built-in metric pool dimension limit
20 million
(This was increased from 10 million in Dynatrace version 1.277+.)
All built-in metrics share the same dimension tuple space.
Custom metric pool dimension limit
50 million
All custom metrics share a dimension tuple space (for example, Prometheus metrics).
Per-metric dimension limit
1 million
Each metric has its own dimension tuples limit. This applies to all metrics.
The limits are applied against the dimension tuples of the last 30 days (a 30-day sliding window). If a limit is reached, data points having new and as yet unseen dimension tuples are rejected. The limits apply to the tenant.
Identify high-cardinality situations
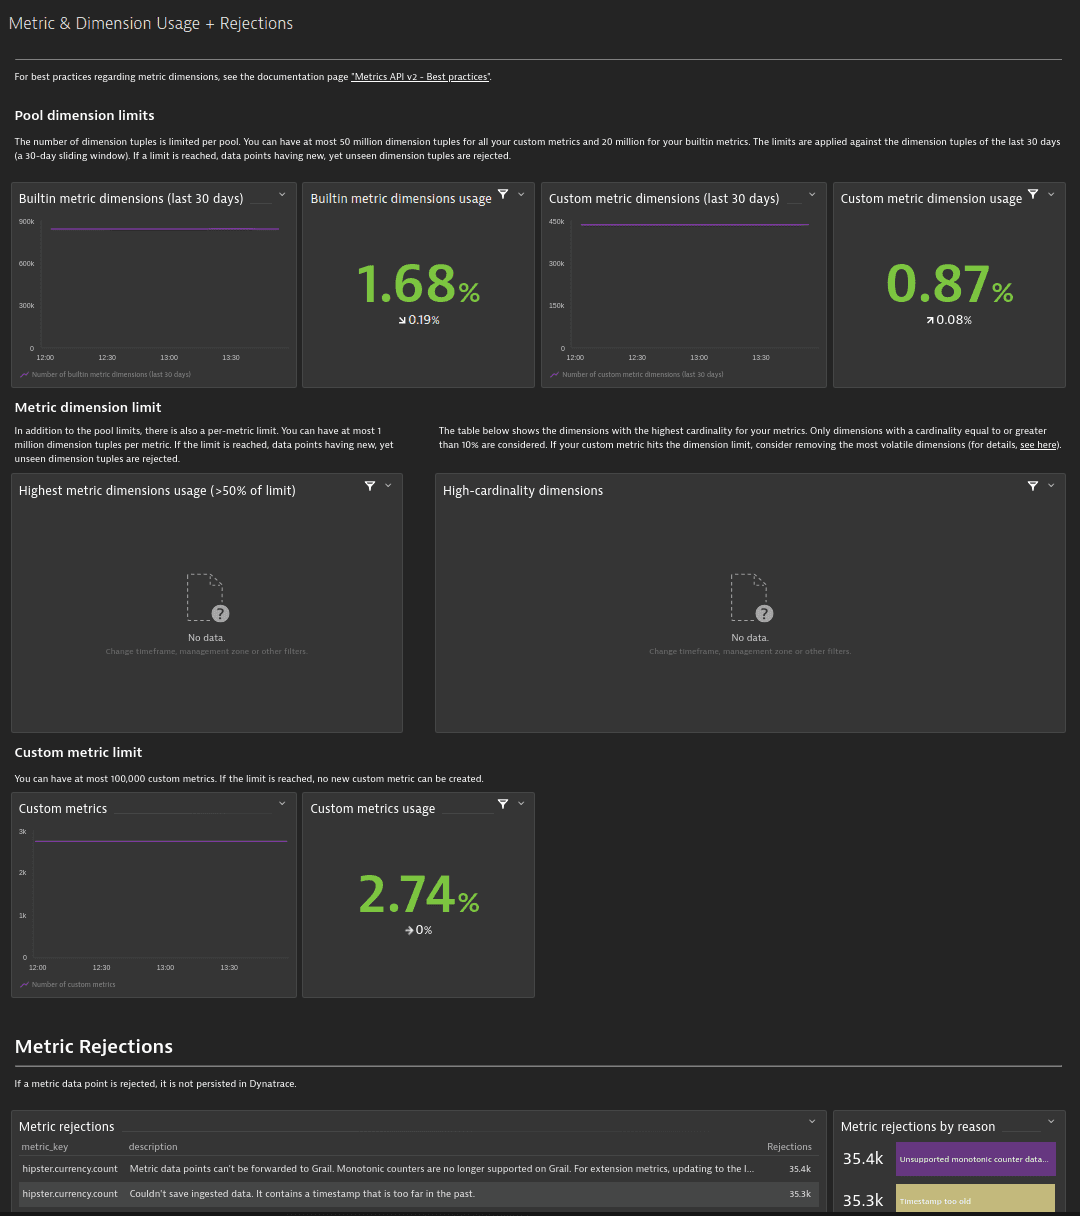
Dynatrace provides self-monitoring metrics to get insights into the current dimension tuple space usage. These metrics are charted on the Metric & Dimension Usage + Rejections preset dashboard.
In the example below, note the following tiles:
-
Custom metric dimensions usage (
0.87%)This is about 435,000 custom metric dimension tuples in the last 30 days, as the custom metric dimension tuple limit is 50 million.
-
Builtin metric dimensions usage (
1.68%)Built-in metrics are limited to 20 million tuples, so 1.68% reveals that there are about 336,000 dimension tuples.
-
Highest metric dimensions usage (no data in the example)
This tile displays individual metrics with more than 50% of the single metric limit.
-
High-cardinality dimensions (no data in the example)
This tile displays a table of dimensions with the highest cardinality for your metrics in the last 30 days. Only dimensions with a cardinality equal to or greater than 10% of the limit are included. If your custom metric reaches the dimension limit, consider removing or optimizing the most volatile dimensions.

Investigate high-cardinality metrics
If you're close to reaching cardinality limits
-
Check if the amount of data ingested is plausible.
Is a test environment cronjob or another resource overloading the ingest? Perhaps the root cause is a long-running resource that was never turned off.
-
Analyze which metrics are being rejected.
Is the metric still relevant, and does its dimensionality fit its use cases?
-
Consider the relative importance of the parts of your environment.
You know your environment best. Not all parts of the environment are equally important. Again, does the metric's dimensionality fit its use cases?