Application anomaly detection API - PUT configuration
- Reference
- Published Jan 23, 2019
Updates the configuration of anomaly detection for applications.
The request consumes an application/json payload.
| PUT | SaaS | https://{your-environment-id}.live.dynatrace.com/api/config/v1/anomalyDetection/applications |
| PUT | Environment ActiveGate | https://{your-activegate-domain}:9999/e/{your-environment-id}/api/config/v1/anomalyDetection/applications |
Authentication
To execute this request, you need an access token with WriteConfig scope.
To learn how to obtain and use it, see Tokens and authentication.
Parameters
| Parameter | Type | Description | In | Required |
|---|---|---|---|---|
| body | Application | The JSON body of the request, containing parameters of the application anomaly detection configuration. | body | Optional |
Request body objects
The ApplicationAnomalyDetectionConfig object
The configuration of anomaly detection for applications.
| Element | Type | Description | Required |
|---|---|---|---|
| failureRateIncrease | Failure | Configuration of failure rate increase detection. | Required |
| metadata | Configuration | Metadata useful for debugging | Optional |
| responseTimeDegradation | Response | Configuration of response time degradation detection. | Required |
| trafficDrop | Traffic | The configuration of traffic drops detection. | Required |
| trafficSpike | Traffic | The configuration of traffic spikes detection. | Required |
The FailureRateIncreaseDetectionConfig object
Configuration of failure rate increase detection.
| Element | Type | Description | Required |
|---|---|---|---|
| automaticDetection | Failure | Parameters of failure rate increase auto-detection. Required if detectionMode is The absolute and relative thresholds both must exceed to trigger an alert. Example: If the expected error rate is 1.5%, and you set an absolute increase of 1%, and a relative increase of 50%, the thresholds will be: Absolute: 1.5% + 1% = 2.5% Relative: 1.5% + 1.5% * 50% = 2.25% | Optional |
| detectionMode | string | How to detect failure rate increase: automatically, or based on fixed thresholds, or do not detect. The element can hold these values
| Required |
| thresholds | Failure | Fixed thresholds for failure rate increase detection. Required if detectionMode is | Optional |
The FailureRateIncreaseAutodetectionConfig object
Parameters of failure rate increase auto-detection. Required if detectionMode is DETECT_AUTOMATICALLY. Not applicable otherwise.
The absolute and relative thresholds both must exceed to trigger an alert.
Example: If the expected error rate is 1.5%, and you set an absolute increase of 1%, and a relative increase of 50%, the thresholds will be: Absolute: 1.5% + 1% = 2.5% Relative: 1.5% + 1.5% * 50% = 2.25%
| Element | Type | Description | Required |
|---|---|---|---|
| failingServiceCallPercentageIncreaseAbsolute | integer | Absolute increase of failing service calls to trigger an alert, %. | Required |
| failingServiceCallPercentageIncreaseRelative | integer | Relative increase of failing service calls to trigger an alert, %. | Required |
The FailureRateIncreaseThresholdConfig object
Fixed thresholds for failure rate increase detection.
Required if detectionMode is DETECT_USING_FIXED_THRESHOLDS. Not applicable otherwise.
| Element | Type | Description | Required |
|---|---|---|---|
| sensitivity | string | Sensitivity of the threshold. With With The element can hold these values
| Required |
| threshold | integer | Failure rate during any 5-minute period to trigger an alert, %. | Required |
The ConfigurationMetadata object
Metadata useful for debugging
| Element | Type | Description | Required |
|---|---|---|---|
| clusterVersion | string | Dynatrace version. | Optional |
| configurationVersions | integer[] | A sorted list of the version numbers of the configuration. | Optional |
| currentConfigurationVersions | string[] | A sorted list of version numbers of the configuration. | Optional |
The ResponseTimeDegradationDetectionConfig object
Configuration of response time degradation detection.
| Element | Type | Description | Required |
|---|---|---|---|
| automaticDetection | Response | Parameters of the response time degradation auto-detection. Required if the detectionMode is Violation of any criterion triggers an alert. | Optional |
| detectionMode | string | How to detect response time degradation: automatically, or based on fixed thresholds, or do not detect. The element can hold these values
| Required |
| thresholds | Response | Fixed thresholds for response time degradation detection. Required if detectionMode is | Optional |
The ResponseTimeDegradationAutodetectionConfig object
Parameters of the response time degradation auto-detection. Required if the detectionMode is DETECT_AUTOMATICALLY. Not applicable otherwise.
Violation of any criterion triggers an alert.
| Element | Type | Description | Required |
|---|---|---|---|
| loadThreshold | string | Minimal service load to detect response time degradation. Response time degradation of services with smaller load won't trigger alerts. The element can hold these values
| Required |
| responseTimeDegradationMilliseconds | integer | Alert if the response time degrades beyond X milliseconds. | Required |
| responseTimeDegradationPercent | integer | Alert if the response time degrades beyond X %. | Required |
| slowestResponseTimeDegradationMilliseconds | integer | Alert if the response time of the slowest 10% degrades beyond X milliseconds. | Required |
| slowestResponseTimeDegradationPercent | integer | Alert if the response time of the slowest 10% degrades beyond X %. | Required |
The ResponseTimeDegradationThresholdConfig object
Fixed thresholds for response time degradation detection.
Required if detectionMode is DETECT_USING_FIXED_THRESHOLDS. Not applicable otherwise.
| Element | Type | Description | Required |
|---|---|---|---|
| loadThreshold | string | Minimal service load to detect response time degradation. Response time degradation of services with smaller load won't trigger alerts. The element can hold these values
| Required |
| responseTimeThresholdMilliseconds | integer | Response time during any 5-minute period to trigger an alert, in milliseconds. | Required |
| sensitivity | string | Sensitivity of the threshold. With With The element can hold these values
| Required |
| slowestResponseTimeThresholdMilliseconds | integer | Response time of the 10% slowest during any 5-minute period to trigger an alert, in milliseconds. | Required |
The TrafficDropDetectionConfig object
The configuration of traffic drops detection.
| Element | Type | Description | Required |
|---|---|---|---|
| enabled | boolean | The detection is enabled ( | Required |
| trafficDropPercent | integer | Alert if the observed traffic is less than X % of the expected value. | Optional |
The TrafficSpikeDetectionConfig object
The configuration of traffic spikes detection.
| Element | Type | Description | Required |
|---|---|---|---|
| enabled | boolean | The detection is enabled ( | Required |
| trafficSpikePercent | integer | Alert if the observed traffic is more than X % of the expected value. | Optional |
Request body JSON model
This is a model of the request body, showing the possible elements. It has to be adjusted for usage in an actual request.
{"failureRateIncrease": {"detectionMode": "DETECT_USING_FIXED_THRESHOLDS","thresholds": {"sensitivity": "LOW","threshold": 10}},"responseTimeDegradation": {"automaticDetection": {"loadThreshold": "ONE_REQUEST_PER_MINUTE","responseTimeDegradationMilliseconds": 250,"responseTimeDegradationPercent": 90,"slowestResponseTimeDegradationMilliseconds": 500,"slowestResponseTimeDegradationPercent": 200},"detectionMode": "DETECT_AUTOMATICALLY"},"trafficDrop": {"enabled": true,"trafficDropPercent": 95},"trafficSpike": {"enabled": false}}
Response
Response codes
| Code | Type | Description |
|---|---|---|
| 204 | - | Success. Configuration has been updated. Response doesn't have a body. |
| 400 | Error | Failed. The input is invalid |
Response body objects
The ErrorEnvelope object
| Element | Type | Description |
|---|---|---|
| error | Error | - |
The Error object
| Element | Type | Description |
|---|---|---|
| code | integer | The HTTP status code |
| constraintViolations | Constraint | A list of constraint violations |
| message | string | The error message |
The ConstraintViolation object
A list of constraint violations
| Element | Type | Description |
|---|---|---|
| location | string | - |
| message | string | - |
| parameterLocation | string | -The element can hold these values
|
| path | string | - |
Response body JSON models
{"error": {"code": 1,"constraintViolations": [{"location": "string","message": "string","parameterLocation": "HEADER","path": "string"}],"message": "string"}}
Validate payload
We recommend that you validate the payload before submitting it with an actual request. A response code of 204 indicates a valid payload.
The request consumes an application/json payload.
| POST | SaaS | https://{your-environment-id}.live.dynatrace.com/api/config/v1/anomalyDetection/applications/validator |
| POST | Environment ActiveGate | https://{your-activegate-domain}:9999/e/{your-environment-id}/api/config/v1/anomalyDetection/applications/validator |
Authentication
To execute this request, you need an access token with WriteConfig scope.
To learn how to obtain and use it, see Tokens and authentication.
Response
Response codes
| Code | Type | Description |
|---|---|---|
| 204 | - | Validated. The submitted configuration is valid. Response does not have a body. |
| 400 | Error | Failed. The input is invalid |
Response body objects
The ErrorEnvelope object
| Element | Type | Description |
|---|---|---|
| error | Error | - |
The Error object
| Element | Type | Description |
|---|---|---|
| code | integer | The HTTP status code |
| constraintViolations | Constraint | A list of constraint violations |
| message | string | The error message |
The ConstraintViolation object
A list of constraint violations
| Element | Type | Description |
|---|---|---|
| location | string | - |
| message | string | - |
| parameterLocation | string | -The element can hold these values
|
| path | string | - |
Response body JSON models
{"error": {"code": 1,"constraintViolations": [{"location": "string","message": "string","parameterLocation": "HEADER","path": "string"}],"message": "string"}}
Example
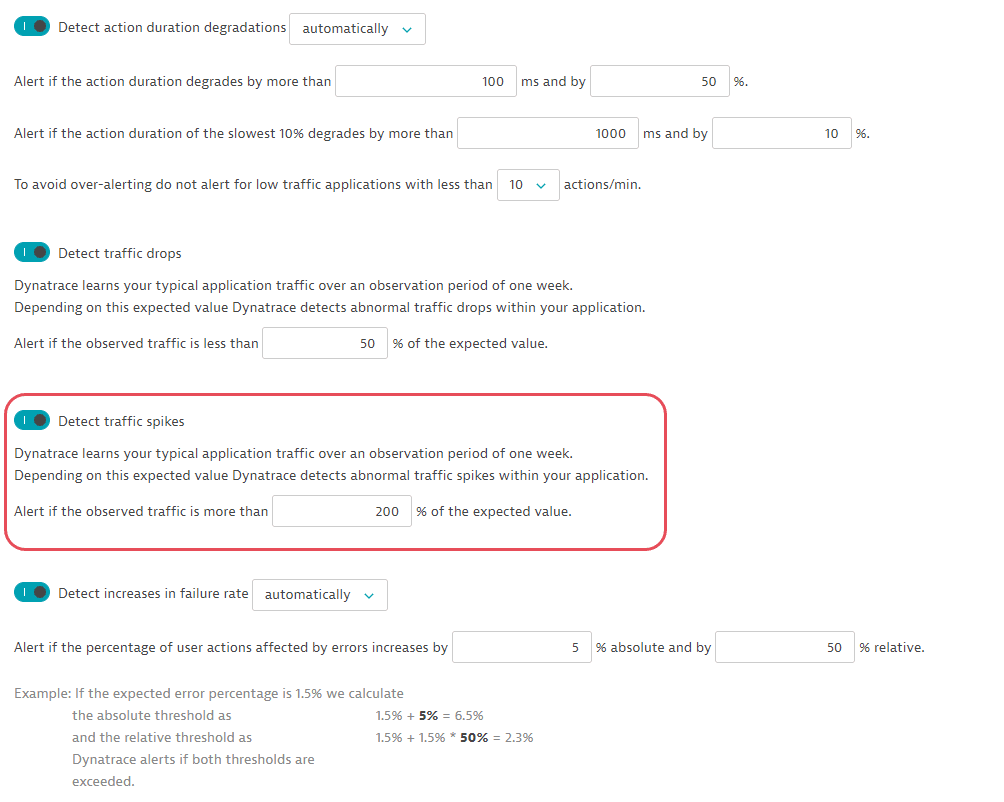
In this example, the request updates the configuration of anomaly detection for applications from the GET request example. It activates traffic spikes detection and sets the threshold of 200%.
The API token is passed in the Authorization header.
You can download or copy the example request body to try it out on your own. Be sure to create a backup copy of your current configuration with the GET application anomaly detection configuration call.
Curl
curl -X PUT \https://mySampleEnv.live.dynatrace.com/api/config/v1/anomalyDetection/applications \-H 'Authorization: Api-Token dt0c01.abc123.abcdefjhij1234567890' \-H 'Content-Type: application/json' \-d '{"responseTimeDegradation": {"detectionMode": "DETECT_AUTOMATICALLY","automaticDetection": {"responseTimeDegradationMilliseconds": 100,"responseTimeDegradationPercent": 50,"slowestResponseTimeDegradationMilliseconds": 1000,"slowestResponseTimeDegradationPercent": 10,"loadThreshold": "TEN_REQUESTS_PER_MINUTE"}},"trafficDrop": {"enabled": true,"trafficDropPercent": 50},"trafficSpike": {"enabled": true,"trafficSpikePercent": 200},"failureRateIncrease": {"detectionMode": "DETECT_AUTOMATICALLY","automaticDetection": {"failingServiceCallPercentageIncreaseAbsolute": 5,"failingServiceCallPercentageIncreaseRelative": 50}}}'
Request URL
https://mySampleEnv.live.dynatrace.com/api/config/v1/anomalyDetection/applications
Request body
{"responseTimeDegradation": {"detectionMode": "DETECT_AUTOMATICALLY","automaticDetection": {"responseTimeDegradationMilliseconds": 100,"responseTimeDegradationPercent": 50,"slowestResponseTimeDegradationMilliseconds": 1000,"slowestResponseTimeDegradationPercent": 10,"loadThreshold": "TEN_REQUESTS_PER_MINUTE"}},"trafficDrop": {"enabled": true,"trafficDropPercent": 50},"trafficSpike": {"enabled": true,"trafficSpikePercent": 200},"failureRateIncrease": {"detectionMode": "DETECT_AUTOMATICALLY","automaticDetection": {"failingServiceCallPercentageIncreaseAbsolute": 5,"failingServiceCallPercentageIncreaseRelative": 50}}}
Response code
204
Result
The updated configuration has the following parameters: