Optimize engineering flow metrics using Jira data
- Latest Dynatrace
- Tutorial
- 7-min read
- Published Oct 21, 2025
- Preview
In this tutorial, you set up the integration between Jira and Dynatrace to ingest a daily snapshot of your Jira epics into Dynatrace. You analyze your value delivery system from the highest point of view. By default, these are epics in Jira. We provide you with a dashboard that you populate with your Jira data, enabling you to optimize your engineering flow by making data-driven decisions that improve focus, predictability, and value delivery lead times. To see this dashboard on Playground, go to Engineering Flow Metrics dashboard on Playground site.
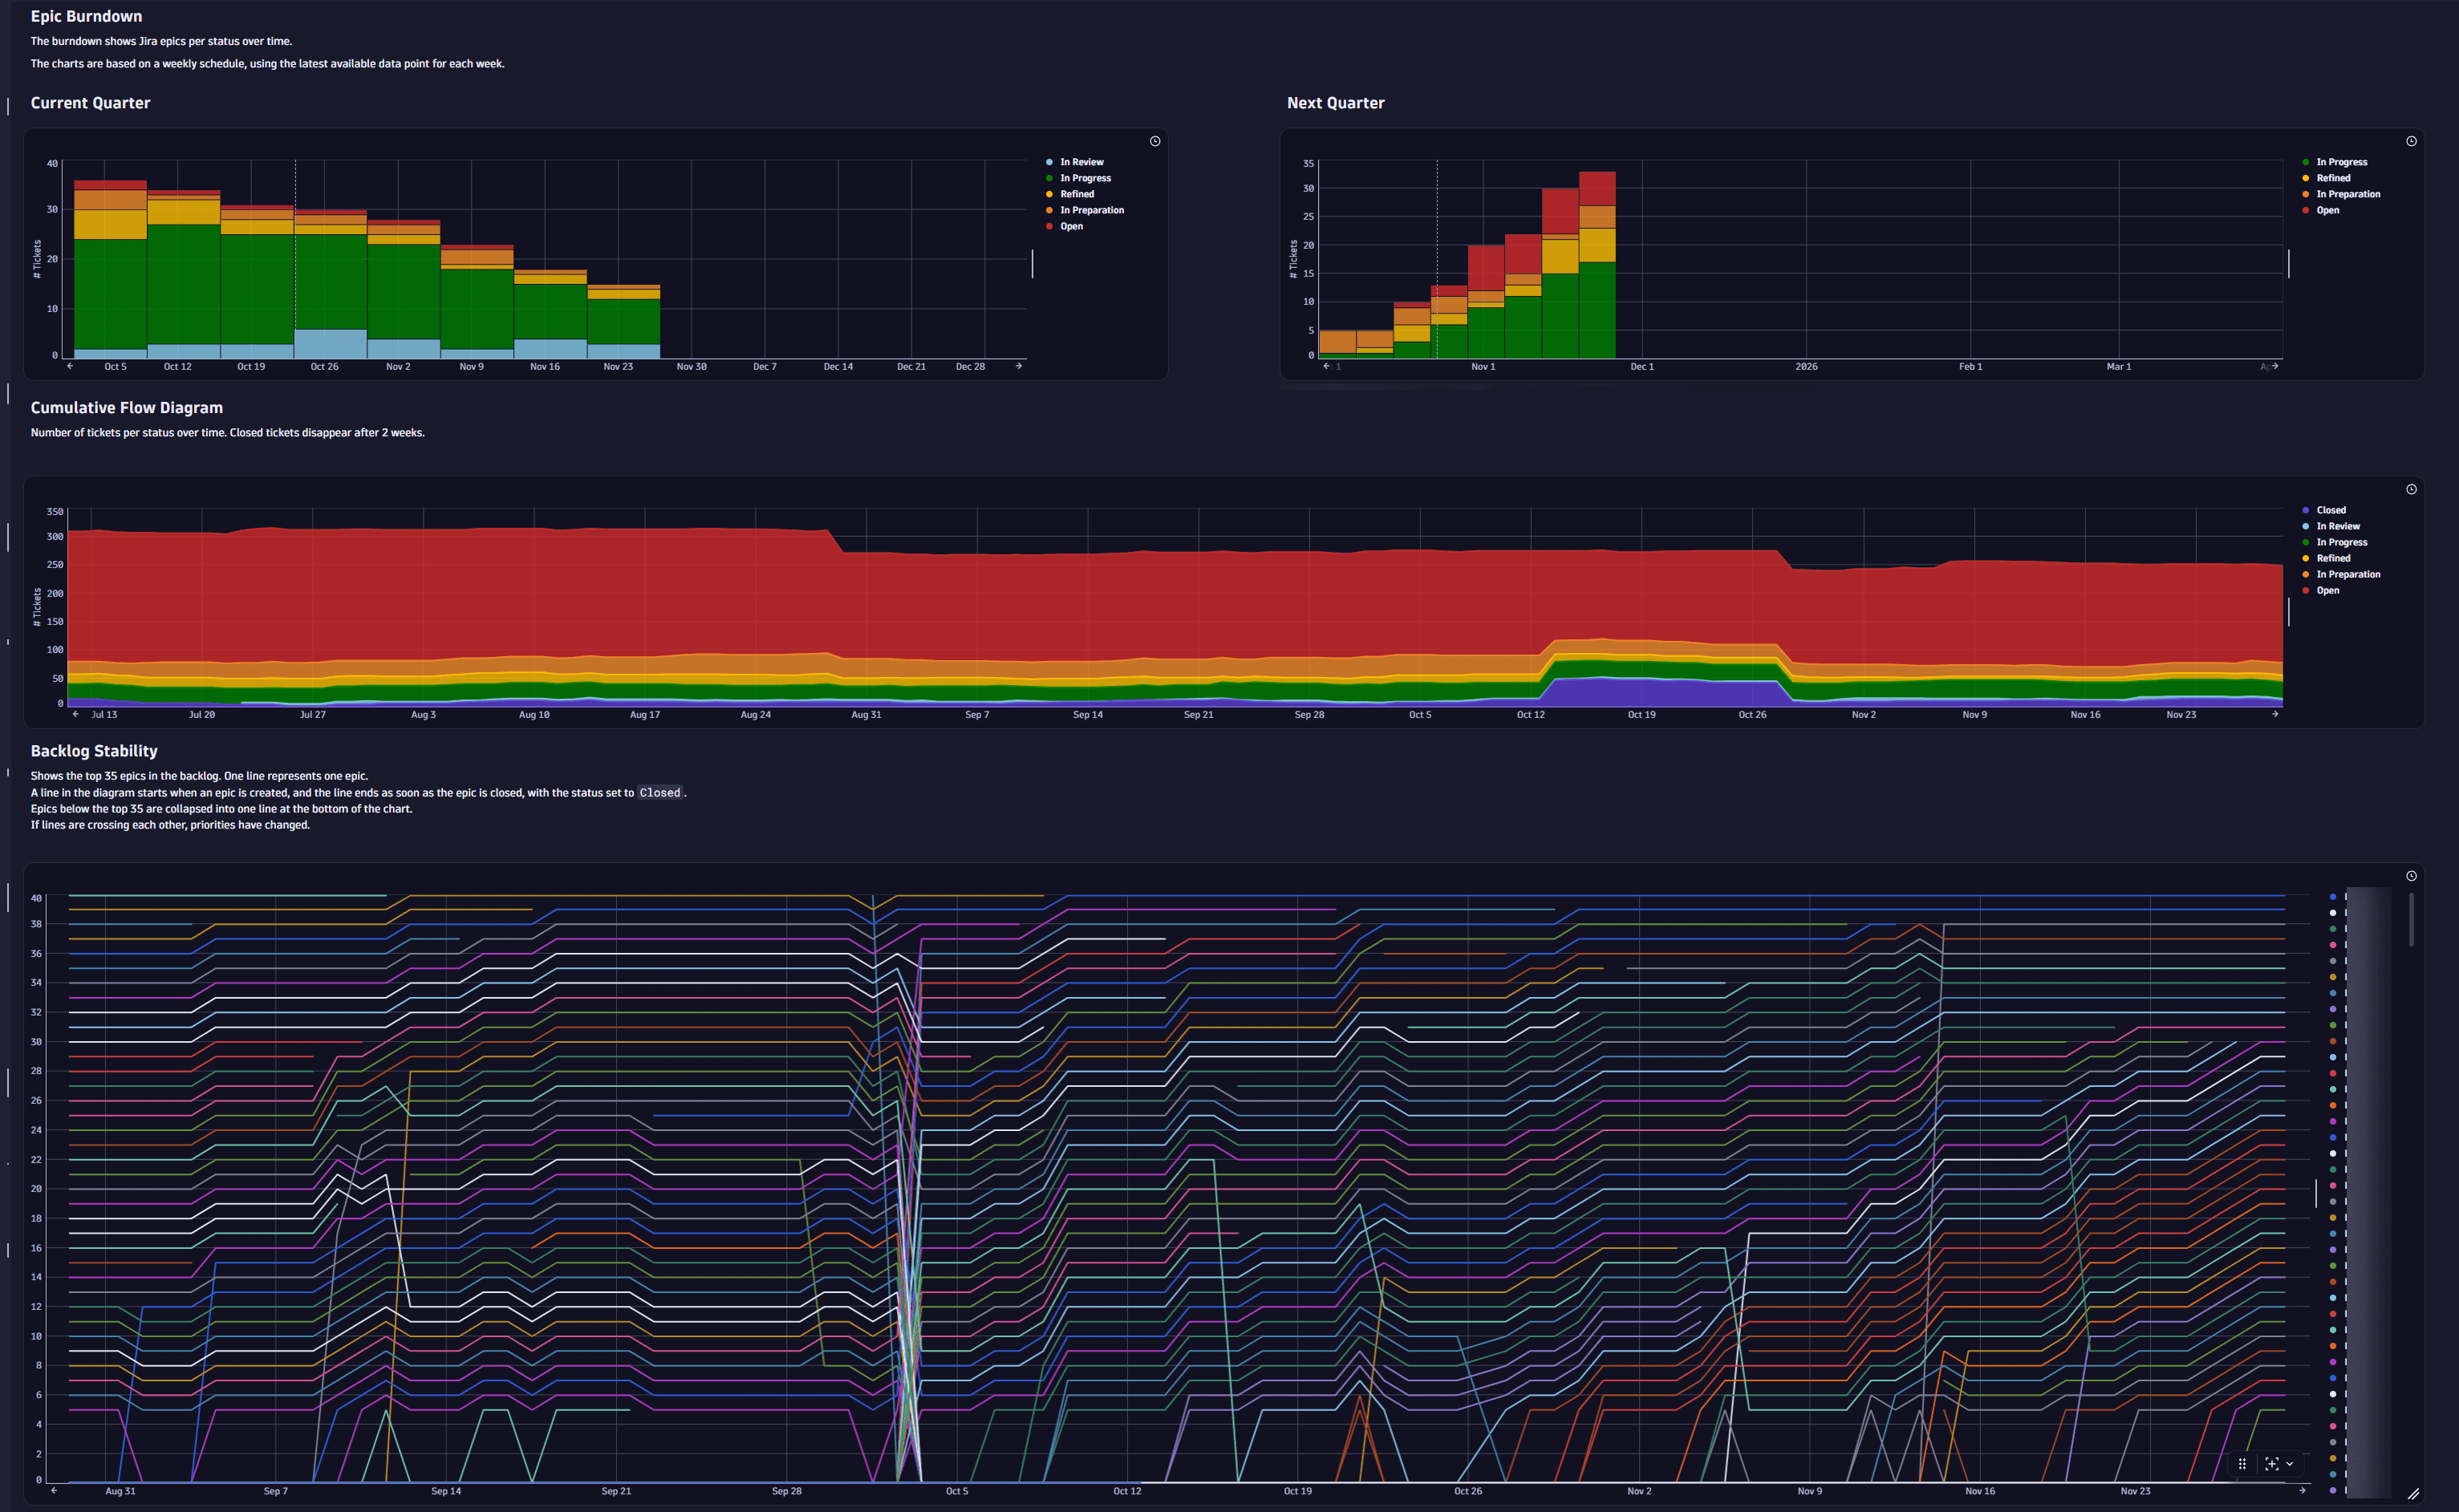
Below is a screenshot with highlights from the Engineering Flow Metrics dashboard.
Concepts
- Software Development Lifecycle (SDLC) events
SDLC events within the Software Development Lifecycle (SDLC) play a pivotal role in achieving effective pipeline observability. They represent key actions that occur throughout the lifecycle — such as releasing a new software version, deploying that version, or successfully passing a performance test. For more information, see Semantic Dictionary SDLC events
Target audience
The Engineering Flow Metrics dashboard is intended for:
-
Senior leaders and decision-makers who require a high-level view of the value streams to align business objectives with delivery outcomes.
-
Development teams, product owners, product managers, agile coaches, and engineering managers who use Jira to get insights about their team's progress.
Prerequisites
- Access to the Jira Cloud instance.
- You have an access token with the
OpenPipeline - Ingest Software Development Lifecycle Events (Built-in)scope.
How to optimize engineering flow metrics using Jira data
1. Jira: Configure a quick filter
In Jira, configure a quick filter to get a <filter-id> for the scheduled Jira automation.
-
Go to your Jira instance and configure a Jira quick filter.
To monitor epics in Jira, you can use the following JQL query as an example.
type = Epic AND project = <your-project-name> AND (resolved is EMPTY or resolved > -2w) -
Select Copy filter. The Copy filter dialog opens.
-
Enter the name of the filter in Name.
-
Select who can view in the Viewers drop-down list.
The filter needs to be visible to the actor of the automation. To be on the safe side, set the permission so that everybody can see the filter.
For more information on actors in Jira automation, see What is a rule actor?.
-
Select Save.
-
Get the filter ID from the Jira URL. The format is similar to
/issues/?filter=<filter-id>, for example,?filter=12345
2. Dynatrace: Copy Endpoints path
You need the Endpoints path to configure the scheduled Jira automation.
To find and copy the Endpoints path:
- Go to
 Settings > Process and contextualize > OpenPipeline > Software development lifecycle.
 - In the Ingest sources tab > Endpoints path tab, hover over the Endpoints path.
- From the dot menu of the source, select Copy to copy the Endpoints path.
3. Jira: Set up a trigger for scheduled Jira automation
Data is stored as events in Dynatrace. Thus, the data is charged as Events powered by Grail. For more information on the cost of Events powered by Grail, see Events powered by Grail overview (DPS).
To populate Dynatrace with Jira data, set up a Jira automation.
-
Go to Jira and open your Jira project.
-
Select Project settings.
-
On the left side, select Automation.
-
Select Create rule. Start with an empty Jira automation rule, allowing you to configure the correct fields.
-
Select the Scheduled trigger. For more information, see Jira automation triggers and Jira Automation: Set 'Scheduled' as a trigger and use multiple actions.
-
In the Occurrence field, to trigger nightly, for example, at 4:00 AM.
- In the Run rule every field, set the Scheduled trigger to
1. - In the Run rule every field, select Days.
- In the At field, set the time to
4:00 AM. - In the At field, select the time zone.
- In the Run rule every field, set the Scheduled trigger to
-
Select the Run a JQL search and execute actions for each work item in the query checkbox.
-
Required In the JQL field, enter the filter you created earlier as
filter=<filter-id>. Replace<filter-id>with the ID of the filter that you created earlier.Make sure that Only include work items that have changed since last time is not selected.
-
Select Next to finish the configuration of the scheduled trigger.
4. Jira: Start setting up the Send web request action for Jira automation
As part of the Jira automation, you need to set up a Jira Send web request action. This action sends an HTTP request to the URL specified.
-
Add a Send web request action.
-
Enter your Web request URL from the Dynatrace: Copy Endpoints path step. The pattern is
https://{your-environment-id}.live.dynatrace.com/platform/ingest/v1/events.sdlc. -
In the HTTP method field, select POST.
-
In the Web request body, select Custom data.
-
In the Headers section, set the following Key and Value pairs:
- Content-Type to
application/json. - Authorization to
Api-Token <your-API-token>. - accept to
application/json; charset=utf-8.
- Content-Type to
-
Replace
<your-API-token>with your Dynatrace API access token that you generated in the earlier step.
5. Jira: Find Rank and Team Jira field IDs
You need to find the automatically created Rank and Team Jira field IDs that are specific to your Jira instance so that you can use them for analytics in the next step.
In your browser, to find the Jira fields, make a call to the Jira API on any issue in your project.
-
Enter the following URL
https://<your-endpoint>.atlassian.net/rest/api/2/issue/<your-issue>?expand=namesinto your browser. Replace<your-endpoint>with your URL. Replace<your-issue>with any of your issue keys. -
Open the URL. This request returns a JSON output to the browser.
-
Search for the custom fields Rank and Team. You can use the custom field ID in the Jira Automation to send the data to your dashboard.
The field format is
customfield_xxxxxwherexxxxxis the field ID. The code block below shows an example of the JSON response body, including custom field IDs.{"expand": "renderedFields,names,schema,operations,editmeta,changelog,versionedRepresentations","id": "10000","self": "https://<your-endpoint>.atlassian.net/rest/api/2/issue/10000","key": "SCRUM-1","names": {"customfield_10001": "Team","customfield_10019": "Rank"}}
6. Jira: Finish setting up the Send web request action for Jira automation
Add the custom field IDs of the automatically created Rank and Team Jira fields to the Custom data field of your Jira Send web request action.
-
Go to your Jira Automation.
-
In the Custom data field, enter the following template for generating JSON from JIRA issue data:
{"specversion": "1.0", "id": "{{issue.key}}", "source": "JIRA", "day": "{{now.jiraDate}}", "version": "1", "key": "{{issue.key}}", "summary": {{issue.summary.asJsonString()}}, "type": "{{issue.issuetype.name}}"{{#exists(issue.assignee)}}, "assignee": "{{issue.assignee.displayName}}"{{/}}{{#exists(issue.customfield_<your-team-custom-field-id>)}}, "team": "{{issue.customfield_<your-team-custom-field-id>.name}}"{{/}}, "status": "{{issue.status.name}}", "status_category": "{{issue.status.statuscategory.name}}"{{#exists(issue.resolution)}}, "resolution": "{{issue.resolution.name}}"{{/}}{{#if(not(issue.labels.isEmpty))}}, "labels": [{{#issue.labels}}"{{.}}" {{^last}},{{/}}{{/}}]{{/}}{{#if(equals(issue.fixVersions.size, 1))}}{{#issue.fixVersions}}, "fix_version": "{{name}}", "fix_version.release_date": "{{releaseDate.format("yyyy-MM-dd")}}"{{/}}{{/}}, "created": "{{issue.created}}", "status_changed_on": "{{issue.statuscategorychangedate}}", "resolved": "{{issue.resolved}}", "rank": "{{issue.customfield_<your-rank-custom-field-id>}}", "project": "{{issue.project.key}}"}This example uses Jira smart values to extract the required information and ingest it into Dynatrace.
{{#if(equals(issue.fixVersions.size, 1))}}implies that the Jira epic has only one fix version. -
Replace
<your-rank-custom-field-id>with the Rank custom field ID. -
Replace
<your-team-custom-field-id>with the Team custom field ID. -
Select Next to finish the configuration of the Send web request action.
-
Select Turn on rule to save the automation.
-
Enter the Name for the Jira Automation.
-
Select Turn on rule to save.
7. Organize data
To organize the data in Dynatrace, set up a custom Grail bucket.
- In Dynatrace, go to Settings > Storage management > Bucket storage management.
- Select Bucket.
- In the New bucket dialog, enter the Bucket name and the Display name. Use
jira_eventsbecause the sample dashboard expects this name. - Set the Bucket table type to events.
- Set the Retention period to three years in days which is
1095days. - Select Create.
If the data should be restricted, configure the bucket permissions.
8. Route data
To route the data into the custom bucket, set up an SDLC pipeline.
-
Go to Settings > Process and contextualize > OpenPipeline > Software development lifecycle.
-
Go to the Pipelines tab.
-
Select Pipeline.
-
Enter a pipeline Name.
-
Go to the Storage tab.
-
Select Processor > Bucket assignment.
-
Enter a New Processor Name, for example,
Jira Daily Snapshot. -
Set the Matching condition to
source == "JIRA". -
In the Storage drop-down list, select your bucket from the previous step.
-
Select Save.
-
Go to the Dynamic routing tab.
-
Select Dynamic routing.
-
In the Add a new dynamic route dialog, enter the Name of the new dynamic route.
-
In the Matching condition, enter
source == "JIRA". -
Select from the Pipeline drop-down your custom pipeline.
-
Select Add.
-
Select Save.
All events created by the Jira automation are added to the bucket. For more general information, see Configure a processing pipeline.
9. Verify setup
This step is about verifying your Jira and Dynatrace setup.
-
Run the Jira automation manually to verify the automation rule.
-
Query the events via DQL, for example, in Notebooks, to verify that your events have been ingested successfully.
-
Go to
 Notebooks.
 -
Choose or create a notebook.
-
Select
 DQL to add a new section with a DQL query input field.
 -
Enter the following DQL query:
fetch events| filter dt.system.bucket == "jira_events"
-
This query returns data after the automation ran successfully.
10. Use the Engineering Flow Metrics dashboard for analysis
We're providing you with a ready-made dashboard.
To find and use the dashboard:
-
Go to the Engineering Flow Metrics dashboard on Playground site.
-
Download the dashboard.
-
Upload the dashboard to your environment.
You need to adjust the start date of specific queries to match the start of your data ingestion which we explain in detail in the Hard-Coded Dates section of the dashboard.
The sections Epic Throughput, Lead Time, and Implementation Aging Chart are populated immediately after the first data import.
After the daily snapshot data is available for at least two weeks, you can do the analysis with the help of different sections of the dashboard, for example, Epic Burndown, Cumulative Flow Diagram, Work In Progress, Backlog Stability, and Changes.
The dashboard shows:
-
Epic Throughput: Historical throughput is shown in grey and is based on the Fix Version. The epics planned in the future are shown in blue, based on the Fix Version year quarters. The thin green line shows the average of the last four complete quarters. The table in the dashboard displays the difference from the average for each quarter.
-
Epic Burndown: The burndown shows Jira epics per status over time. The charts are based on a weekly schedule, using the latest available data point for each week.
-
Lead Time: Time between creation and resolution of the epic. Epics that were closed within a quarter are considered.
-
Implementation Aging Chart: Time in implementation. One month is 30 days.
-
Cumulative Flow Diagram: Number of Jira epics per status over time. Closed epics disappear after two weeks.
-
Work In Progress: Epics In Progress.
-
Backlog Stability: Shows the top 35 epics in the backlog. One line represents one epic. A line in the diagram starts when an epic is created, and the line ends as soon as the epic is closed, with the status set to Closed. Epics below the top 35 are collapsed into one line at the bottom of the chart. If lines are crossing each other, priorities have changed.
-
Changes in the last 2 weeks: Changes to the fields Status, Fix Version, and Assignee are shown.
-
Next steps
You now have the dashboard, which allows you to view the metrics and start optimizing your value delivery flow. The dashboard serves as a starting point; you can extend or refine it based on your specific needs.
 Dashboards
 OpenPipeline