Self-monitoring metrics
- 4-min read
- Published Dec 03, 2021
Dynatrace offers a special self-monitoring category of metrics to provide observability into the operation and health of Dynatrace components and features. These metrics are available in every Dynatrace Managed and SaaS environment and can be identified by the dsfm: metric prefix.
To review the currently implemented self-monitoring metrics
- Go to Metrics.
- Filter the table by
dsfm:. - Expand any row to review metric details.
The examples that follow show how you can use these self-monitoring metrics to get insights into the operation and health of your Dynatrace ActiveGate and Dynatrace environment over time.
Environment insights
In this example, we use self-monitoring metrics to get insights into the operation and health of a Dynatrace environment over time.
- Go to Data Explorer.
- Check the metrics listed below.
To view the self-monitoring data use the following metrics:
-
dsfm:cluster.oneagent.agent_modules(number of monitored hosts)
Data Explorer query example:dsfm:cluster.oneagent.agent_modules:filter(and(eq("dt.oneagent.agent_type",os))):merge("dt.entity.apm_tenant","dt.tenant.uuid"):avg:splitBy():sum:auto:sort(value(max,descending)):limit(10) -
dsfm:cluster.oneagent.agent_modules(number of monitored code modules)
Data Explorer query example:dsfm:cluster.oneagent.agent_modules:filter(not(or(eq("dt.oneagent.agent_type",os),eq("dt.oneagent.agent_type",log_analytics),eq("dt.oneagent.agent_type",remote_plugin)))):merge("dt.entity.apm_tenant","dt.tenant.uuid"):avg:splitBy():sum:auto:limit(10) -
dsfm:server.service_calls.received(number of service calls received)
Data Explorer query example:dsfm:server.service_calls.received:default(0):splitBy():sum:rate(1m) -
dsfm:server.spans.received(number of spans received)
Data Explorer query example:dsfm:server.spans.received:default(0):splitBy():sum:rate(1m) -
dsfm:server.rum.user_session_count(number of user sessions)
Data Explorer query example:dsfm:server.rum.user_session_count:default(0):splitBy():sum:rate(1m) -
dsfm:server.rum.action_count(number of user actions)
Data Explorer query example:dsfm:server.rum.action_count:default(0):splitBy():sum:rate(1m)
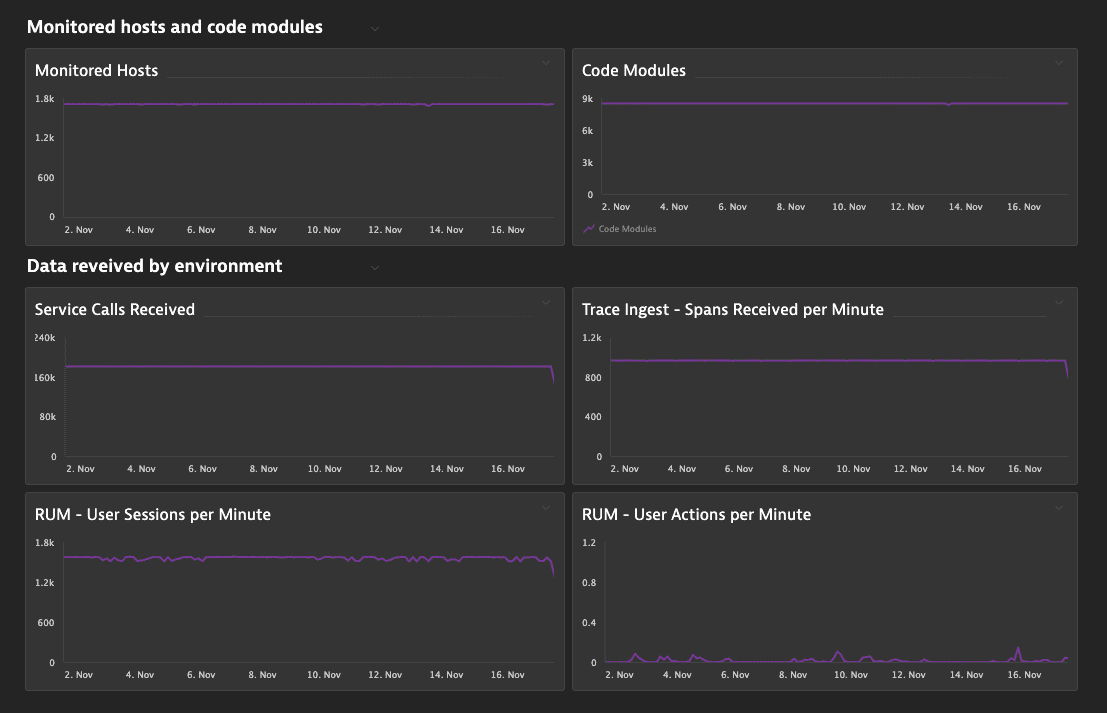
Example environment insights dashboard
You can create a Dynatrace dashboard for quick, focused access to the self-monitoring data. Create tiles by selecting the self-monitoring metrics in Data Explorer, configuring a visualization for each of them, and pinning them to your dashboards. For more information, see Dashboards Classic.
The following screenshot shows a dashboard that uses the above metrics to monitor the operation of a Dynatrace environment over time.
- A steady number of monitored hosts and modules, service calls received, and user sessions/actions per minute together indicate a healthy Dynatrace environment.
- A significant drop in these metrics might indicate a problem, in which case you should contact a Dynatrace product expert via live chat to determine the root cause.

Log and event monitoring insights
In this example, we use self-monitoring metrics to get insights into the operation of Log Monitoring Classic over time.
- Go to Data Explorer.
- Check the metrics listed below.
To view the self-monitoring data use the following metrics:
-
dsfm:server.log_and_events_monitoring.events_rejected_count(Count of log events that are rejected due to ingestion limit)
This metric can be used to verify if any log events were rejected due to the ingest/minute limit for a given timeframe. If the metric is frequently above0, then it may suggest that limits should be increased for that tenant.
Data Explorer query example:dsfm:server.log_and_events_monitoring.events_rejected_count:splitBy():sum:auto:sort(value(sum,descending)):rate(1m) -
dsfm:server.log_and_events_monitoring.events_incoming_count(The count of incoming log events)
This metric can be used to to verify how many log events are incoming to the server for a given timeframe. It can include duplicates due to retransmissions. This metric contains additional dimensions:event.senderto identify the source of the incoming log event andevent.typeto identify the event type of the incoming log event.
Data Explorer query example:dsfm:server.log_and_events_monitoring.events_incoming_count:splitBy():sum:auto:sort(value(sum,descending)):rate(1m)
ActiveGate insights
In this example, we use the self-monitoring metrics to get insights into the operation of an ActiveGate.
- Go to Metrics.
- Filter the table by
dsfm:active_gate. - Check metrics for ActiveGate JVM CPU usage and heap memory, which are a good first indicator of the health and utilization of an ActiveGate:
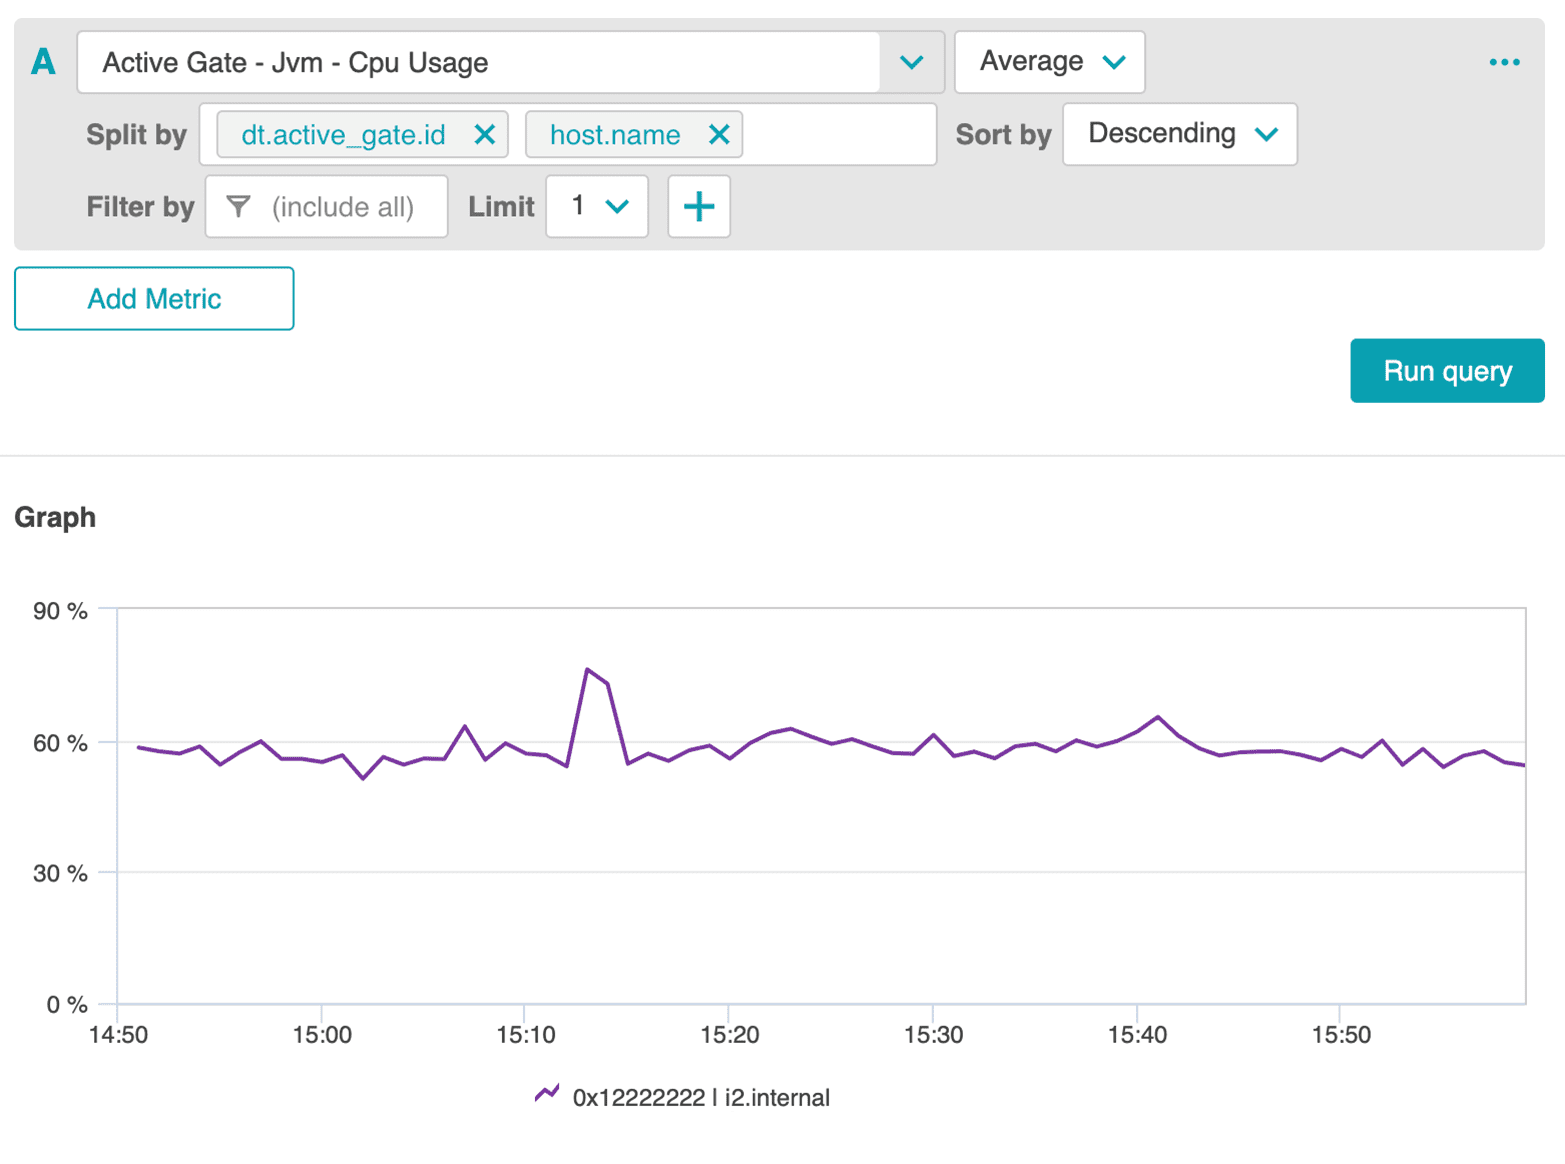
- ActiveGate - JVM - CPU Usage
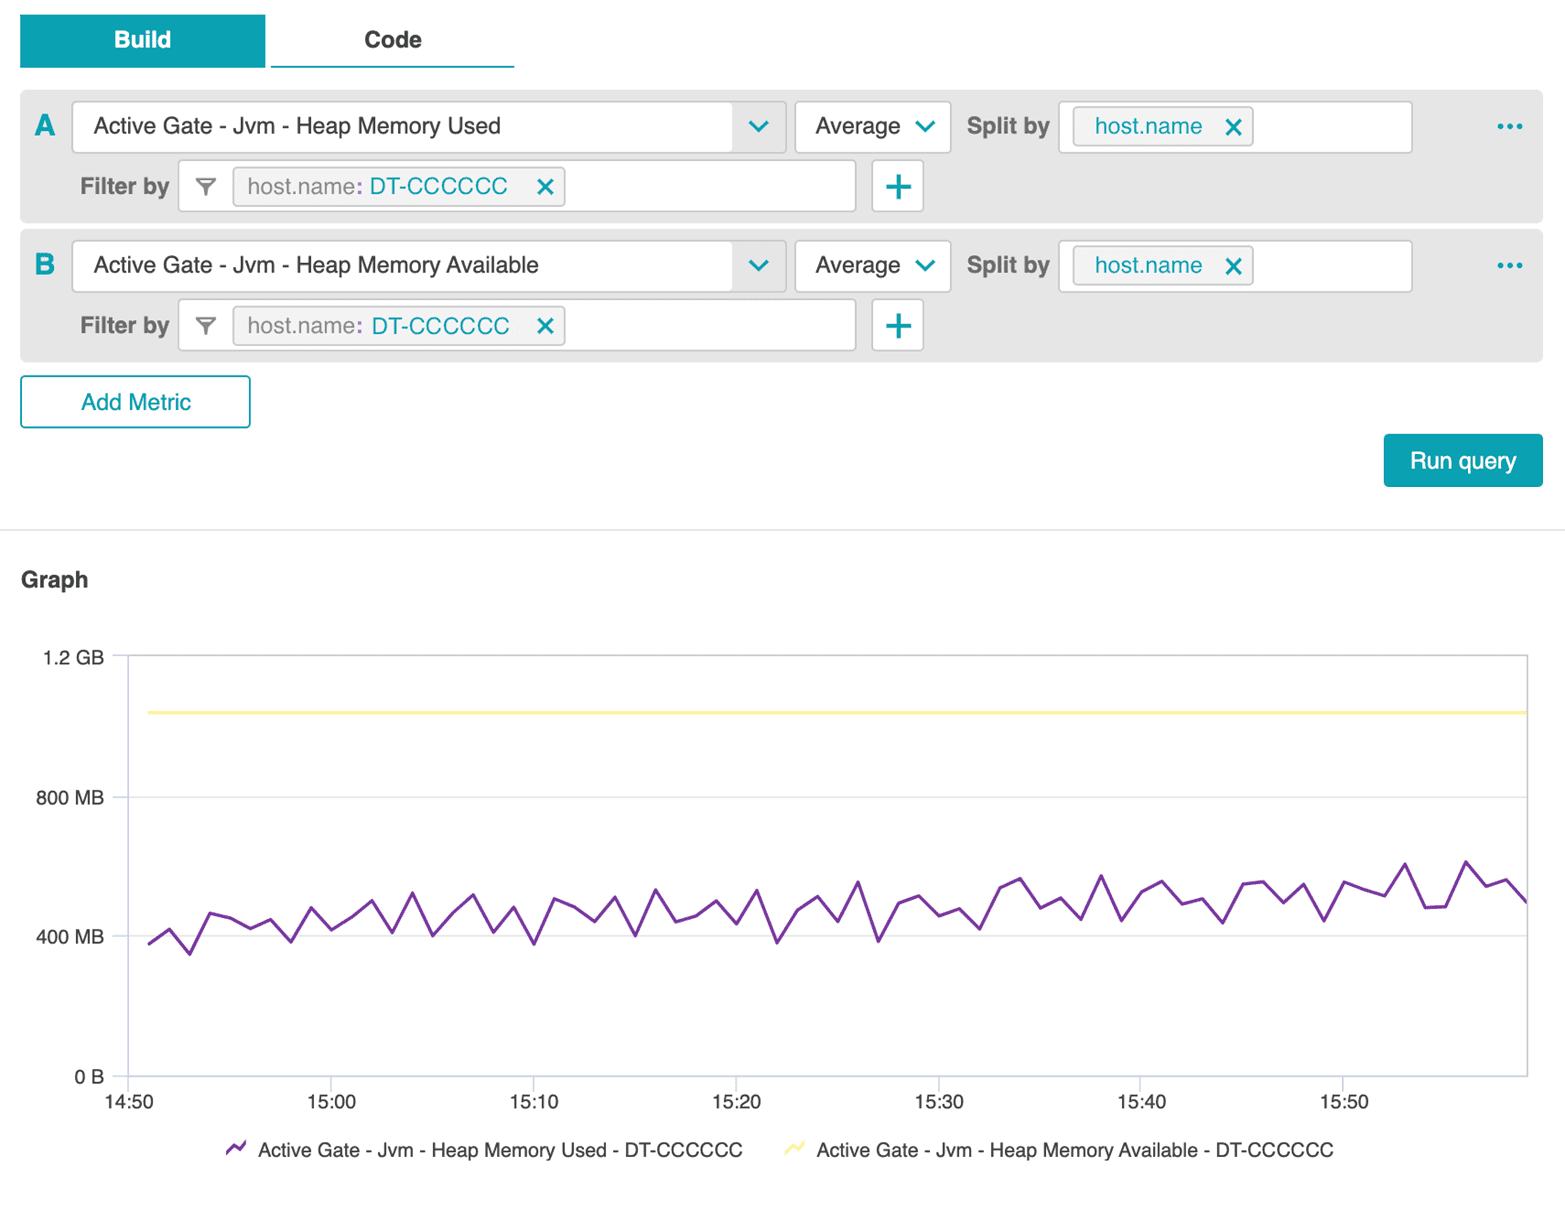
- ActiveGate - JVM - Heap Memory Used
- ActiveGate - JVM - Heap Memory Available
The following screenshots show the JVM memory usage and JVM CPU usage of one ActiveGate in the cluster.

Notice that the memory usage and availability over time does not indicate any abnormal utilization, but CPU usage shows an interesting peak.

Further investigation reveals that this peak was caused by an increased number of OneAgents reporting via this ActiveGate, which resulted from the execution of a test on this cluster.