Data Explorer Advanced mode query editor
- Dynatrace Classic
- 10-min read
This page refers to Data Explorer, a Dynatrace Classic feature closely integrated with classic dashboards created using  Dashboards Classic. Upgrade to the latest Dynatrace to take advantage of our latest data exploration capabilities.
To fully utilize the power of the Metrics API v2 queries from within the Dynatrace web UI, use Data Explorer in Advanced mode.
In Advanced mode, you can:
- Inspect and edit the query you created through the Dynatrace web UI selections (with Advanced mode off).
- Leverage metric selectors to apply transformations that are not possible otherwise. For example, timeframe shifts.
- Use metric expressions to create simple arithmetic operations with multiple different metric values. For example,
metric A+metric B. - Work with entity selectors to apply more advanced filters to your metrics. For example, to filter a Kubernetes node metric for a certain Kubernetes cluster.
Turn advanced mode on
You can start building a simple query through the web UI and then turn on Advanced mode to see the underlying query.
For example, if you start with this query with Advanced mode off:

you will see this when you turn Advanced mode on:

The underlying query code is displayed in the form in which it is passed to the Metrics API v2:
builtin:host.cpu.usage:splitBy("dt.entity.host"):avg:auto:sort(value(avg,descending)):limit(20)
Turn advanced mode back off
For simple queries where you need one of the following transformations, you can turn advanced mode off again:
- Split by dimensions of the metric (when you have not added any additional dimensions via the entity selector in advanced mode)
- Filter connected via an OR relationship
- Sort
- Limit
For a detailed description of the individual transformations, see metric selector.
Turning advanced mode off is possible only if the transformations you edited in advanced mode were added when advanced mode was off.
For example, if you initially applied a sort transformation with advanced mode off, you can change the sort order from ascending to descending with advanced mode on and then switch advanced mode back off. However, once you add new parts to the query—for example, by adding transformations like a timeshift or metric expressions, which aren't yet possible with advanced mode turned off—you can't switch advanced mode back off and continue working.
Edit a query
The main functions of the query editor are the same whether Advanced mode is turned on or off:
-
To add a metric, select Add metric to add a row (another metric) to the query.
-
To duplicate a metric, select More (…) > Duplicate in a row to duplicate that row (metric).
-
To delete a metric, select More (…) > Delete in a row to delete that row (metric).
-
To reorder metrics, select and drag the metric to a new position in the list of metrics. Rerun the query to see your changes.
 Drag metric to reorder list
The order in which metrics are listed in your query affects the following:
- Order in which elements of a drawing are rendered: a query's metrics are rendered in order from top to bottom, so the last one is rendered on top of the others
- Order of columns in a table visualization
- Order in which settings are displayed in the Settings panel
-
To try the query, select Run query. The text next to the Run query button displays the status of the most recent run.
The main difference is in how you edit the query and the number of possibilities available:
- With Advanced mode turned off, the web UI makes it easy to build your query from menu selections, but your query options are limited
- With Advanced mode turned on, the query options are much greater, but you need to know how to edit a query
Add a metric
The easiest way to select metrics for a query is to start with Advanced mode turned off.
-
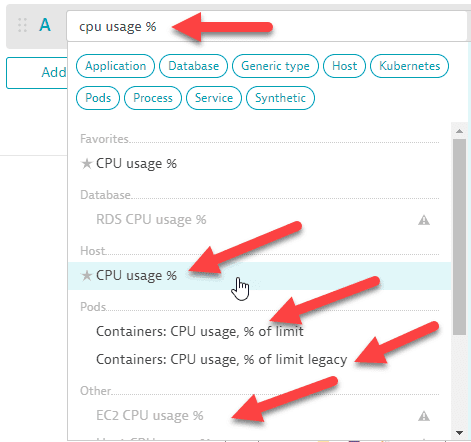
Insert the pointer/cursor into a row and start typing a metric name. Matching metrics are listed.
For example, typecpu usageand then selectbuiltin:host.cpu.usagefrom the list. Data Explorer: metric selector: type and select
 -
You can select commonly applied aggregations, dimensions, and transformations:
- Split by: select one of the listed dimensions for the selected metric
- Aggregate: select
Average,Count,Maximum,Minimum,Sum,Median,Percentile 10th,Percentile 75th, orPercentile 90th.
The selected aggregation is applied after the Split by. For example, if you select
Percentile 10thand split byHostfor a gauge metric such asbuiltin:host.cpu.idle, the percentile is calculated on the values after splitting by host.- Sort by: select ascending or descending
- Filter by: select dimensions and filter attributes
- Limit: select a limit value
-
Turn Advanced mode on.
-
Edit the results as needed.
- Copy and paste from one row into another
- Add, duplicate, and delete rows as needed
To add a metric in Advanced mode
-
Insert the pointer/cursor into a row and start typing a metric key. Matching metrics are listed.
For example, typehost.cpuand then selectbuiltin:host.cpu.usagefrom the list. Data Explorer: Advanced mode: select metric
 -
You need to add all transformations manually.
Edit a metric
In the edit box:
- Type a colon (
:) to list what you can add at that insertion point, and then select from the list. - Press Shift-Enter to force a new line. This can be useful for readability and does not affect query evaluation.
- Select a metric or number and press ( on your keyboard to wrap the selection in parentheses.
- For an overview of metrics, see Metrics Classic.
- To review a list of built-in metrics, see Built-in classic metrics.
- To learn about ingesting custom metrics into Dynatrace, see Extend metric observability.
- Use the Metrics browser to:
- Check metric details
- Open the selected metric in Data Explorer
Operands
An operand is a metric or a number.
- Each operand must be wrapped in parentheses
(). You can also use brackets to enforce precedence. - All metrics with more than 1 data point involved in a metric expression must be of the same resolution.
- You can use any metric as an operand, including metrics modified by any transformation chain, and you can apply transformations to the result of the expression.
For full details on writing metric queries, see:
Expressions
Metric expressions enable you to apply simple arithmetic operations on operands (metrics or numbers).
For example, this expression calculates the ratio (as a percentage) of two metrics:
((metric1)/(metric2))*(100)
Building on the example above, we have the following basic components to work with:
- Operand: a metric or number
- Parentheses:
() - Arithmetic operators:
+,-,*,/ - Negation:
-()
Arithmetic operations use the data points of tuples (unique combinations of metric—dimension—dimension value) of metrics. Identical tuples of each metric are paired and then their data points are aligned. For details, see Metrics API - Metric expressions.
Example: delta
Learn how to:
- Assemble a metric in advanced mode
- Use delta
This example shows how to transform a gauge metric into a delta count metric.
-
With Advanced mode turned on, we have assembled the following gauge metric:
builtin:cloud.kubernetes.pod.containerRestarts:splitBy()
by making the following series of selections from the options offered in the editor:Select metric: Type part of the metric key until you see the metric you want to select.
 Data Explorer: Example: Delta: 1
Select splitBy: Type a colon (
:) followed by a partial search string for what you want to add (in this case,splitBy), then select it from the list. Data Explorer: Example: Delta: 2
Intermediate state:
 Data Explorer: Example: Delta: 3
builtin:cloud.kubernetes.pod.containerRestarts:splitBy() -
But we decide we want to show it as a delta count metric.
Select avg: Type a colon (
:) followed by a partial search string foravg, then select it from the list. Data Explorer: Example: Delta: 4
Select delta: Type a colon (
:) followed by a partial search string fordelta, then select it from the list. Data Explorer: Example: Delta: 5
Final state:
 Data Explorer: Example: Delta: 6
builtin:cloud.kubernetes.pod.containerRestarts:splitBy():avg:delta -
Run the query.
Example: Calculate an error rate
Learn how to:
- Combine two rows into one with a metric expression
- Do a simple calculation
In this example, we want to display the error rate for a conversion page. We can start with these metrics:
- Action count (
builtin:apps.web.action.count.load.browser) - Error count (
builtin:apps.web.action.countOfErrors)
But simple counts don't tell a whole story. Based on the action and error counts, we want to calculate a third metric to report the conversion page error rate. The query for the third metric will divide the error count by the action count and filter for the page name.
We can create this query with almost no typing.
-
With Advanced mode turned off, select the metrics, aggregations, and filters.
 Example: Calculate an error rate: advanced mode off
 -
With Advanced mode turned on, view the query code.
 Example: Calculate an error rate: advanced mode on: metrics separate
 -
Copy and paste the contents of edit box B into edit box A, combining the two queries with added parentheses and a division sign, and then delete B.
If A is the first operand:
builtin:apps.web.action.countOfErrors:filter(and(or(in("dt.entity.application_method",entitySelector("type(application_method),entityName.equals(~"loading of page /easytravel/home~")"))))):splitBy():sum:auto:sort(value(sum,descending)):limit(20)and B is the second operand:
builtin:apps.web.action.count.load.browser:filter(and(or(in("dt.entity.application_method",entitySelector("type(application_method),entityName.equals(~"loading of page /easytravel/home~")"))))):splitBy():sum:auto:sort(value(sum,descending)):limit(20)we want to divide
(A)/(B):((builtin:apps.web.action.countOfErrors:filter(and(or(in("dt.entity.application_method",entitySelector("type(application_method),entityName.equals(~"loading of page /easytravel/home~")"))))):splitBy():sum:auto:sort(value(sum,descending)):limit(20))/(builtin:apps.web.action.count.load.browser:filter(and(or(in("dt.entity.application_method",entitySelector("type(application_method),entityName.equals(~"loading of page /easytravel/home~")"))))):splitBy():sum:auto:sort(value(sum,descending)):limit(20)) -
The result should be something like this:
 Example: Calculate an error rate: advanced mode on: metrics combined to calculate
 -
Run the query.
Now you can add thresholds and pin the query to a dashboard.
Example: Compare a metric to a previous timeframe
Learn how to add context to your visualizations such as line charts in order to answer the question, "What's considered normal?"
When looking at data on your dashboards, the lines or single values alone often are quite useless, particularly to new users, who may lack the expertise and experience to quickly judge whether a spike on a line chart or a certain number can be considered an anomoly. Adding context to your visualizations can make all the difference to enabling better and faster interpretation.
In this example, we learn how to duplicate your metric and then apply the :timeshift transformation to add context to your line charts.
We start with builtin:apps.web.largestContentfulPaint.load.browser, a built-in Core web vital metric that gives you the largest contentful paint measurements for all load actions for all your web applications.
We can create this query with almost no typing.
- With Advanced mode turned off, select the metric, splits, aggregations, and filters.
- Duplicate the metric by selecting More (…) > Duplicate for that row.
- Turn on Advanced mode to view the query code.
- Add timeshift(-1w) at the end of the second (B) query.
- Run the query.
The final query code for A and B should look something like this (depending on your selections in step 1):
A without timeshift:
builtin:apps.web.largestContentfulPaint.load.browser:splitBy():percentile(75):auto:sort(value(percentile(75),descending)):limit(10)
B with a timeshift applied:
builtin:apps.web.largestContentfulPaint.load.browser:timeshift(-1w):splitBy():percentile(75):auto:sort(value(percentile(75),descending)):limit(10)
Example: Relationship filters
Learn how to use the entity selector and relationships to filter a metric by the values of a related entity.
In this example, we:
- Start with metric
builtin:cloud.kubernetes.node.cores - Apply an
infilter for the Kubernetes nodes likedt.entity.kubernetes_node - Leverage the entity selector to check all Kubernetes nodes that are running within a given Kubernetes cluster
Let's break the entity selector down by its components to better explain them before looking at the final query:
type(KUBERNETES_NODE)defines the type of the entity we are looking for.toRelationships.IS_KUBERNETES_CLUSTER_OF_NODE(defines the relationship between the node (left part) and the cluster (right part; see below). Remember, we want all Kubernetes nodes in a given cluster so it can be interpreted as such: "from the entity I defined before (the Kubernetes node), I am looking for all Kubernetes clusters of that node.type(KUBERNETES_CLUSTER),entityId(KUBERNETES_CLUSTER-A943C5CF0A41A684))")))defines the entity of the right side of this relationship as a Kubernetes clusteran cluster and the given entity ID.
The final query looks like this:
(builtin:cloud.kubernetes.node.cores:avg):filter(in("dt.entity.kubernetes_node",entitySelector("type(KUBERNETES_NODE),toRelationships.IS_KUBERNETES_CLUSTER_OF_NODE(type(KUBERNETES_CLUSTER),entityId(KUBERNETES_CLUSTER-A943C5CF0A41A684))")))
Example: Explicit Histogram
Learn how to analyze an explicit histogram metric in the Data Explorer using the histogram transformation and how to extract percentiles from it.
In this example, we:
- Start with metric
_cws.otlp.metrics.generic.histogram1.histogram. Please note the.histogramsuffix. - Apply an equals filter for the Kubernetes cluster like
dt.kubernetes.cluster.id. - Use the
histogramtransformation to expose the buckets of the histogram metric as dimensions.
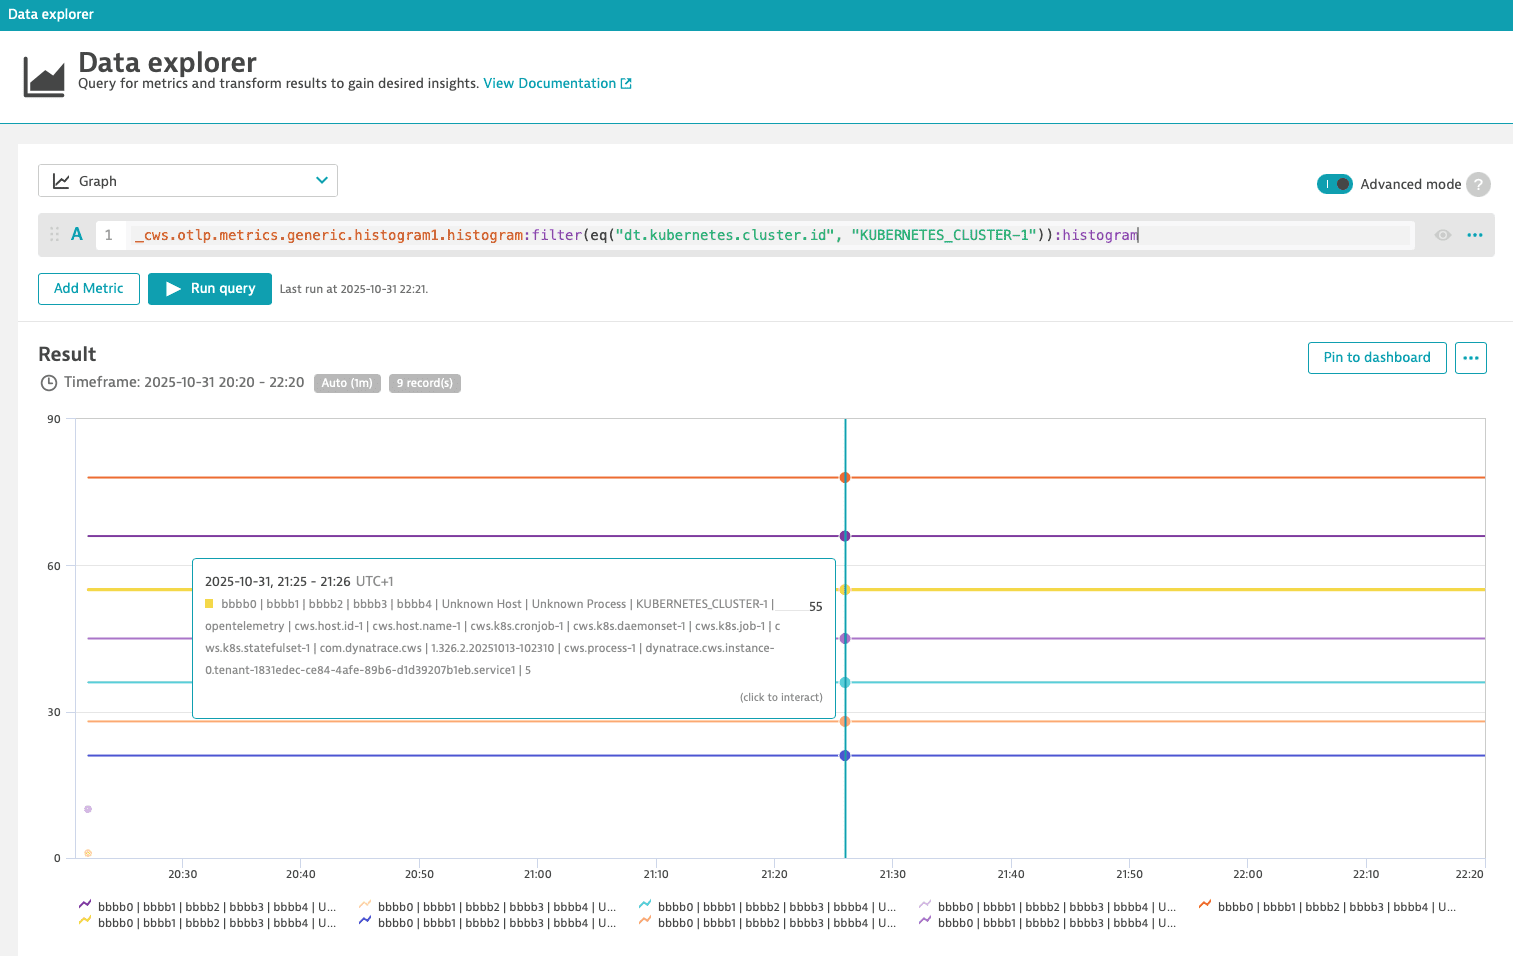
The final query looks like this:
_cws.otlp.metrics.generic.histogram1.histogram:filter(eq("dt.kubernetes.cluster.id", "KUBERNETES_CLUSTER-1")):histogram

The value of the 'le' dimension denotes the upper boundary (less than or equal to) of each bucket. In this example, the upper boundary of bucket 55 is 5.
- Only 12 buckets per histogram datapoint are stored.
- Negative bucket boundaries are not supported.
Percentiles
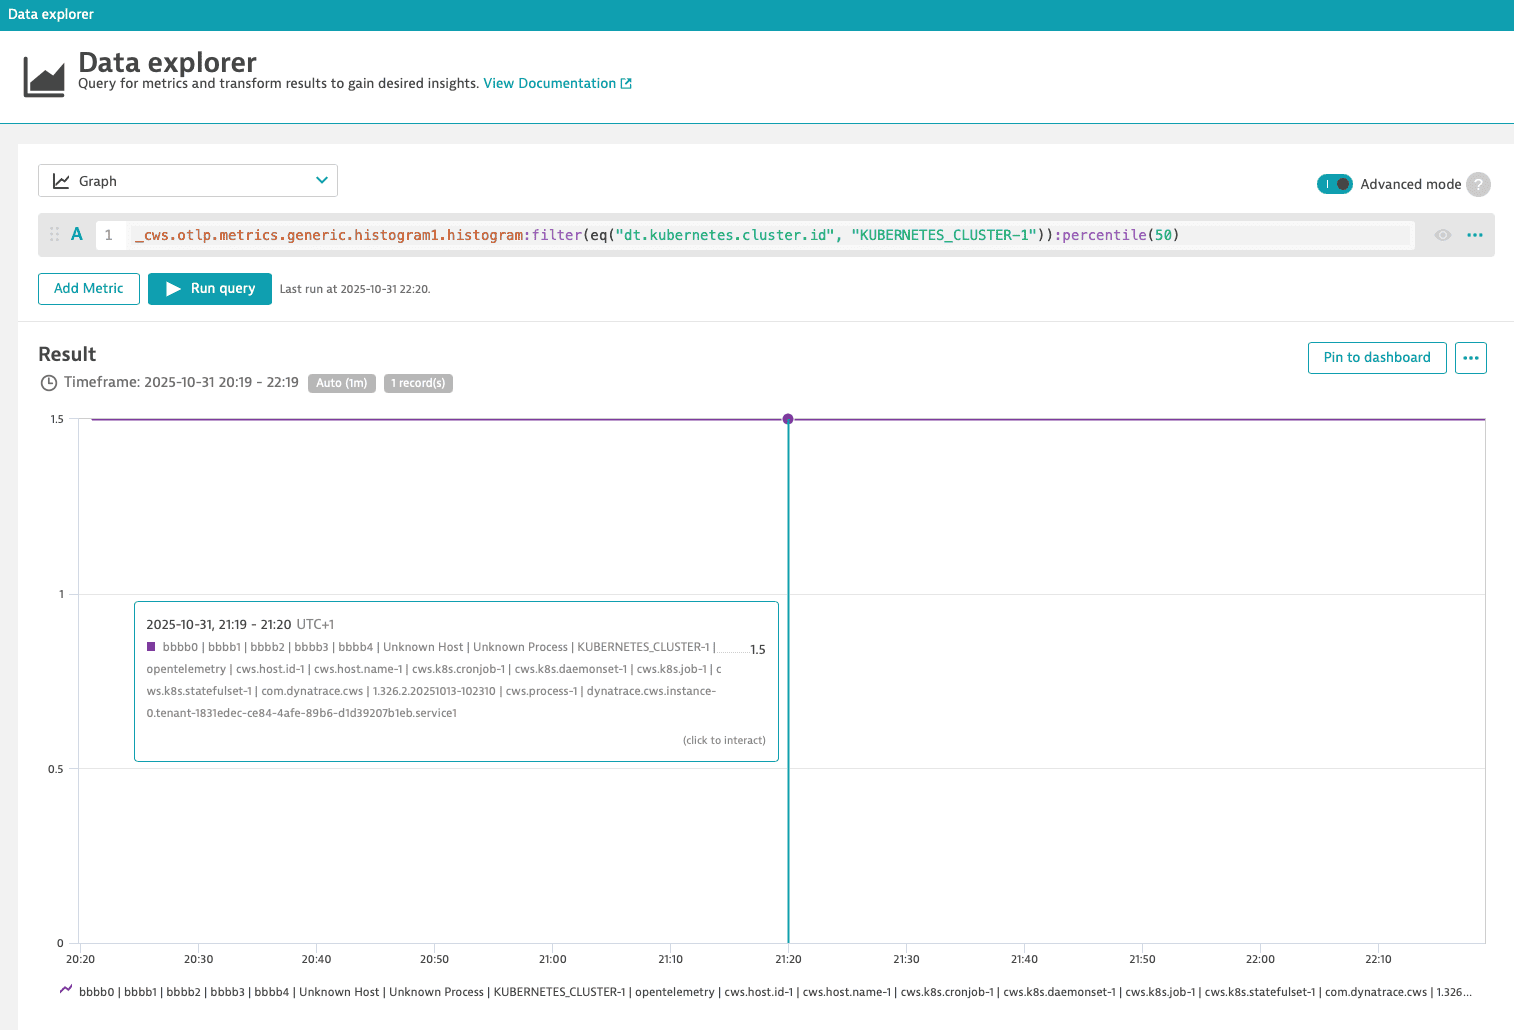
You can use the percentile transformation to extract a percentile from a histogram metric. For example, you can extract the median using percentile(50).
The final query looks like this:
_cws.otlp.metrics.generic.histogram1.histogram:filter(eq("dt.kubernetes.cluster.id", "KUBERNETES_CLUSTER-1")):percentile(50)
