AI model versioning and A/B testing
- Latest Dynatrace
- Tutorial
- 5-min read
In the context of AI models, A/B testing is crucial for assessing the impact of changes to training dataset, vector databases, algorithms, features, or configurations on key performance metrics, such as accuracy, user engagement, or revenue. By exposing different segments of users to each variation and analyzing their interactions, A/B testing provides data-driven insights into which version of specific models delivers better outcomes. This method ensures that updates to AI models are grounded in measurable improvements, minimizing risks and optimizing results in real-world applications.
What you will learn
In this tutorial, we first explore the existing ready-made dashboard available. Afterward, we configure your application to send additional metadata. Finally, we adapt the dashboard to slice and dice the data based on the metadata.
Steps
The general steps are as follows:
- Explore the current dashboard
- Configure your application to send custom metadata
- Adapt the existing dashboard
See below for the details of each step.

Explore the current dashboard

Configure your application to send custom metadata

Adapt the existing dashboard
Explore the current dashboard
As part of  AI Observability, we provide a ready-made dashboard.
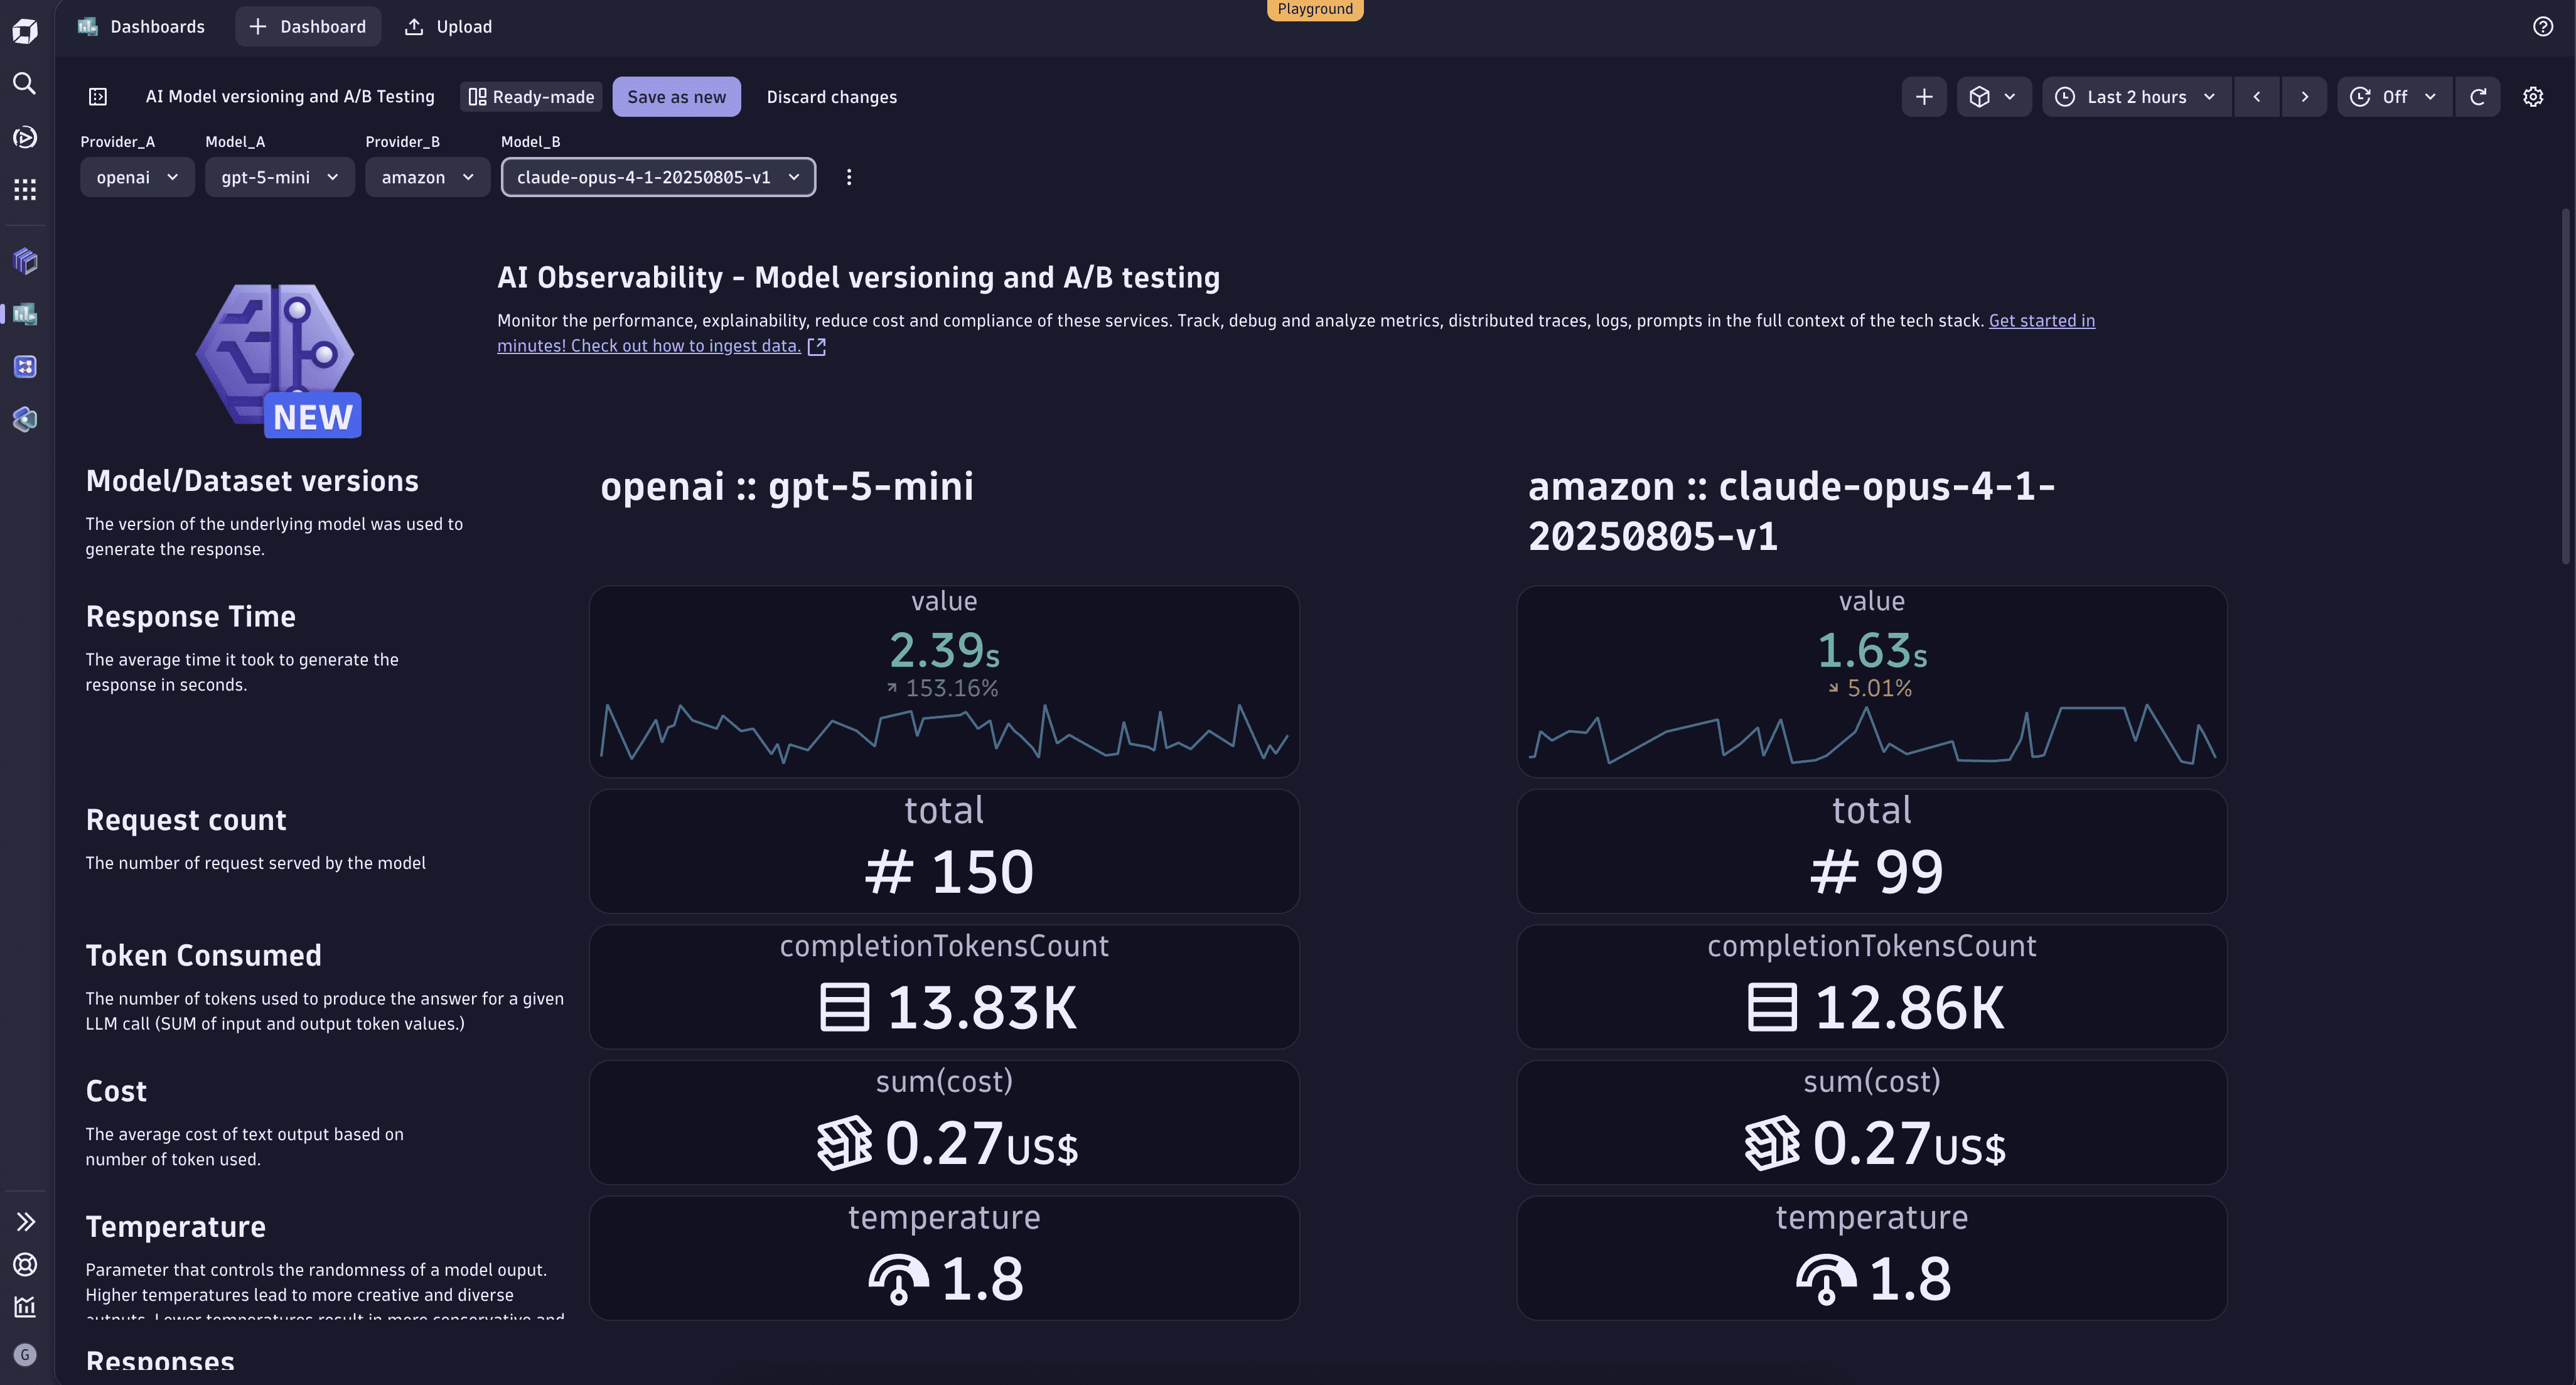
The dashboard allows you to select different providers and models and compare them. This permits evaluating their performance across key metrics such as response time, request count, token consumption, cost, and temperature settings. Furthermore, scrolling down, it is possible to analyze how the different models responded to the same prompt, making it crucial to identifying regressions.
This dashboard provides charting of real-time data and trend visualization, allowing for tracking performance
fluctuations over time, which is crucial for making data-driven decisions when selecting or optimizing
AI models for production use. An improvement is to track custom metadata, for example, the name of the
training dataset for fine-tuning, or attach business metrics, such as satisfaction, through
the classic  and
and  buttons.
Let's see how you can push your custom data to Dynatrace.
Configure your application
You application should be already instrumented following the Get Started guide. Now, we can adapt it to propagate additional metadata. For this, we leverage OpenTelemetry and their APIs.
In AI/ML and LLM workflows, it’s crucial to track the metadata associated with model training and validation. This includes details such as the model version, training dataset ID, or hyperparameters used. By propagating this information, you can correlate training runs with their subsequent performance in production, enabling faster debugging and better insights into model behavior.
For instance, let's attach the training metadata (for example, model version and dataset ID) to every trace. Here's how you can modify your application instrumentation:
from traceloop.sdk import Traceloopheaders = { "Authorization": "Api-Token <YOUR_DT_API_TOKEN>" }Traceloop.init(app_name="<your-service>",api_endpoint="https://<YOUR_ENV>.live.dynatrace.com/api/v2/otlp", # or OpenTelemetry Collector URLheaders=headers,resource_attributes={'model.version': os.getenv('MODEL_VERSION'),'dataset.id': os.getenv('DATASET_ID'),})
The resource_attributes parameter maps the attributes passed into OpenTelemetry Resource Attributes. Hence, these properties are attached to all signals reported to Dynatrace.
This is useful for metadata that is static. However, in some cases, we want to attach information that is request-specific, such as the value of a feature flag during an experiment. For this, we can leverage OpenTelemetry and create a span containing the attributes of the request.
from opentelemetry import tracedef handle_request():...with trace.get_tracer("my-awesome-app").start_as_current_span(name="handle_request") as span:span.set_attribute("feature_flag.key", "my-new-feature-enabled")span.set_attribute("feature_flag.result.value", "true")# rest of the handling logic...
Adapt the existing dashboard
Before we can change the dashboard, let's create a copy of the existing one. To duplicate a dashboard, open the menu next to the dashboard name and select Duplicate.
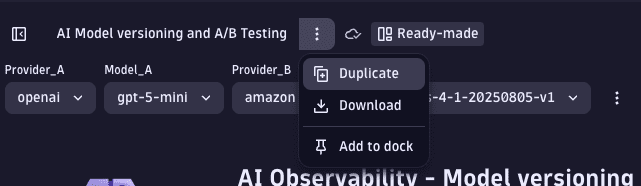
This creates a copy of the ready-made dashboard that can be freely edited. Now we can add some variables to filter the data for model version and dataset ID. To add variables to a dashboard, open the menu next to the list of variables and select Variable. For details on adding variables, see Add a variable to a dashboard.
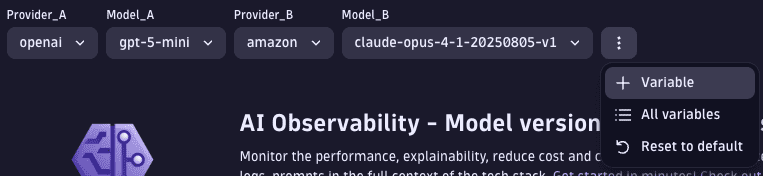
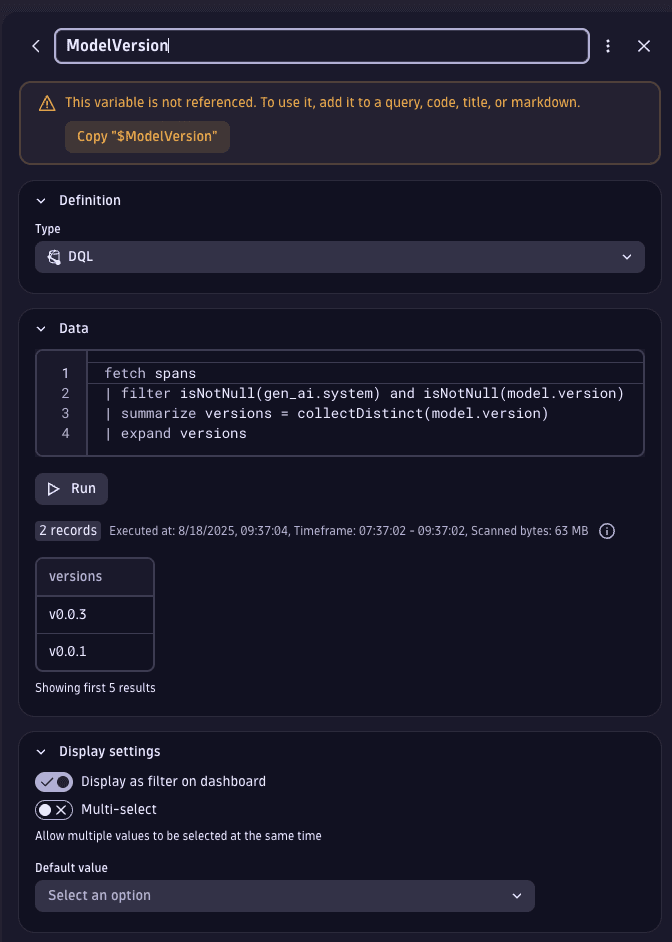
We can add the first variable for model version. Let's call it ModelVersion and use DQL as type
definition. Finally, let's use the following DQL statement to populate the possible values for the variable:
fetch spans| filter isNotNull(gen_ai.system) and isNotNull(model.version)| summarize versions = collectDistinct(model.version)| expand versions
The query fetches all spans that have a value for the attributes gen_ai.system and model.version.
The attribute model.version is the one that we manually added in the previous step.
The gen_ai.system attribute is set for all spans that are AI-related.
Then, we collect all the distinct values for the attribute model.version.
Finally, we tell DQL to consider each value of model.version as an individual value to populate the
drop-down menu of the variable using the expand command.
Select Run to verify that the correct values are fetched.
The end result should look like this:
Now, we can use $ModelVersion as a variable in DQL and it will be populated with the value selected from the drop-down menu.
We can change the existing tiles to ensure that the new variable is used to filter your data correctly
by adding a new filter statement:
| filter model.version == $ModelVersion
And that's it! Now you can add more variables to filter your data using further custom metadata.