Configure a NAM monitor
With network availability monitors (NAM), you can check the availability of your hosts, devices, and services.
There are three types of NAM monitors: ICMP, TCP, and DNS. To learn more about them, see NAM types. You can create and manage NAM monitors via API or web UI.
NAM setup
With NAM monitors, you can include more than one step.
- Each step can contain one or multiple requests.
- Like for HTTP and browser monitors, steps are executed sequentially.
- Unlike for HTTP and browser monitors, NAM monitors can contain multiple requests within a single step. All requests assigned to a particular step are executed in parallel. If one request fails, it doesn't affect the execution of other requests within that step.
- A step is skipped if nothing matches its definition in a monitor configuration. For example, when a tag is specified in the target filters list but nothing matches the tag.
- Concept of requests executed in parallel exists for NAM monitors only
For example, if you want to monitor a group of 4 hosts with an ICMP test, you want to apply the same conditions (such as frequency, location executing test, and number of packets) for each host from your group.
NAM offers you the possibility of addressing this in multiple ways:
-
You can define 4 separate tests, one per host. The benefit of this approach is that Dynatrace triggers a separate problem for each host and you can assign separate notifications for each one. You can also adjust test parameters for each host separately.
-
You can define a single test with 4 requests (within 1 step). The same ICMP checks are executed, but there will be differences in reporting and alerting. The number or percentage of hosts that are down is reported with the Requests Success rate metric. You can configure a customized threshold for failing the whole monitor. For example, if it's OK that 1 out of 4 hosts is down, because of rolling out an update, you can define it on the
>=75%level. There's always a single problem generated for a monitor, yet still, it contains detailed info about hosts that don't respond. Another benefit of this approach is easier maintenance (adjusting single setting for all 4 hosts).Finally, filters offer defining tests against dynamically changing structure, for example if you want to define ICMP tests against a given host group, you don't need to adjust the NAM monitor test after the host group configuration change.
You need to define constraints for each monitor. Constraints are conditions that need to be met to consider the monitor’s execution successful. It is obligatory to define the Success rate constraint. See Step-level constraints to learn more.
Manage NAM monitors with API
To manage your NAM monitors via REST API
-
Search for and select Dynatrace API.
-
In the Select a definition field, select Synthetic - Network availability monitors.
-
Authenticate with your API token.
-
Perform one of the following actions.
To do this Go to Synthetic - Network availability monitors and select this Get all synthetic monitors GET /synthetic/monitors Create a synthetic monitor definition POST /synthetic/monitors Delete a synthetic monitor definition for the given monitor ID DELETE /synthetic/monitors/{monitorId} Get all synthetic monitor definition for the given monitor ID GET /synthetic/monitors/{monitorId} Update a synthetic monitor definition for the given monitor ID. PUT /synthetic/monitors/{monitorId}
See Synthetic monitors API v2 for more details.
Manage NAM monitors using web UI
Managed version 1.302+
Although we highly recommend using the API to manage NAM, you can use a simple web UI to test NAM capabilities. Creating a NAM monitor with the web UI allows you to quickly configure single monitors without direct interaction with the API.
The UI for creating NAM in Managed relies on key-value pairs. For full web UI support for network availability monitors, you need Dynatrace SaaS.
Besides creating NAM monitors using UI, you can also delete monitors or modify their configuration.
Create a Network Availability Monitor
To create a NAM monitor using the web UI
-
In your Dynatrace Managed environment, go to Digital Experience > Synthetic.
-
Below the number of Synthetic monitors at the top of the page, select List of Network Availability Monitors is available here.
-
Select Create a Network Availability Monitor.
You need to Save changes for each step of the NAM configuration. Otherwise, the changes will be discarded.
1. Monitor name
-
On the Monitor name tab, set your Monitor name.
-
Select Save changes.
2. Configuration
-
Optional On the Configuration tab, enter a Monitor description.
-
Select Add step and set Step name to any name you like.
-
Select Request type from the list. For example,
ICMP. -
Select Add IP address or DNS name to define the target of your monitor. For example,
1.1.1.1orcommunity.dynatrace.com. To add another target address, select Add IP address or DNS name again. -
Optional Set Target filter. To learn more about available target filters, see Target filter.
-
Optional Select Add configuration property and fill out the Configuration properties key-value pair. For details, see Configuration properties. To add another configuration property, select Add configuration property again.
Configuration property key-value example
- Property key:
ICMP_PACKET_SIZE - Property value:
32
- Property key:
-
Required Select Add step-level constraint and set Constraint type to
SUCCESS_RATE_PERCENT. Step-level constraint applies the condition for successful monitor execution on the step level and includes all requests made within the step. For details, see Step-level constraints. -
Select Add property twice to create two property key fields and fill them in similarly to the following example:
Property key Property value operator
=value
100The operator and value keys are case-sensitive and have to be written in lower case. Otherwise, the configuration will not work.
Configuration property operator example
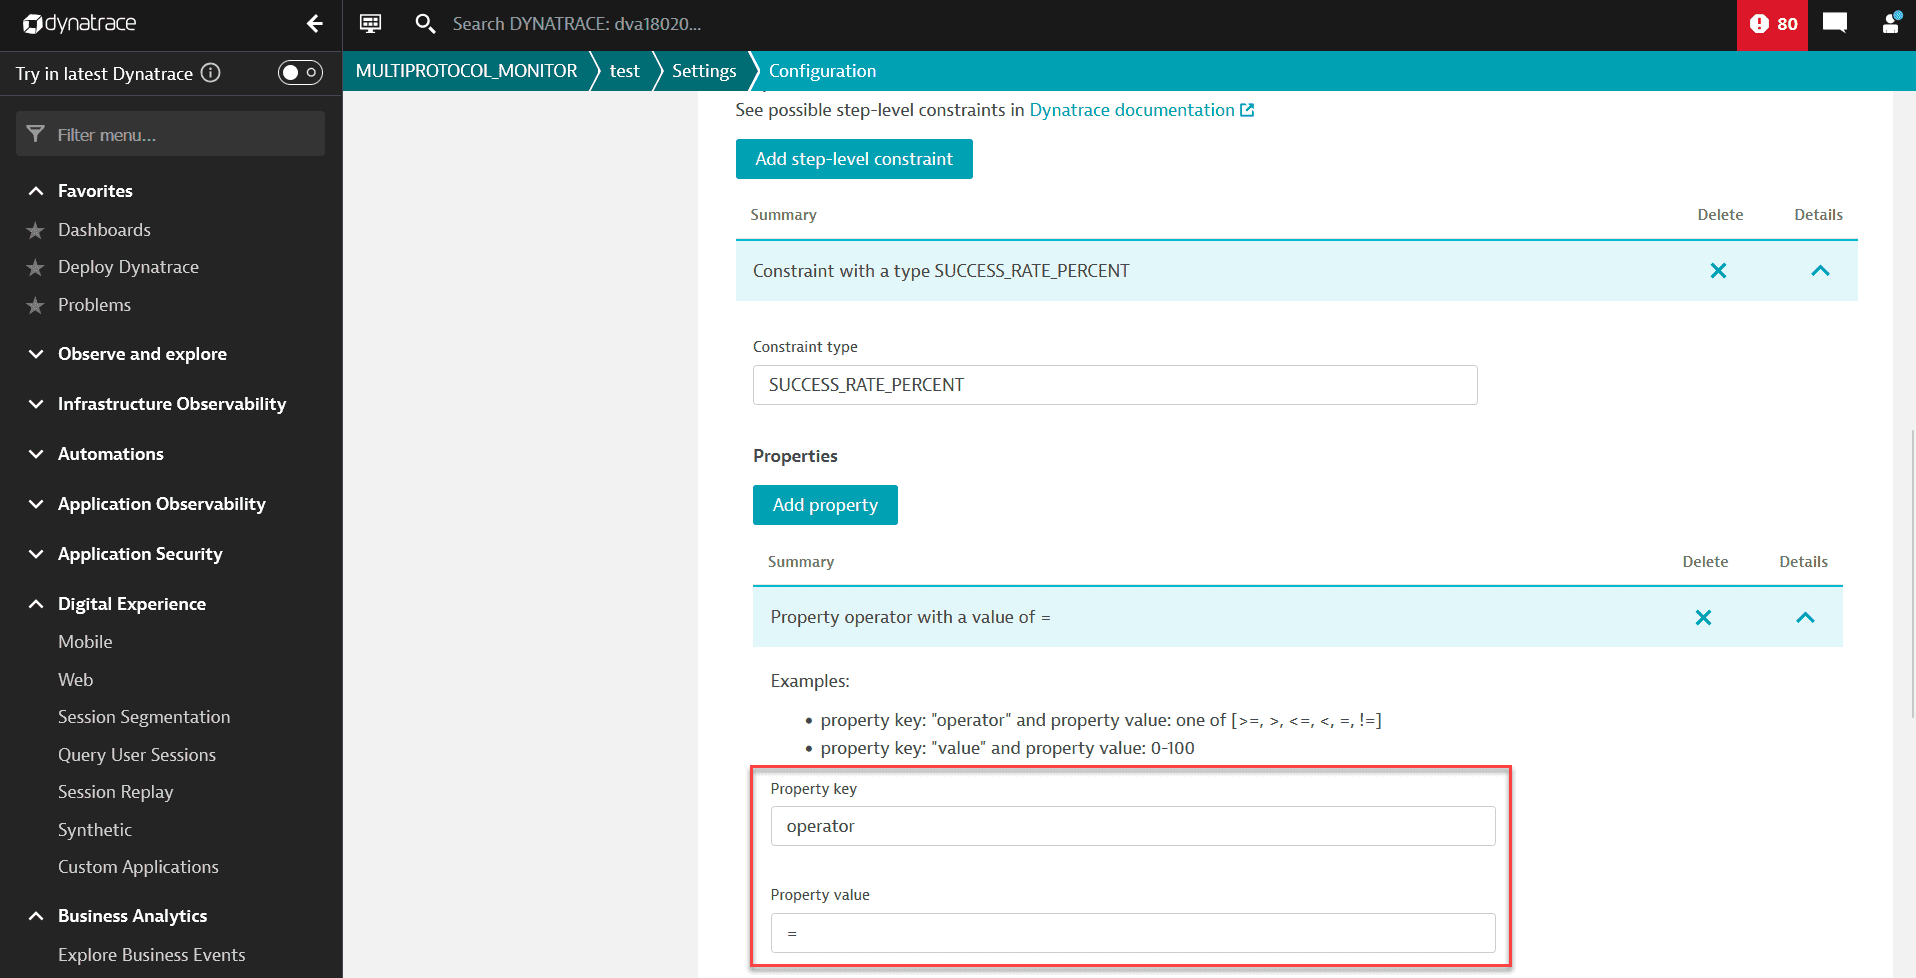 Creating NAM with Managed web UI, step-level key operator example
Configuration property value example
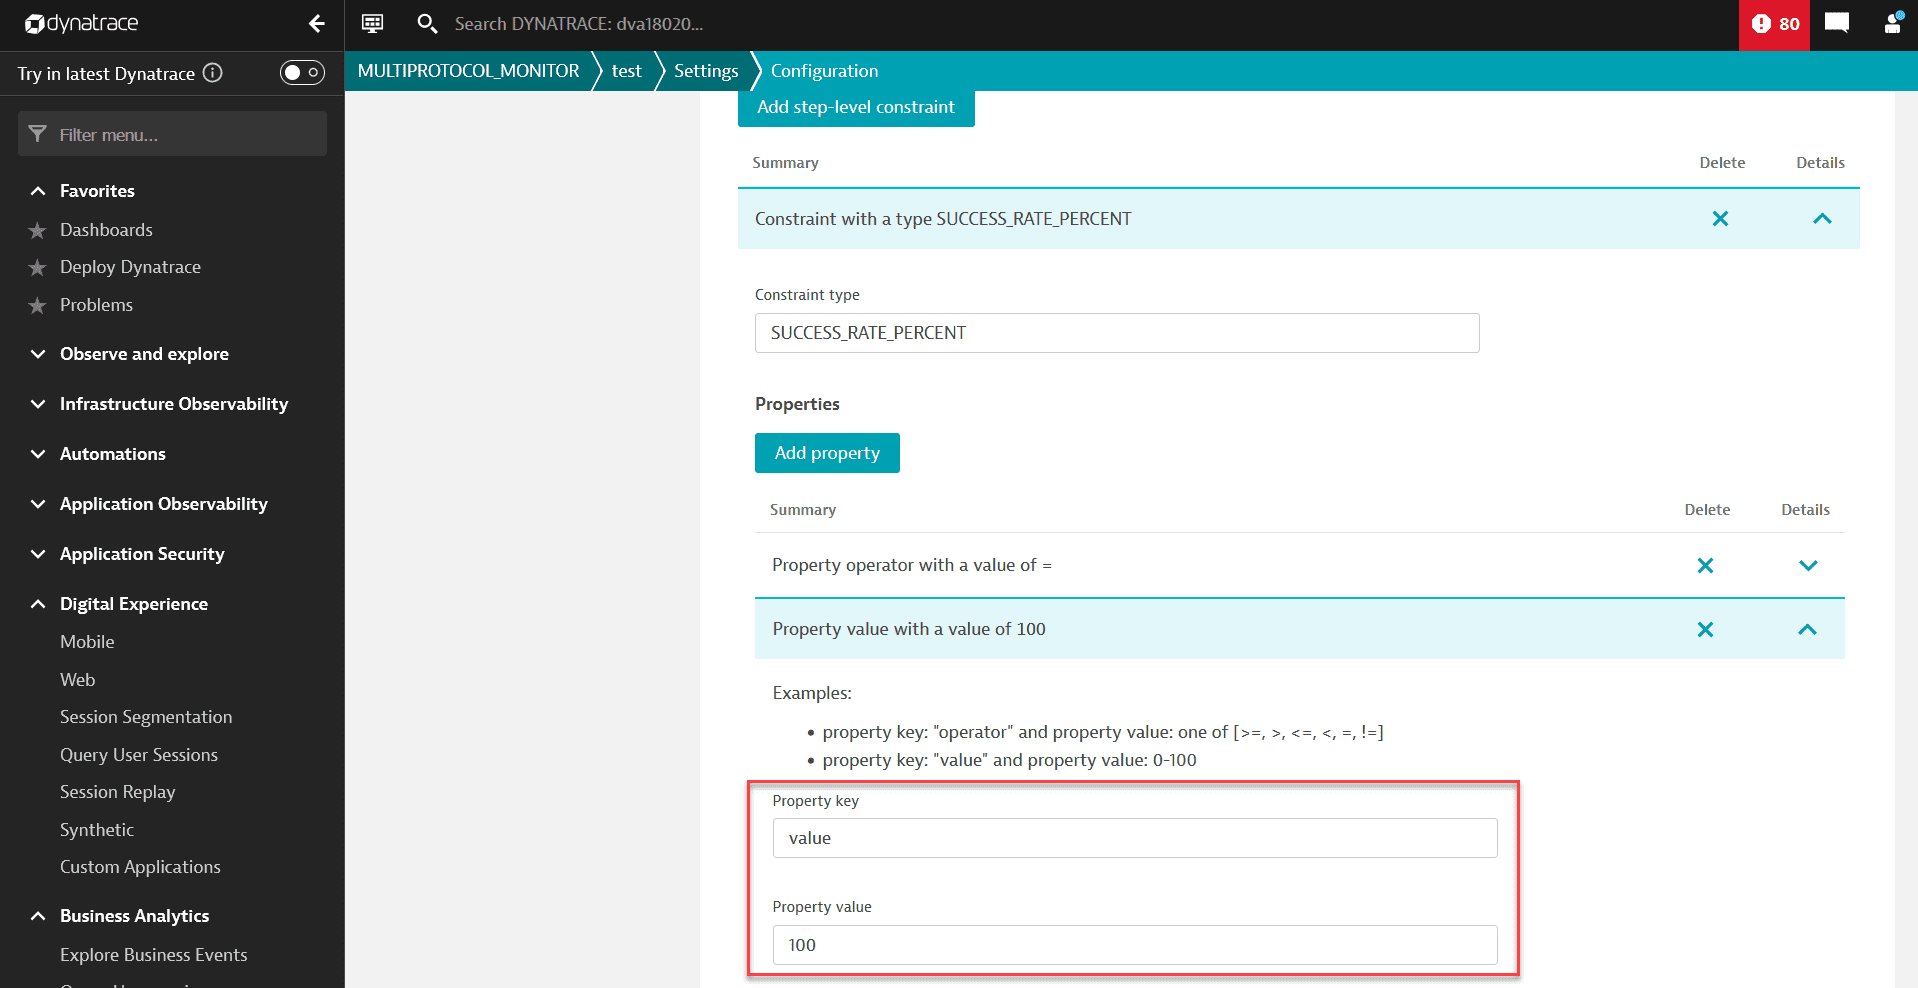 Creating NAM with Managed web UI, step-level value property example
 -
Required Select Add request-level configuration.
Steps from 10 to 12 are mandatory only for ICMP and DNS monitors. You can skip these steps and leave Request configuration empty if you have a different type of monitor.
-
Select Add constraint.
-
Set Constraint type to one of the available request-level constraints, for example,
ICMP_SUCCESS_RATE_PERCENT. For details, see Request-level constraints.
Request-level ICMP constraint example
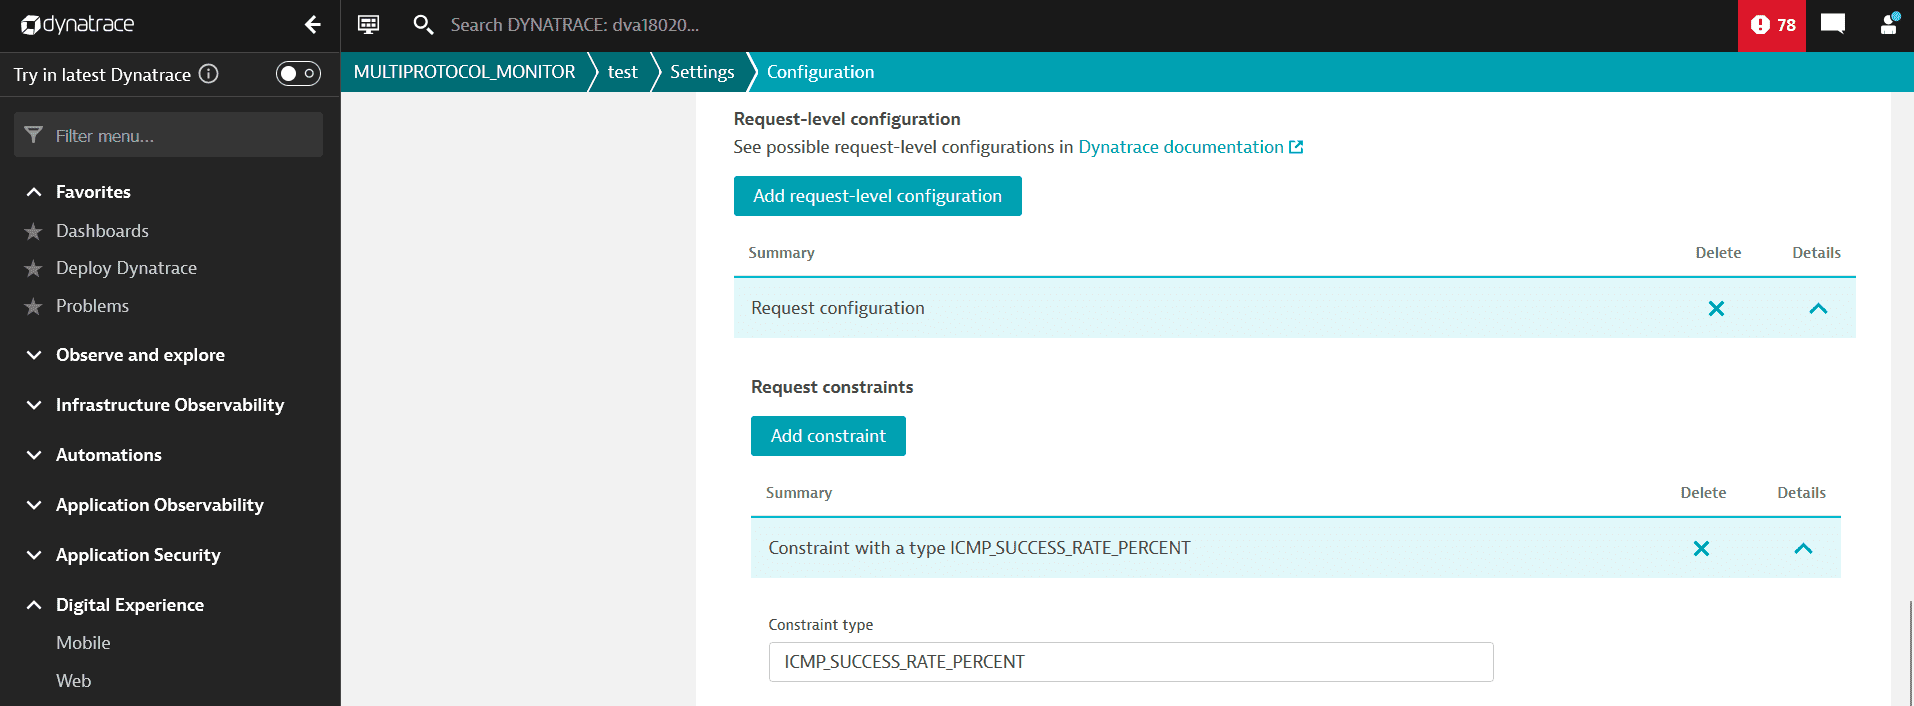
The selected monitor type determines the constraint types from which you can choose. For example, if you selected ICMP monitor, you can only choose ICMP-related constraints.
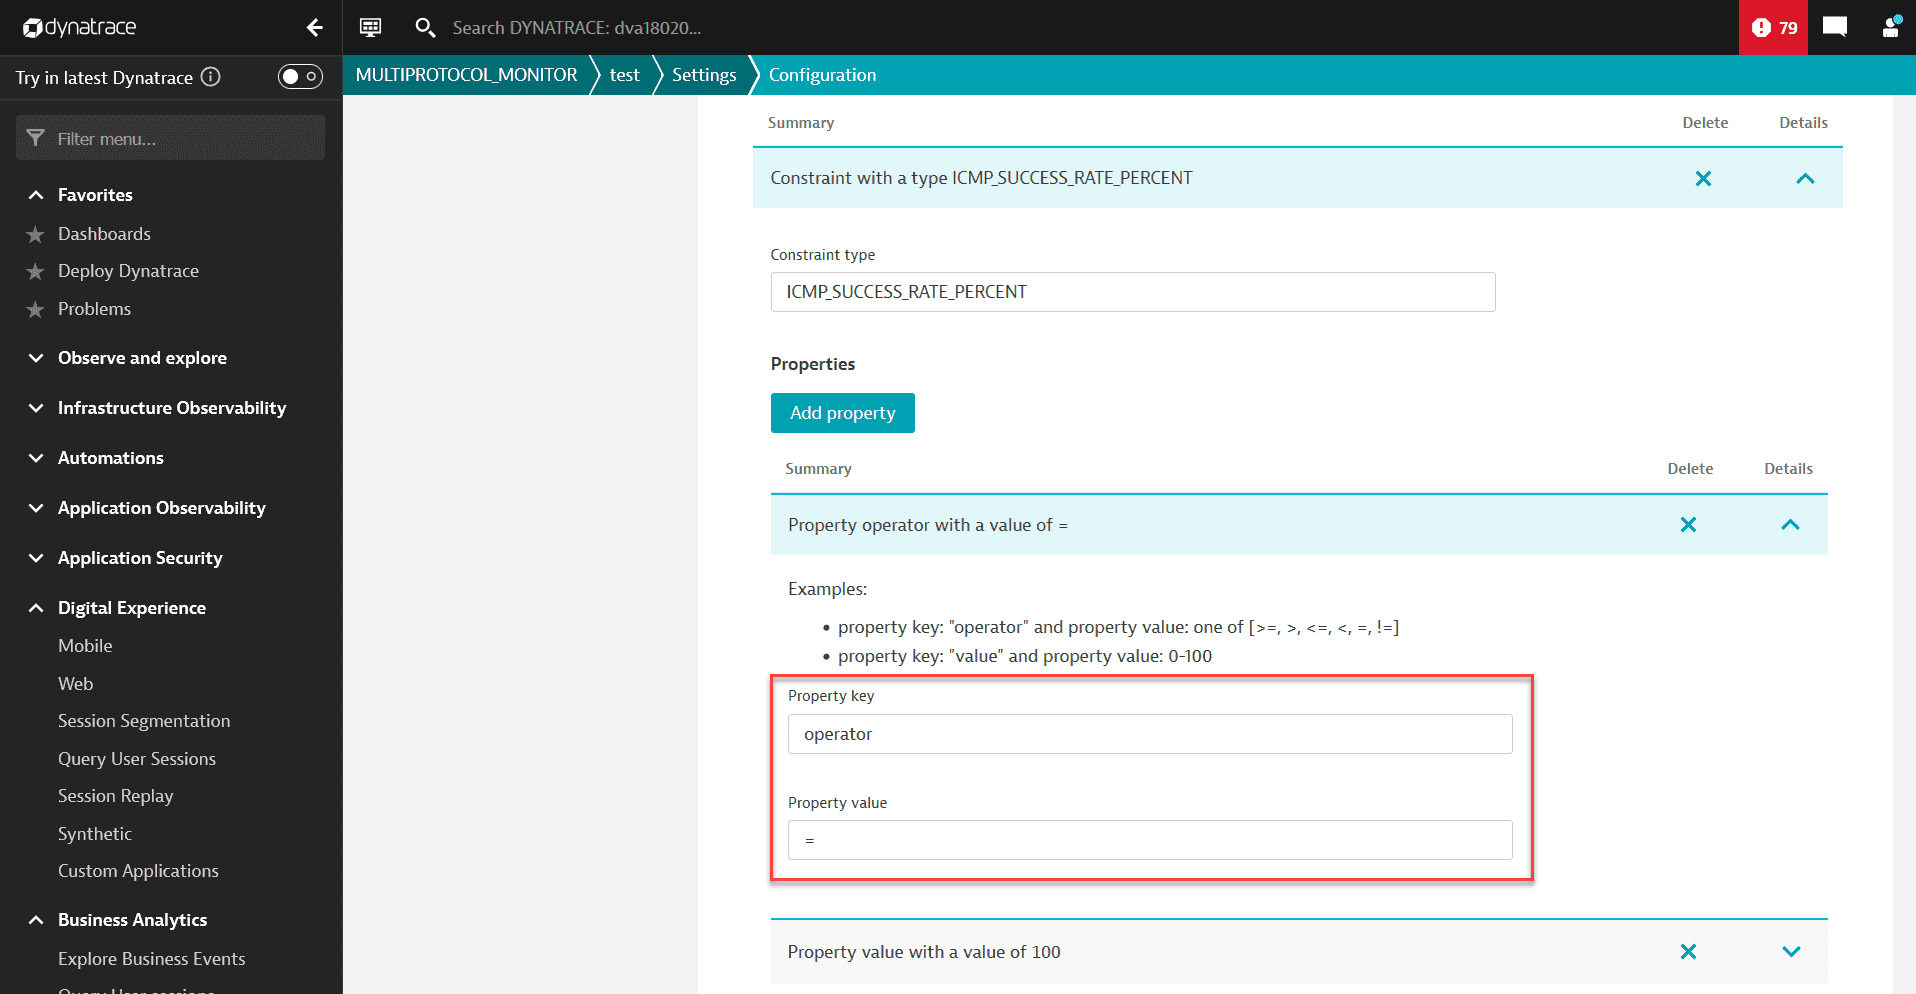
- Select Add property twice to create two property key fields and fill them in similarly to the following example:
Property key Property value operator
=value
100The operator and value keys are case-sensitive and have to be written in lower case. Otherwise, the configuration will not work.
Configuration property operator example
Configuration property value example

- Select Save changes.
3. Frequency and locations
NAM monitors are supported on private locations only.
- On the Frequency and locations tab, choose the desired Frequency and Location from available options.
- Select Save changes.
4. Outage handling
- On the Outage handling tab, choose whether you want to generate a problem and send an alert if the monitor is unavailable at all locations. Next, in Alert if all locations are unable to access my target address choose one of the available options. Turn off Generate a problem and send an alert when the monitor is unavailable at all configured locations if you don't want to be alerted.
- Turn on Generate a problem and send an alert when the monitor is unavailable for one or more consecutive runs at any location if you want to be alerted when the monitor is unavailable at any of the locations. Next, choose the number of locations and the number of times the monitor should be unavailable.
- Select Save changes.
5. Performance thresholds
- Optional On the Performance thresholds tab, turn on Generate a problem and send an alert on performance threshold violations you want to be alerted on about the performance problems.
- Optional Select Add threshold.
- Optional Keep the default settings or apply your threshold and aggregation type.
- Select Save changes.
Edit a Network Availability Monitor
To edit a NAM monitor using the web UI
-
In your Dynatrace Managed environment, go to Digital Experience > Synthetic.
-
Below the number of Synthetic monitors at the top of the page, select List of Network Availability Monitors is available here.
-
Select the monitor you wish to edit.
-
Choose Edit in the top right corner.
-
Follow the steps described in Create Network Availability Monitor.
Delete a Network Availability Monitor
Managed version 1.308+
To be able to delete a NAM monitor, you need to have permissions to edit all schemas connected to the monitor.
To delete a NAM monitor using the web UI
-
In your Dynatrace Managed environment, go to Digital Experience > Synthetic.
-
Below the number of Synthetic monitors at the top of the page, select List of Network Availability Monitors is available here.
-
Select the monitor you wish to delete.
-
Choose Delete in the top right corner.
-
The message "Are you sure you want to delete network availability monitor
monitor name?" will appear. Select Delete.- If the action is successful, you'll see the message "Network availability monitor
monitor namesuccessfully deleted." - If the action failed, you'll see the message "Failed to delete network availability monitor
monitor name." A failure might occur if the monitor has already been deleted by another user.
- If the action is successful, you'll see the message "Network availability monitor
Target filter
Target filter gives an option to filter hosts monitored by Dynatrace or custom devices having IP addresses. With this filter, you can select those two types of targets based on:
- type (
type) - tags (
tag) - host ID (
hostId) (deprecated, works for hosts only, use entity ID instead) - entity ID (
entityId) - host groups (
hostGroup) - management zones (
managementZone) - IP mask (
ipMask) - IP range (
ipRange) - process group instance (
processGroupInstance) - network interfaces of particular custom device (
interfacesOf) - extension name (
extensionName)
IP range and IP mask are filters for hosts or devices known for the Dynatrace server, not an option to scan the network.
Syntax
- Logical operators:
ANDandOR(case insensitive) - Parentheses
- Expression operators:
==and!= - Tag names and values
- Negation ("not"):
!=. - Wildcard:
*(selects all hosts monitored by Dynatrace)
Examples
tag == tagname or hostGroup == group1(tag == tagname1:tagvalue1 or tag == tagname1:tagvalue2) and (hostGroup == group1 or managementZone == zone1)tag != tagname1 and tag != tagname2:tagvaluetag == tagname:tagvalue and (managementZone == zone1 or managementZone == zone2)tag == "[tagwithbrackets and spaces]":"value, with, commas, and, spaces"ipMask == 127.0.0.1/24hostId == HOST-000123type == CUSTOM_DEVICE and ipMask == 172.17.0.2/24entityId == HOST-045BFCDA3F507D30 or entityId == CUSTOM_DEVICE-13081D4B74B3E2C8type == HOST and processGroupInstance == PROCESS_GROUP_INSTANCE-07611353BB98908Ctype == CUSTOM_DEVICE and interfacesOf == CUSTOM_DEVICE-E1A88946BF04D5E7type == CUSTOM_DEVICE and extensionName == "Docker devices"
Available script configuration properties
Optional
Monitors consist of requests, always of the same type (ICMP, TCP, or DNS).
If you don't provide the value, defaults will apply.
Duration format examples
- 100 milliseconds =
PT0.1S - 500 milliseconds =
PT0.5S - 1 second =
PT1S - 10 seconds =
PT10S - 90 seconds =
PT1M30S - 1 minute =
PT1M - 2 minutes =
PT2M - 5 minutes =
PT5M
ICMP
| Name | Type | Description | Values | Default value |
|---|---|---|---|---|
| string:duration | Timeout for the execution of a single request. | Valid duration, for example, Range = |
|
| integer | Number of echo requests. The equivalent of the ping process are the | Range = |
|
| integer | Data length. The equivalent of the ping process are the | Range = |
|
| integer | Time to live (TTL). The equivalent of the ping process are the | Range = | |
| integer | Type of service. The equivalent of the ping process are the | Range = | |
| boolean | Do not fragment. The equivalent of the ping process are the |
| |
| string:duration | Wait for the echo reply message. The equivalent of the ping process are the | Valid duration, for example, On Linux, values like Range = |
|
The packet transmission interval is hardcoded to 200ms, which corresponds to the minimum value allowed for the -i option of the Linux ping command without requiring elevated privileges.
TCP
| Name | Type | Description | Values | Default value |
|---|---|---|---|---|
| string | Comma-separated list of port ranges A single range can be either a single port number or a range of ports, defined as two port numbers with a hyphen. The final list of requests to be executed is the product of all defined ports and target hosts. For example, if a step has two target hosts (
| Sample values
| |
| string:duration | Connection timeout | Valid duration, for example, Range = |
|
DNS
| Name | Type | Description | Values | Default value |
|---|---|---|---|---|
| string | Comma-separated list of DNS record types. The final list of requests executed is the product of all defined record types and target hosts. For example, if a step has two record types (
| Sample values
| |
| string:duration | Connection timeout | Valid duration, for example, Range = |
|
| string | Address of the DNS server to query, with optional port If a hostname is provided, it's resolved to an IP address using the system default DNS server. | Valid address, such as:
| If only host is provided, the default port If no value is provided, the system default DNS server and port are used. |
| boolean | By default, the DNS server is queried over a UDP connection, unless the message is too large to fit the UDP datagram. This option allows you to specify a TCP connection instead. |
|
|
Script configuration constraints
Constraints are conditions that need to be met to consider monitor’s execution successful. You need to define constraints for each monitor.
Step-level constraints
SUCCESS_RATE_PERCENT
Required
This is an obligatory constraint for all monitors' request success rate. The default value is >=80%.
Percentage of successful requests in a step.
Actual success rate = ratio of the number of requests that didn't fail to all requests.
For example, if 1 request out of 6 has failed, the ratio is (6-1)/6 = 83.33%.
| Property | Type | Description | Value | Default value |
|---|---|---|---|---|
operator | string | Comparison operator to compare actual and expected value | >=, >, <=, <, =, or != | >= |
value | integer | Expected value of success rate to use for comparison | Range = 0–100 | 80 |
{"type": "SUCCESS_RATE_PERCENT","properties": {"value": "80","operator": ">"}}
For requests with only one target, we suggest setting the constraints values to 100.
Request-level constraints
ICMP request constraints
ICMP_SUCCESS_RATE_PERCENT
Required
This is an obligatory constraint for ICMP monitors request success rate. The default value is >=80%.
Percentage of successful pings (echo requests) in a request.
Actual success rate = ratio of number of the packets received to number of packets sent.
For example, if 5 packets were sent and 4 packets were received, the ratio is 4/5 = 80.00%.
| Property | Type | Description | Value | Default value |
|---|---|---|---|---|
operator | string | Comparison operator to compare actual and expected value | >=, >, <=, <, =, or != | >= |
value | integer | Expected value of success rate to use for comparison | Range = 0–100 | 80 |
{"type": "ICMP_SUCCESS_RATE_PERCENT","properties": {"value": "80","operator": ">"}}
TCP request constraints
TCP_PORT_UNREACHABLE
Optional
This is an optional constraint for TCP monitors. This is a special constraint that inverts the execution status for TCP requests. It should be applied if it's expected that the port being checked is unreachable.
This constraint has no configuration properties.
If this constraint is applied:
- When the
Execution timeout (12033)andTCP socket connection error (22000)statuses are detected after performing a connection attempt, they are interpreted asHEALTHY (0). - The
HEALTHY (0)connection status is interpreted asCONSTRAINT_VIOLATED (1401)because we expected a failure. - The
UNEXPECTED_ERROR (-1)andUNKNOWN_HOST (12013)statuses are preserved and reported as is.
{"type": "TCP_PORT_UNREACHABLE","properties": {}}
DNS request constraints
DNS constraints are optional, but at least one must be defined to indicate what is a successful query.
DNS_STATUS_CODE
DNS_STATUS_CODE by default is 1, having status code =0 is the simplest example of a successful query.
| Property | Type | Description | Value | Default value |
|---|---|---|---|---|
operator | string | Comparison operator to compare actual and expected value | = or != | = |
statusCode | integer | Numeric code indicating status of DNS response Exclusive with status | Valid code, for example, 0Range = 0–65535 | 0 |
status | string | Mnemonic representing DNS status code Exclusive with statusCode | Valid status, for example, NOERROR | NOERROR |
{"type": "DNS_STATUS_CODE","properties": {"operator": "=","statusCode": "0"}}
{"type": "DNS_STATUS_CODE","properties": {"operator": "=","status": "NOERROR"}}
DNS_IP_ADDRESS
Verifies the IP address value returned in A/AAAA records.
| Property | Type | Description | Value | Default value |
|---|---|---|---|---|
quantifier | string | How many records must match the condition for the constraint to pass | any (at least one) or all | any |
operator | string | Comparison operator | =, != or in | = for an address, in for a subnet |
recordType | string | DNS record type | A or AAAA | A if address/subnet is IPv4AAAA if address/subnet is IPv6 |
address | string | IPv4 address in dot notation or IPv6 address in colon notation Only with the operators =, !=Exclusive with subnet | Valid address, for example, 192.168.0.1, 2001:db8::2:1 | |
subnet | string | IPv4 subnet in dot notation or IPv6 subnet in colon notation, followed by network prefix length Only with the operator inExclusive with address | Valid subnet, for example, 172.22.80.0/20, 2001:db8:85a3::0/48 |
{"type": "DNS_IP_ADDRESS","properties": {"quantifier": "any","recordType": "A","operator": "=","address": "54.208.9.71"}}
{"type": "DNS_IP_ADDRESS","properties": {"quantifier": "all","recordType": "A","operator": "in","subnet": "10.102.44.0/24"}}
DNS_RECORD_COUNT
Verifies the count of records of a given type.
| Property | Type | Description | Value | Default value |
|---|---|---|---|---|
operator | string | Comparison operator | >=, >, <=, <, =, or != | > |
recordType | string | DNS record type | Valid record type, for example, MX | |
value | integer | Expected record count | Valid count, for example 2 Range = 0–65535 | 80 |
{"type": "DNS_RECORD_COUNT","properties": {"recordType": "A","operator": ">","value": "80"}}
DNS_TIME_TO_LIVE
Verifies the time to live (TTL) of records of a given type.
| Property | Type | Description | Value | Default value |
|---|---|---|---|---|
quantifier | string | How many records must match the condition for the constraint to pass | any (at least one) or all | any |
operator | string | Comparison operator | >=, >, <=, <, =, or != | > |
recordType | string | DNS record type | Valid record type, for example, NS | |
value | integer | Expected TTL in seconds | Valid TTL, for example 3600 Range = 0–2147483647 | 80 |
{"type": "DNS_TIME_TO_LIVE","properties": {"quantifier": "any","recordType": "A","operator": ">=","value": "80"}}
DNS_RECORD_VALUE
Verifies the raw value of records of a given type, with the value format depending on the record type.
Constraints process all records in a response, regardless of the section to which they belong (answer, authority, or additional).
| Property | Type | Description | Value | Default value |
|---|---|---|---|---|
quantifier | string | How many records must match the condition for the constraint to pass | any (at least one) or all | any |
operator | string | Comparison operator - contains checks if the record value contains a given sequence.- matches checks if record value matches a given pattern. | contains or matches | contains |
recordType | string | DNS record type | Valid record type, for example, TXT | |
sequence | string | Sequence of characters that the record value should contain Only with the operator containsExclusive with pattern | Non-empty sequence, for example, ms71815323 | |
pattern | string | Pattern to be matched against the record value, with * denoting 0 or more charactersOnly with the operator matchesExclusive with sequence | Non-empty pattern, for example, "v=spf1 include:* |
{"type": "DNS_RECORD_VALUE","properties": {"quantifier": "any","recordType": "TXT","operator": "contains","sequence": "ms71815323"}}
{"type": "DNS_RECORD_VALUE","properties": {"quantifier": "any","recordType": "TXT","operator": "matches","pattern": "\"v=spf1 include:*"}}