Adaptive traffic management for Dynatrace Managed
PurePath® distributed traces are end-to-end transactions captured by OneAgent. Each minute, a statistically relevant number of end-to-end distributed traces is captured within each monitored process. Each trace contains code-level and business insights derived from service-level calls to multiple tiers. Because each trace is captured fully and end-to-end, second- and third-level tiers often capture more total service calls than entry-point processes.
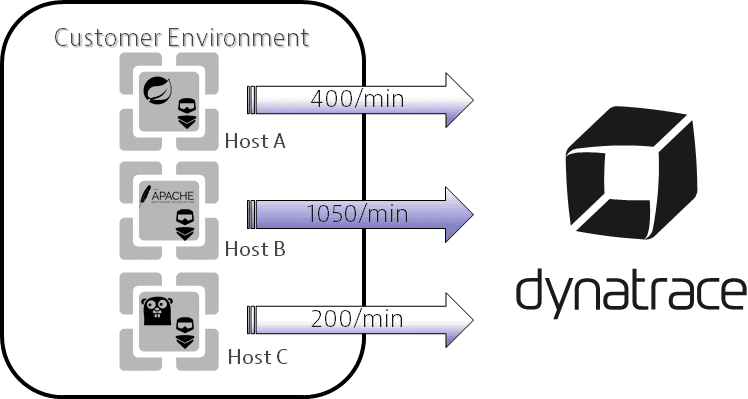
When the volume of transactions is high, capturing all traces can increase network bandwidth demands. OneAgent provides a built-in limiter to manage such cases. Each process monitored by OneAgent is allowed to start only a given number of distributed traces per minute. Once the quota is reached, the monitored traffic is used in the most effective way possible via the intelligent mechanism of Adaptive traffic management.
How is Adaptive traffic management different from other sampling mechanisms?
In typical applications, the distribution of requests is not even. It's rather a combination of: a large number of unique URLs, a medium number of important requests, and, finally, a few kinds of requests that make up the majority of the traffic (for example, image requests or status checks).
With Adaptive traffic management, OneAgent first calculates a list of top requests starting each minute, from which it then captures:
- Most traces of unique and rare requests.
- A significant but lower volume of highly frequent requests.
Because the sampling is not random, all important data is captured while maintaining a statistically valid sample set.
The following table represents a top-request calculation example, along with the respective capture rates.
Request
Number of requests processed by the application
Capture factor
Captured distributed traces
URI A
900
1/2
450
URI B
440
1/2
220
URI C
250
1
250
URI D
60
1
60
…50 other URIs
100
1
100
Total:
1500
1080
In this example, a bit more than 1,000 requests/min are captured by OneAgent, accordingly to the configured target number of request. Depending on the capture factor, URIs are captured each time (URIs C, D, and 50 other URIs) or only 50% of the time (URIs A and B). In this last case, requests are traced end-to-end by OneAgent over 600 times/minute.
You can see the effect of Adaptive traffic management in the distributed trace list. If OneAgent is sampling and not all requests are captured, then captured traces will point out that similar requests have not been captured with the message [amount] more like this in the distributed trace list.
In this way, OneAgent reduces the data sent to your environment, ensuring that the amount of captured traces stays within the limits of your Dynatrace agreement.
Using Adaptive traffic management to reduce the volume of processed data results in saving a lot of network bandwidth and, in the case of Dynatrace Managed environments, precious CPU, memory, network, and storage resources which would otherwise be required to process and store the additional data.
Quota per process
In Dynatrace Managed, the quota of new distributed traces/min that each process can send to Dynatrace is 1,000. Because traffic management depends on your application architecture, network traffic is limited for high-volume entry points (such as a load balancer or NGINX) and spikes might occur.
Adaptive capture control
You can manage the quota of new entry-point distributed traces captured per minute via Adaptive capture control, both on the environment level and per process or process group.
Adjusting adaptive capture control can help you in specific cases; for example, if a Dynatrace Managed environment for load testing consumes too many network, disk, and CPU resources, you'd instead use those resources for production monitoring. All analyses consider adjustments transparently without affecting service analysis features, except the distributed traces list or metrics.
To manage the quota of new distributed traces/min,
-
Go to Cluster Management Console > Environments and select your environement.
-
optional In the Cluster overload prevention settings, you can set the environment quota of Number of newly monitored entry point traces captured per process/minute. The default value is 1,000, however, the environment quota can be increased to 100,000.
-
Select Go to the environment.
-
Go to Settings > Server-side service monitoring > Deep monitoring > Adaptive capture control.
-
Select Global or Process group override.
You can reduce or increase the quota, respectively, to reduce the percentage of monitored incoming traffic or to ensure higher fidelity.
If your environment quota is set to 100,000 and you set adaptive capture control to the highest value, OneAgent is effectively instructed to capture all requests, even rare ones, within high-volume environments.
Setting the environment quota and adaptive capture control values too high can cause resource shortages and increase hardware expenditures.
Monitoring
You can use the preset dashboard OneAgent Traces - Adaptive traffic management to track usage and thresholds of Adaptive traffic management.
Adaptive load reduction
Adaptive load reduction is a dynamic mechanism that targets environments with a high volume of traffic compared to their assigned host units. Because Dynatrace Managed environments can process a limited number of service calls per minute (depending on the node CPU amount and memory availability), this is particularly helpful for managing sporadic spikes in the volume of processed distributed traces.
When the amount of service calls that an environment can process is breached, adaptive load reduction is triggered:
-
New incoming distributed traces are skipped in a random fashion, reducing gradually the number of processed distributed traces.
Note that service calls of full distributed traces already in progress are not targeted. -
The number of skipped distributed traces is taken into account to ensure stable statistical validity for all metrics, charts, baselining, and events.
-
You are informed about the reduction of processed data by
- An alert message in the Dynatrace web UI:
Server [amount] activated adaptive load reduction
- A message in the distributed trace list:
[amount] more like this
- An alert message in the Dynatrace web UI:
Adaptive load reduction safeguards your Dynatrace environment from sporadic traffic spikes.
While occasional activation (for example, to cover spikes) will not harm the fidelity of your monitoring data, consistent use for intervals of 15 minutes or longer can impact the accuracy of your monitoring data and metrics because not all data is processed.
Options include:
- Adding hardware and a new Dynatrace Managed cluster node to provide your Dynatrace Managed cluster with the necessary resources to process the additional data.
- Adjusting OneAgent settings to reduce the incoming traffic.
These options should be considered whenever statistical accuracy of data capture is insufficient.
Frequently asked questions
If your Dynatrace Managed cluster is undersized or if a specific request you're interested in comes from a high-volume tier (more than 1,000 requests/min), Dynatrace might not be able to capture the request.
-
You can increase the volume available for important requests by reducing the amount of traffic related to unimportant requests. To exclude unimportant requests from capture use web request attributes and URL exclusion rules.
-
You can also increase the quota of captured distributed traces.
The short answer is, not at all.
The shaping of traffic is accounted for transparently and done in a way that ensures statistical validity while capturing rare requests with high probability. All charts show the total real number of requests that your application processes, as does all ad-hoc analysis you might perform. You will not see a difference in charts or service call analysis data unless you're looking at a single distributed trace. Indeed, the only place where this traffic shaping is visible is in the distributed traces list, which displays a message like [number of traces] more like this.
No, adaptive traffic management focuses only on the number of traces. Neither service settings nor (global) request settings are modified by adaptive traffic management. Depending on the capture rate and sampling, a low-volume or unique request might not be captured. Service settings such as request naming rules and key request settings will apply only to captured traces.
Yes, in a few cases, as service monitoring metrics are based on captured traces. The following are some known effects.
- For low-frequency requests in high-volume environments, sampling and a low capture rate can impact the accuracy of metrics. Due to the low frequency of the requests, traces might be captured in a lower volume or not be captured at all. Consequentially some metrics values can't be collected. Note that this is reflected in service metric calculations to avoid distortions in charts.
- Because every single request is accounted for in charts with high resolution and in short timeframes, for high-volume services, sampling and a low capture rate might impact the accuracy of metrics such as request count or error count. Conversely, the accuracy will statistically be better in charts with low resolutions and long timeframes.