DDUs for metrics
- 17-min read
- Published Mar 30, 2021
This page explains how we calculate DDUs for metrics, the concept of custom metrics, and how you can estimate and track DDU consumption for metrics.
Which types of metrics consume DDUs?
- Custom metrics
- Certain built-in metrics (see below)
What is a custom metric?
Custom metrics are metrics that you define or install. They extend the value of Dynatrace monitoring capabilities by enabling you to integrate third-party data sources, calculate custom metrics, import metrics via API, leverage extensions, and more.
Following is a non-exhaustive list of custom metric types:
- All API-ingested metrics
- Calculated service metrics, custom DEM metrics, and log metrics
- For example, calculated service metrics created upon request attributes
- All metrics provided by manually installed Dynatrace Monitoring Extensions
For full details on the setup and ingestion of custom metrics in Dynatrace, see Metric ingestion.
Which built-in metrics consume DDUs?
Metrics that consume DDUs include:
- Metrics provided by certain built-in extensions that are not enabled by default
- Dynatrace web UI switches to enable/disable these metrics are labeled to let you know if they affect DDU consumption.
- All metrics ingested by the Public Cloud Extensions (AWS, Azure and Google Cloud).
- For example, metrics derived from cloud services.
How do we calculate DDU consumption for metrics?
Consumption occurs when metric data points are ingested. A metric data point is a single measurement value stored in Dynatrace. The value belongs to a metric, which is identified by a metric key and has a timestamp. A time series metric is a series of such data points, for example CPU utilization for a given host across an analysis timeframe.
Each ingested data point deducts 0.001 DDU from your available quota.
Metrics provided by Dynatrace are typically written once per minute. This results in the following typical annual DDU consumption for a single metric:
1 metric data point × 60 min × 24 h × 365 days × 0.001 = 525.6 DDUs per metric/year
How do dimensions of a metric impact the DDU consumption?
Metric data points can have associated dimensions, which are identified by dimension keys and values. For example, using the syntax of the metrics ingestion protocol two values could be ingested as follows:
my_cpu_utilization,hostname=hostA 55 1609459200000my_cpu_utilization,hostname=hostB 45 1609459200000
For the same timestamp (1609459200000), Dynatrace retains two different measurement values for the same metric on two different hosts.
This is achieved using the dimension key hostname and dimension values hostA and hostB. 55 and 45 are the measured CPU utilization percentages for this metric on the two hosts.
Notice how you can consider this as two metrics—one chart can be created for the CPU utilization of hostA and another for the CPU utilization of hostB. If data points are ingested periodically for both hosts, the end effect is double the number of ingested data points—because here each host-dimension results in a separate metric value that must be retained.
This doubling of ingested data points is also reflected in the associated DDU consumption: The DDU consumption is now effectively 0.002 per minute because data from two hosts is being ingested. Therefore, to calculate the DDU consumption based on metric keys, you need consider which data is being ingested and take the data's dimensions into account.
If more dimensions are added, and the number of data points increases, then DDU consumption will also increase. Here's an example:
my_cpu_utilization,hostname=hostA,cpu=1 55 1609459200000my_cpu_utilization,hostname=hostA,cpu=2 11 1609459200000my_cpu_utilization,hostname=hostB,cpu=1 45 1609459200000my_cpu_utilization,hostname=hostB,cpu=2 45 1609459200000
This example will consume 0.004 DDUs per minute due to the two hosts and the two CPUs.
However, the additional consumption is not caused by the increase in dimensions, but rather by the increased number of ingested data points, which typically accompany an increased number of dimensions.
If dimensions are added, but the number of data points remains the same, then DDU consumption does not change. This happens when purely descriptive dimensions are added whose values are determined by other pre-existing dimensions:
my_cpu_utilization,hostname=hostA,host_ip="127.0.0.23" 55 1609459200000my_cpu_utilization,hostname=hostB,host_ip="127.0.0.42" 45 1609459200000
These ingested data points amount to the same DDU consumption as if they were sent without the host_ip dimension.
Formally speaking, if dimensions are added, whose values are
functionally determined by other pre-existing dimensions, then the
DDU consumption will not change.
Included metrics per host unit
If you are monitoring hosts with OneAgent and consuming host units, then you are granted a number of "host-included metrics" based on the host unit consumption of the monitored hosts. More precisely, for each given minute, a host consuming host units has a budget of host-included metric data points. When metric data points "about the host" are ingested (for instance with a formal host dimension, then first the host-included budget of data points is consumed before your DDU quota is affected. One host-included metric is defined as one metric data point per minute, considering the previous section about dimensions of ingested data points.
1,000 metrics per host unit are included on each monitored host (in Full-Stack Monitoring mode). These metrics are included with your Full-Stack host units and therefore don't consume DDUs.
- Every OneAgent-monitored host with Full-Stack Monitoring enabled includes 1000 metrics per Host Unit (see detail in the table below).
- OneAgent-monitored hosts with Infrastructure Monitoring enabled always include 200 metrics that do not consume DDUs.
- All metrics that exceed the host's included metrics will consume DDUs.
- If all DDUs in the Metrics pool are used up, then the included metrics per host unit are not available as well.
- Calculated service metrics, custom DEM metrics, and log metrics are not eligible for these included metrics per host unit.
Note that included metrics are bound to specific hosts that are monitored via OneAgent. This means that only metrics that are booked either on the monitored host or a process of a monitored host are included. This also includes metrics that are booked onto Amazon EC2, Azure VM, and VMware virtual machine entities (if those VMs are monitored by OneAgent). Note that for metrics ingested by API, this applies only to metrics booked on a monitored host.
The evaluation of whether a host exceeds the host-included metrics is based on the total number of metric data points that are reported at a 1-minute frequency (there's no sliding time window for these metrics). When the ingested data points exceed the host-included metrics, DDUs are consumed for the difference.
If a host is licensed based on host-unit hours rather than host units, the calculation works the same way; you can consume up to the number of host-included metrics per host-unit hour. Each data point beyond this number consumes DDUs.
| Host size | Full-Stack mode | Full-Stack mode | Infrastructure mode | Infrastructure mode |
|---|---|---|---|---|
| Based on RAM GiB | Host units | Included metrics | Host units | Included metrics |
| 1.6 GiB | 0.1 | 200 | 0.03 | 200 |
| 4 GiB | 0.25 | 250 | 0.075 | 200 |
| 8 GiB | 0.5 | 500 | 0.15 | 200 |
| 16 GiB | 1 | 1,000 | 0.3 | 200 |
| 32 GiB | 2 | 2,000 | 0.6 | 200 |
| 48 GiB | 3 | 3,000 | 0.9 | 200 |
| 64 GiB | 4 | 4,000 | 1.0 | 200 |
| N × 16 | N | N 1 × 1,000 | 1.0 | 200 |
The minimum of included metrics is always 200, even when N is less than 0.2
Example of how included metrics affect DDU consumption
Let's take the following example.
- A host has 16 GiB RAM - In other words, 1 host unit
- The host is monitored via the OneAgent in Full-Stack mode
(1 host unit = 1,000 host-included metrics)
- 1,500 metrics from various extensions and local API ingest (for example, JMX and RabbitMQ) are booked on this OneAgent-monitored host
- 300 reported metrics via public API with no relation to a OneAgent-monitored host
In this scenario, 1,000 metrics/min are included via the host unit, and the host reports an excess of 500 metrics which will consume DDUs. The 300 Metrics that are reported via the API, and not related to a OneAgent-monitored host, will also consume DDUs. This makes a total of 800 metrics/min that consume DDUs.
Here are some other simple scenarios (All values below are based on metrics sent at 1 min intervals.)
| Mode | Host units | Included metrics per host unit 1 | Metrics reported for host | Paid metrics | Deducted DDUs/min |
|---|---|---|---|---|---|
| Full-Stack | 0.5 | 500 | 300 | 0 | 0 |
| Full-Stack | 1 | 1,000 | 1,500 | 500 | 0.5 |
| Full-Stack | 1 | 1,000 | 500 | 0 | 0 |
| Full-Stack | 4 | 4,000 | 5,000 | 1,000 | 1 |
| Infrastructure | 0.6 | 200 | 150 | 0 | 0 |
| Infrastructure | 1 | 200 | 1,000 | 800 | 0.8 |
Included metrics are bound to individual hosts.
Reported DDUs vs. consumed DDUs
Reported DDUs are defined as all DDUs before any host-included considerations are performed. Consumed DDUs reflect the total "billable" DDUs that get subtracted from your DDU balance.
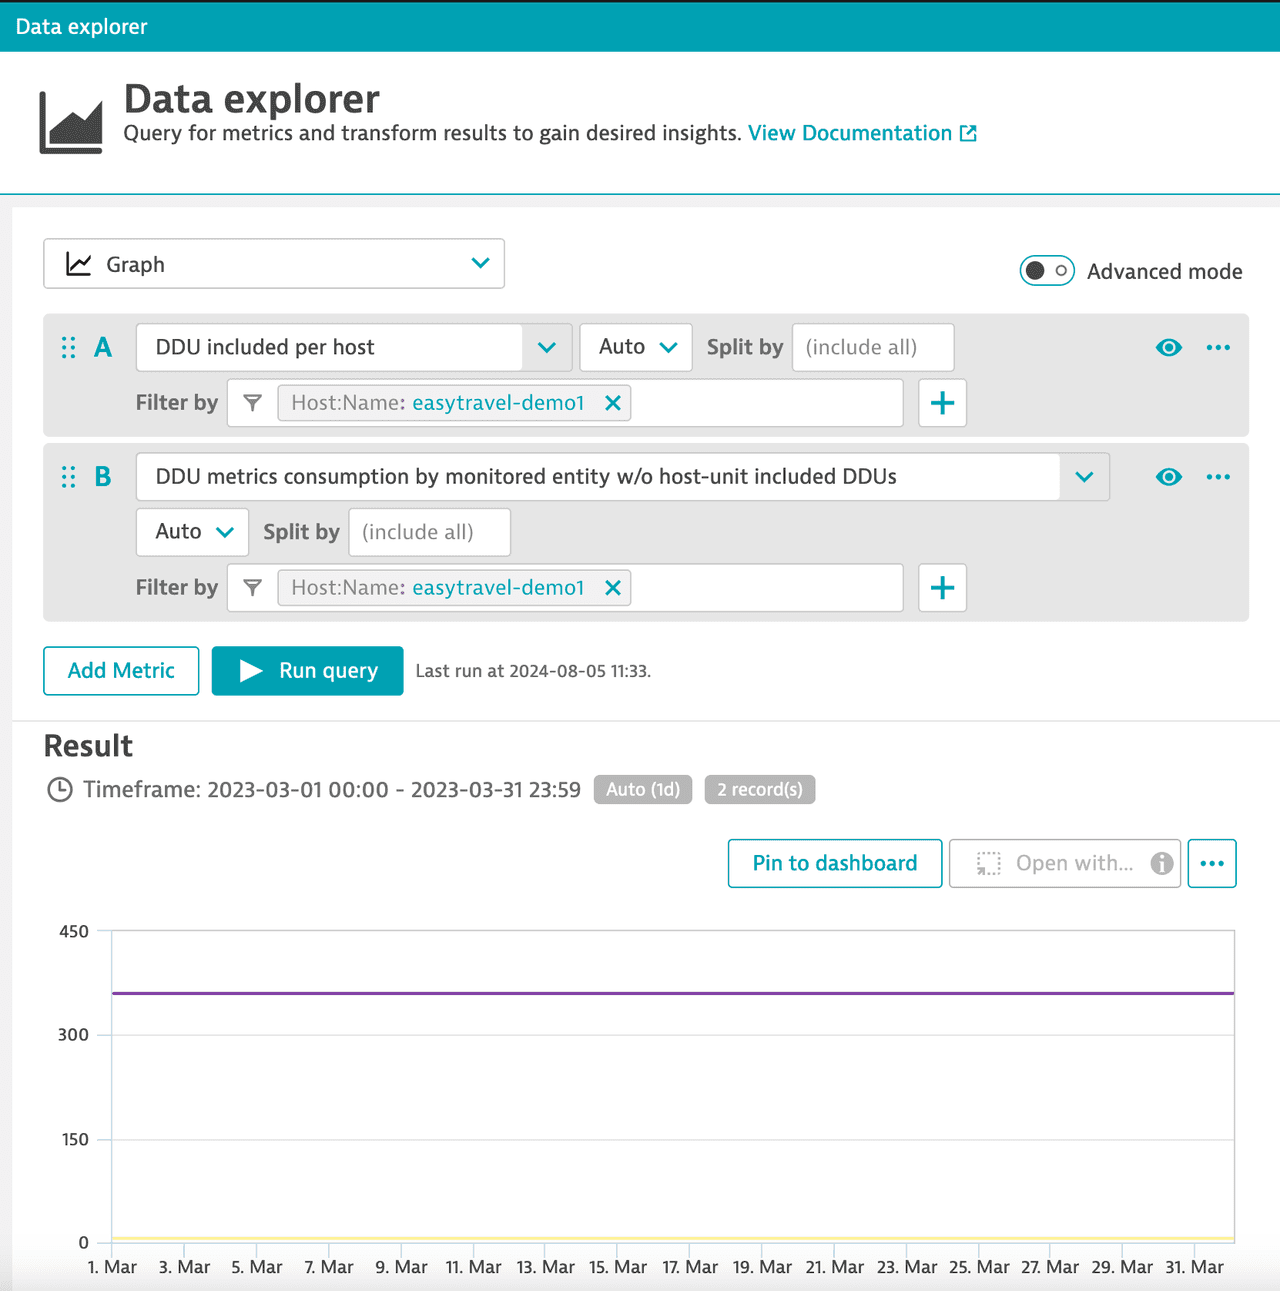
You can compare the reported DDUs for a specific host with the number of host-included metrics by creating a chart with Data Explorer using the following metrics. This allows you to gain insights into the number of available vs. consumed DDUs for a specific host.
builtin:billing.ddu.includedMetricDduPerHostThis metric is split by host ID. It shows you the host-included DDUs. For example, if a host has 1,000 included metrics, this metric will have a value of 1 (in other words, 1,000 × 0.001)builtin:billing.ddu.metrics.byEntityRawThebyEntityRawmetric is split by monitored entity and reflects the total reported DDUs before any host-included considerations are performed.builtin:billing.ddu.metrics.byEntitySimilar to thebyEntityRawmetric, thebyEntitymetric is split by monitored entity. It reflects the total consumed DDUs (in other words, all consumption above the number of included metrics per host unit). This is equivalent to the information shown on the DDU consumption overview page (see example below).
Recommendations for working with the chart
- As DDU billing is calculated on a per-minute basis (take a look at the DDU consumption for metrics example for more details) it's recommended that you work with a 1-minute resolution in the chart as well.
- Using Split by and Filter by allows you to select a specific host that you're interested in.
The example Data Explorer query above shows the following information:
- The purple line reflects the host-included DDUs. In the above example this is 0.25 DDUs (in other words, 250 metrics) on a per-minute basis.
- The yellow line reflects the
byEntityRawmetric. It shows the total reported DDUs for a monitored entity, which is filtered by the host. Any DDU consumption exceeding the host-included budget exceeds the purple line threshold. - The turquoise line reflects the information from the
byEntitymetric. It shows you the total consumed metrics. In the example above the host-included limit is exceeded about every 15 minutes between 09:30 and 10:45, and continuously beginning at 10:45. This results in the consumed DDUs, which are represented by the turquoise line chart.
Please note that data points from the byEntity metric can be delayed up to a few minutes.
How to estimate needed DDUs for metrics
Limited metric ingestion and analysis is provided with out-of-the-box Dynatrace technology support in the form of included metrics per host unit. To arrange for additional metric ingestion and analysis, contact Dynatrace Sales.
How to track DDU consumption for metrics
This section introduces two options for tracking the consumption of DDUs for metrics.
Davis data units overview page
To see how many DDUs your environment has consumed
-
Go to Account Management > License / Subscription > Overview.
You need the Manage monitoring settings permission or an admin account to access this page.
-
On the Davis data units (DDU) page:
- In the Consumption by DDU pool table, check the Metrics row.
- In the DDU consumption details section, check the Metrics tab.
There you can view your DDU consumption and identify the top contributors to DDU consumption.
Customized dashboards to track consumption
The following use cases explain how to instrument dashboards via Data Explorer and provided DDU metrics to track DDU consumption from metrics.
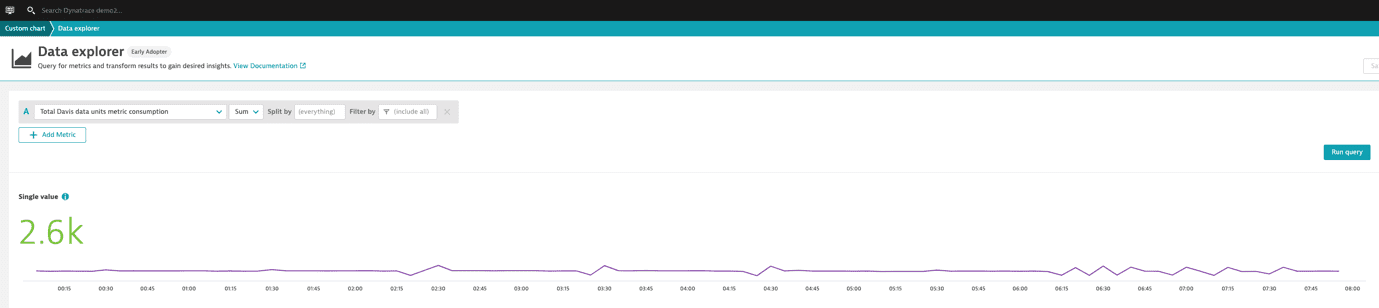
Investigate your total DDU consumption from metrics
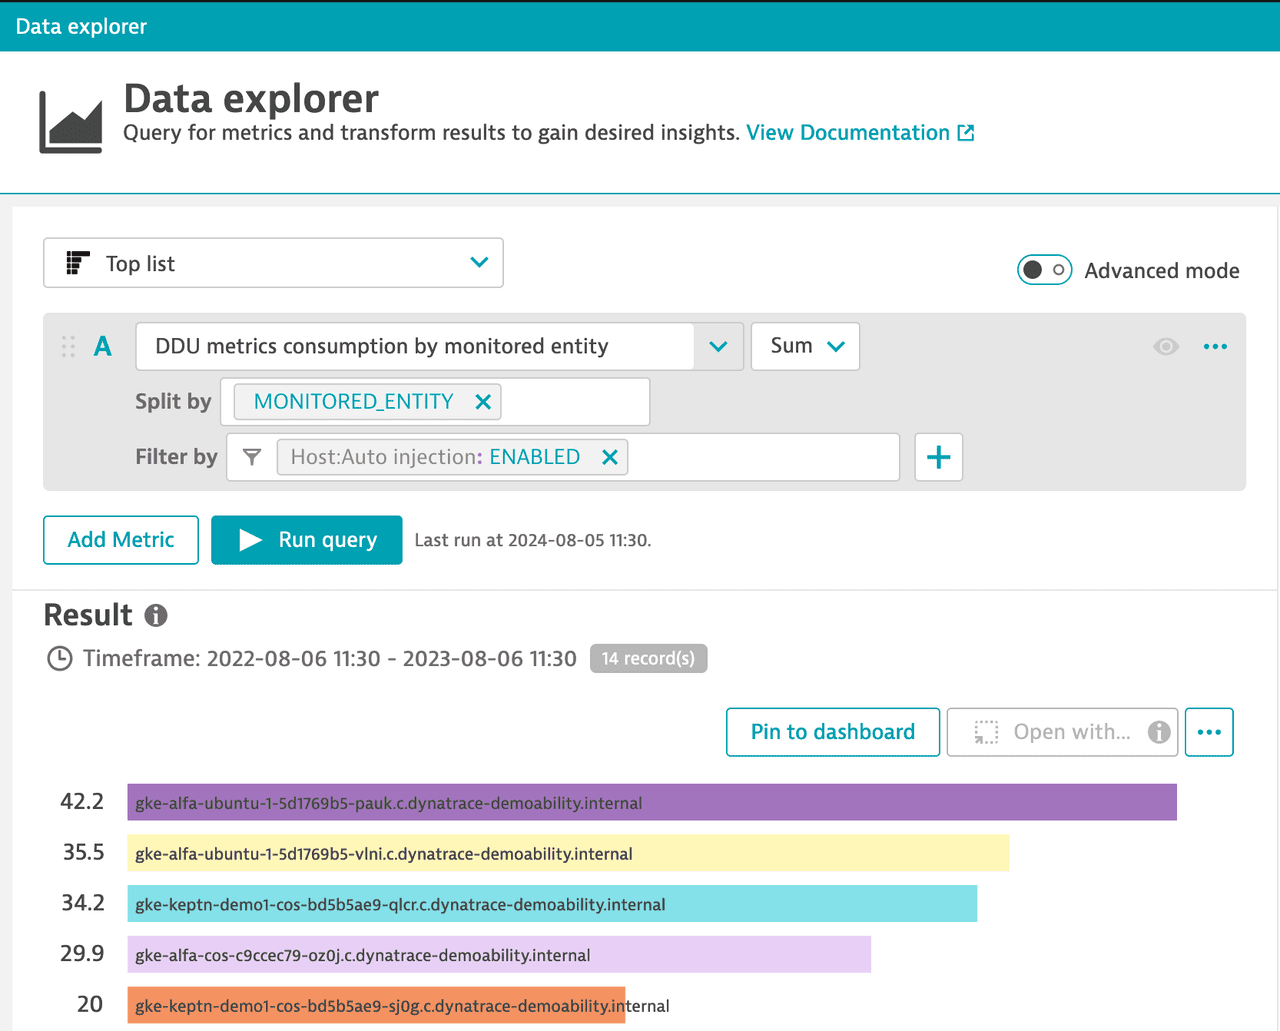
Investigate metric consumption per monitored entity
Investigate metric consumption per monitored metric entity
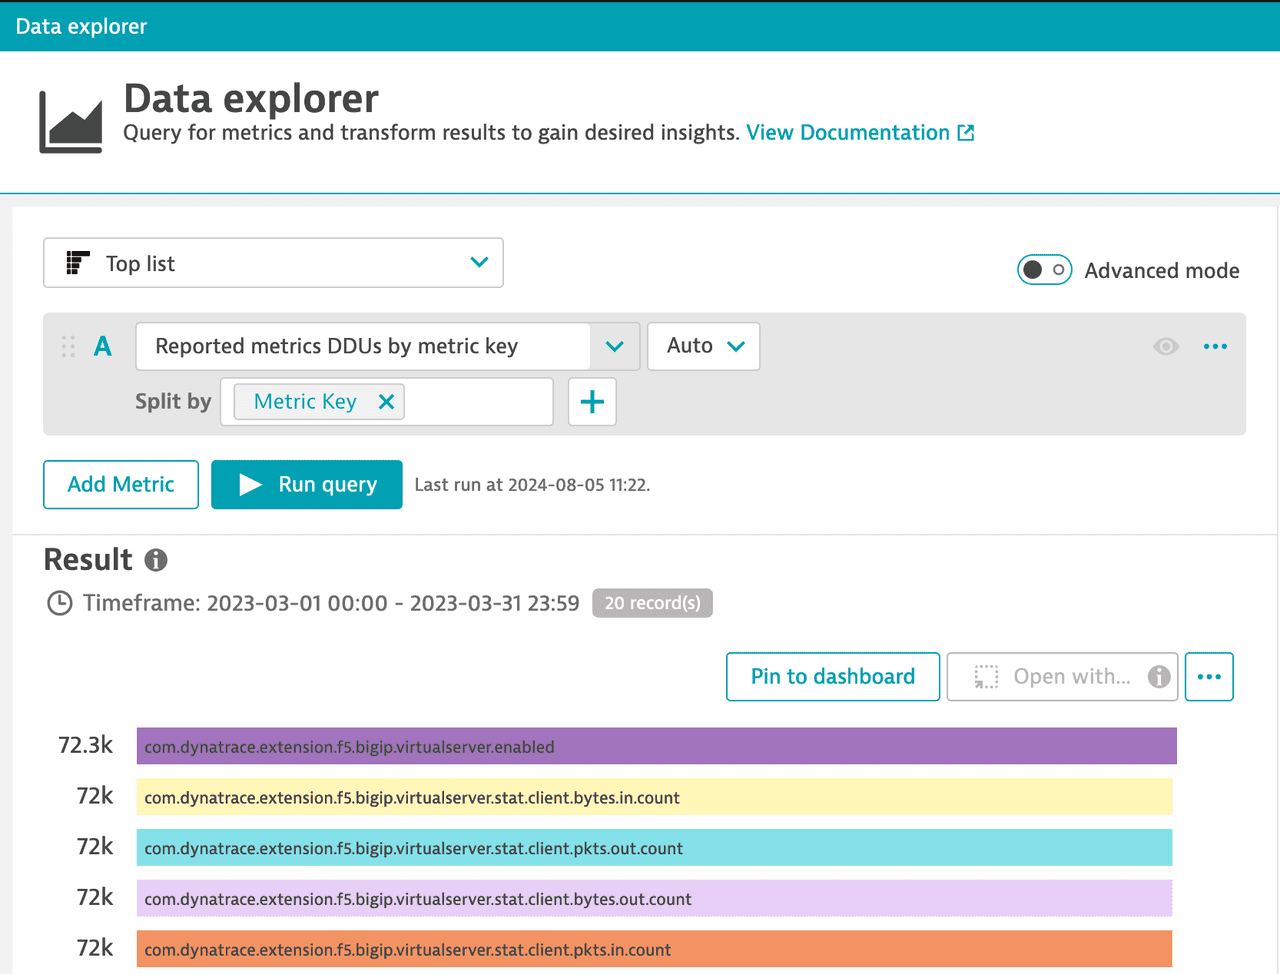
This chart shows you the total of reported DDUs per each metric key.
More information can also be found in the section Reported DDUs vs. consumed DDUs.
Consumption "Not related to a monitored entity"
The source of this consumption is one of the following:
- Metric ingestion for data without a
dt.entity.hostdimension - Calculated metrics from user sessions for web, mobile, and custom applications
- Calculated log metrics v2—In the metric-key breakdown, these have a
log.prefix
Frequently asked questions
All metrics sent via the default OneAgent (for example, host metrics) are included free of charge and do not consume DDUs. Metrics ingested by an extension that are bound to specific hosts (or processes), first consume all available included metrics before consuming any additional DDUs. Metrics ingested by API consume all available included metrics that are bound to specific hosts (not processes) before consuming any additional DDUs.
The following metric types consume DDUs:
| Metric type | Consumes DDUs | Included per host unit |
|---|---|---|
| Built-in extensions | Yes | Yes |
| Rest API | Yes | Yes1 |
| JMX | Yes | Yes |
| Python | Yes | No |
| Calculated service metrics | Yes | No |
| Calculated log metrics | Yes | No |
| Calculated DEM metrics | Yes | No |
| AWS metrics | Yes | Yes2 |
| Azure metrics | Yes | Yes2 |
| Google Cloud metrics | Yes | Yes2 |
| Cloud Foundry | No | No |
| Kubernetes Cluster metrics | No | No |
| VMware metrics | No | No |
If you use the REST API to send metrics to a OneAgent monitored host, those metrics will count against your allotment of host-unit included metrics. If metrics are sent to other entities, then those metrics will consume DDUs.
Cloud metrics that are bound to OneAgent-monitored hosts are deducted from your allotment of host-unit included metrics. For example, an EC2 instance metric counts against the host-unit included metrics of that EC2 instance. All other cloud metrics are subject to DDU consumption.
- Any metric that is booked on a monitored host or process group instance as these can be mapped to a specific host. Note that for metrics ingested by API, this applies only to metrics booked on a monitored host.
- Since Dynatrace version 1.203, metric ingestion can be booked directly on monitored hosts so that you can take better advantage of included host metrics.
- In a future release, ActiveGate extensions will also be able to book metrics on monitored hosts and thereby take advantage of included host metrics, just as OneAgent extensions do.
No, for extensions, any metric that is booked on a host or process consumes DDUs. For API ingestion, included metrics per host unit are consumed (in other words, 1,000 included metrics for Full-Stack Monitoring) before any DDUs are consumed. For details, see Included metrics per host unit.
Each data point consumes 0.001 DDU.
1 data point × 60 min × 24 hours × 365 days × 0.001 DDU weight = 525.6 DDUs
The DDU consumption breakdown shown on the Monitored entities and Metrics page, as well as the byEntity and byMetric metrics in the API, can slightly differ because:
- Breakdown by monitored entity takes into account the included DDUs per host unit, which the breakdown by metric does not.
- Consumption by monitored entities can be delayed up to 10 minutes in comparison to the
byEntityandbyMetricmetrics in the API.
Therefore, for licensing and billing purposes, only the breakdown by monitored entity is considered (breakdown by metric is provided purely for informational purposes).
For metrics not related to a monitored host, consumption per monitored entity and consumption per metric are identical.
Yes, metrics via OneAgent extension are covered by included metrics. For Full-Stack Monitoring mode, this means 1,000 included metrics. For Infrastructure mode, this means 200 included metrics.
Yes. Note that for metrics ingested by API, this applies only to metrics booked on a monitored host.
No, custom devices don't have included metrics. Included metrics are only available for hosts and processes that are monitored by OneAgent.
The following extensions utilize custom devices to ingest metrics: F5, Windows Server, Apigee Edge, SAP, Juniper Network, IBM I, IBM DataPower, Citrix Netscaler, and others.
ActiveGate extensions don't consume host-unit included metrics. Included metrics are only available for hosts and process metrics that are monitored by OneAgent.
The configuration change should only take a few seconds, with no negative impact on your metric consumption.
We recommend that you ingest custom metrics at a 1-minute frequency. When more metric data points per minute are ingested, more DDUs are consumed.
For example, a custom metric ingested at a frequency of 10 seconds is equivalent to 6 data points × 60 min × 24 hours × 365 days × 0.001 DDU weight = 3153.6 DDUs
cloud services for AWS and Azure consume DDUs. All metrics that belong to a OneAgent-monitored host are either part of the basic value package (these are not metrics) or they count against the included metrics that come with each host unit. All other extension or integration metrics consume DDUs.
Yes, you can select which individual AWS and Azure services are monitored. All "cloud services" are available for monitoring on an opt-in basis. Also, by leveraging tag filtering, you can opt-out of monitoring individual "Built-in services" (those services that are automatically monitored).
Kubernetes nodes are automatically monitored when OneAgent is installed; these metrics are part of our core OneAgent offering and are included per host unit.