Track license usage
- Explanation
- 3-min read
You can track the license usage of your host units, Davis data units, and Digital Experience Monitoring units under classic licensing in two ways:
- Via the Cluster Management Console
- In the Local-Self-Monitoring environment
Cluster Management Console
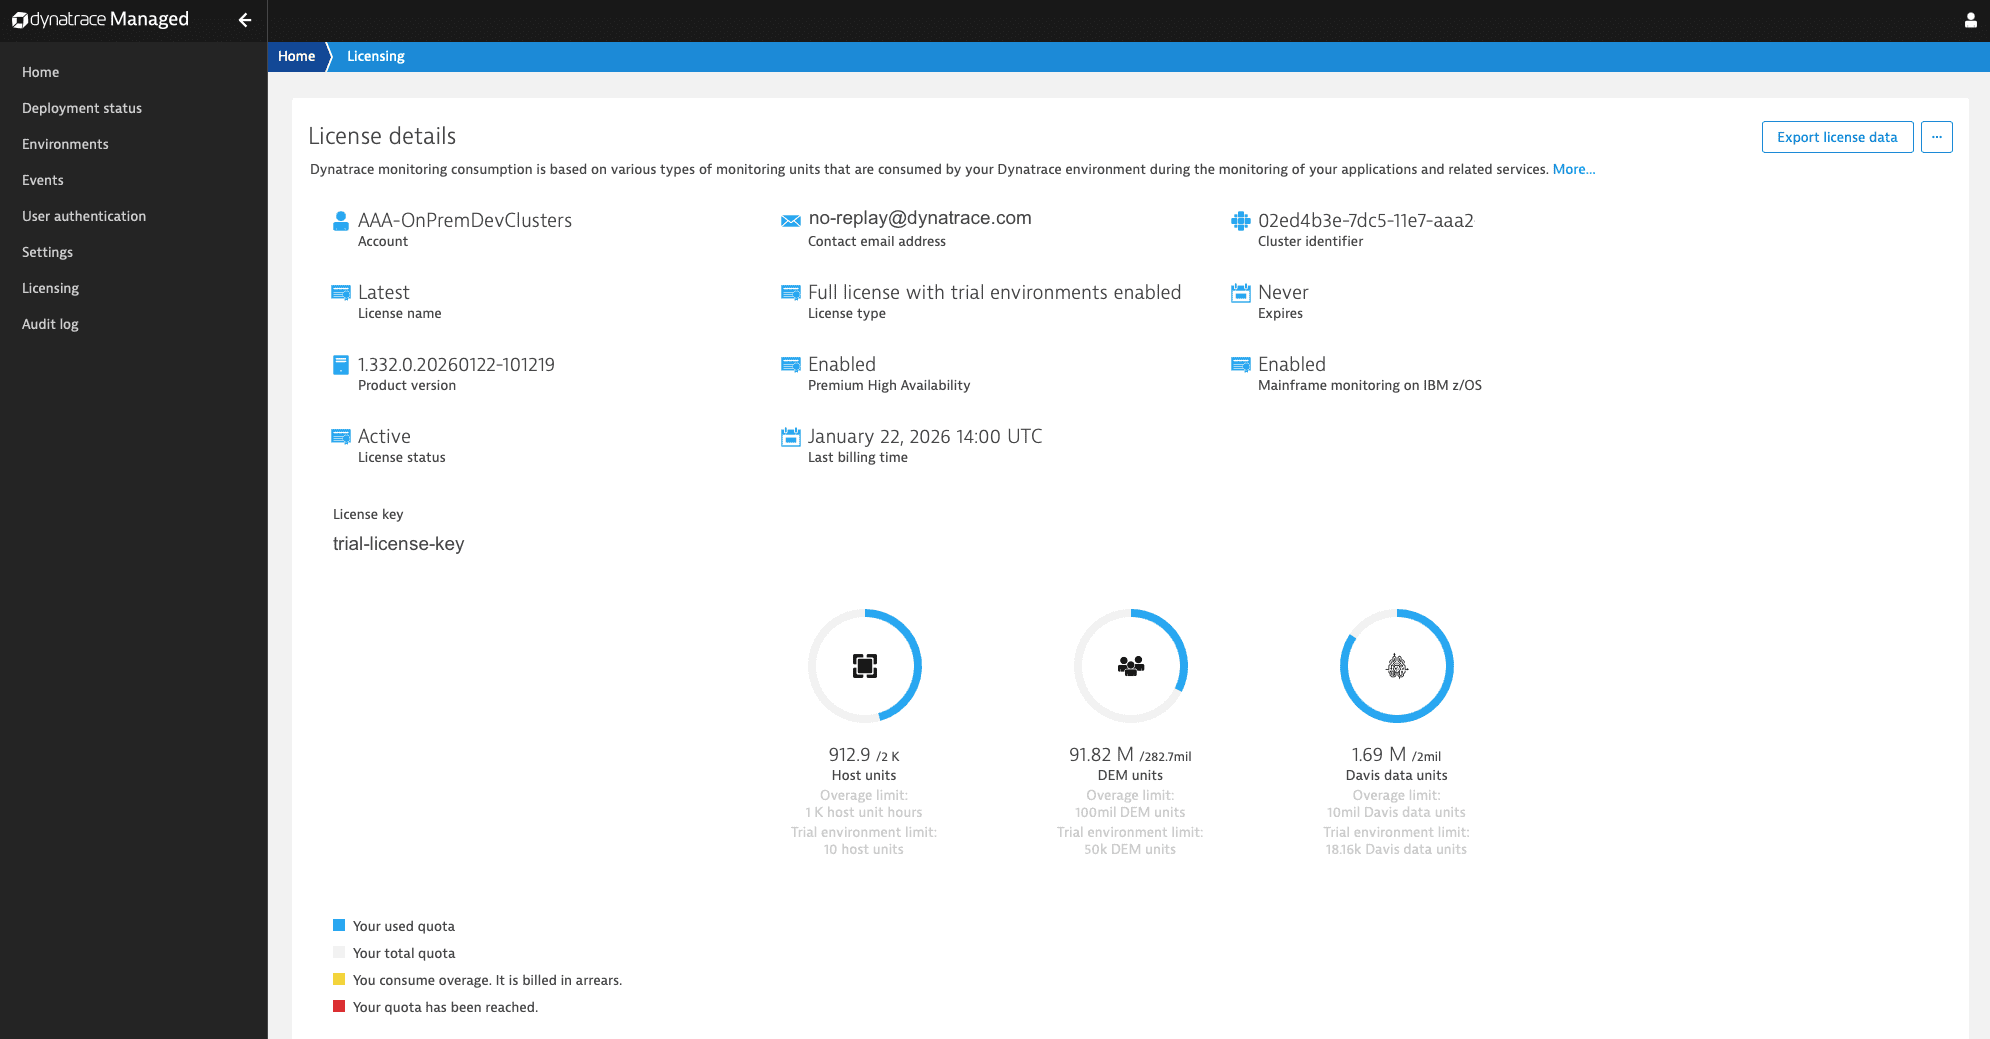
To track license usage of a Managed Cluster, log in to the Cluster Management Console and select Licensing in the menu.
The Licensing page displays license metadata, the quota per license unit, and current consumption. You can also see whether the overage quota applies and how much of it your Managed Cluster has consumed.
All data displayed here is also available via the Cluster API v2 - Cluster License.
Local-Self-Monitoring environment
Dynatrace Managed version 1.330+
To track license usage of a Managed Cluster, go to the Local-Self-Monitoring environment and select Dashboards > Cluster license usage.
The Cluster license usage dashboard displays several charts for each license unit, illustrating its quota and the percentage consumed. You can also see whether the overage quota applies and how much of it your Managed Cluster has consumed.

Billing metrics
Each chart uses self-monitoring billing metrics. Six billing metrics are available per license unit. Use metric events to generate alerts for license events—for example, when units are about to run out.
Host units
The following self-monitoring billing metrics are available.
| Metric name | Metric key |
|---|---|
Cluster - Billing - Hostunit - Quota |
|
Cluster - Billing - Hostunit - Quota - Used |
|
Cluster - Billing - Hostunit - Quota - Used Percent |
|
Cluster - Billing - Hostunit - Overage - Hours - Quota |
|
Cluster - Billing - Hostunit - Overage - Hours - Quota - Used |
|
Cluster - Billing - Hostunit - Overage - Hours - Quota - Used Percent |
|
Davis data units
The following self-monitoring billing metrics are available.
| Metric name | Metric key |
|---|---|
Cluster - Billing - Ddu - Quota |
|
Cluster - Billing - Ddu - Quota - Used |
|
Cluster - Billing - Ddu - Quota - Used Percent |
|
Cluster - Billing - Ddu - Overage - Quota |
|
Cluster - Billing - Ddu - Overage - Quota - Used |
|
Cluster - Billing - Ddu - Overage - Quota - Used Percent |
|
Digital Experience Monitoring units
The following self-monitoring billing metrics are available.
| Metric name | Metric key |
|---|---|
Cluster - Billing - Dem - Quota |
|
Cluster - Billing - Dem - Quota - Used |
|
Cluster - Billing - Dem - Quota - Used Percent |
|
Cluster - Billing - Dem - Overage - Quota |
|
Cluster - Billing - Dem - Overage - Quota - Used |
|
Cluster - Billing - Dem - Overage - Quota - Used Percent |
|
License events
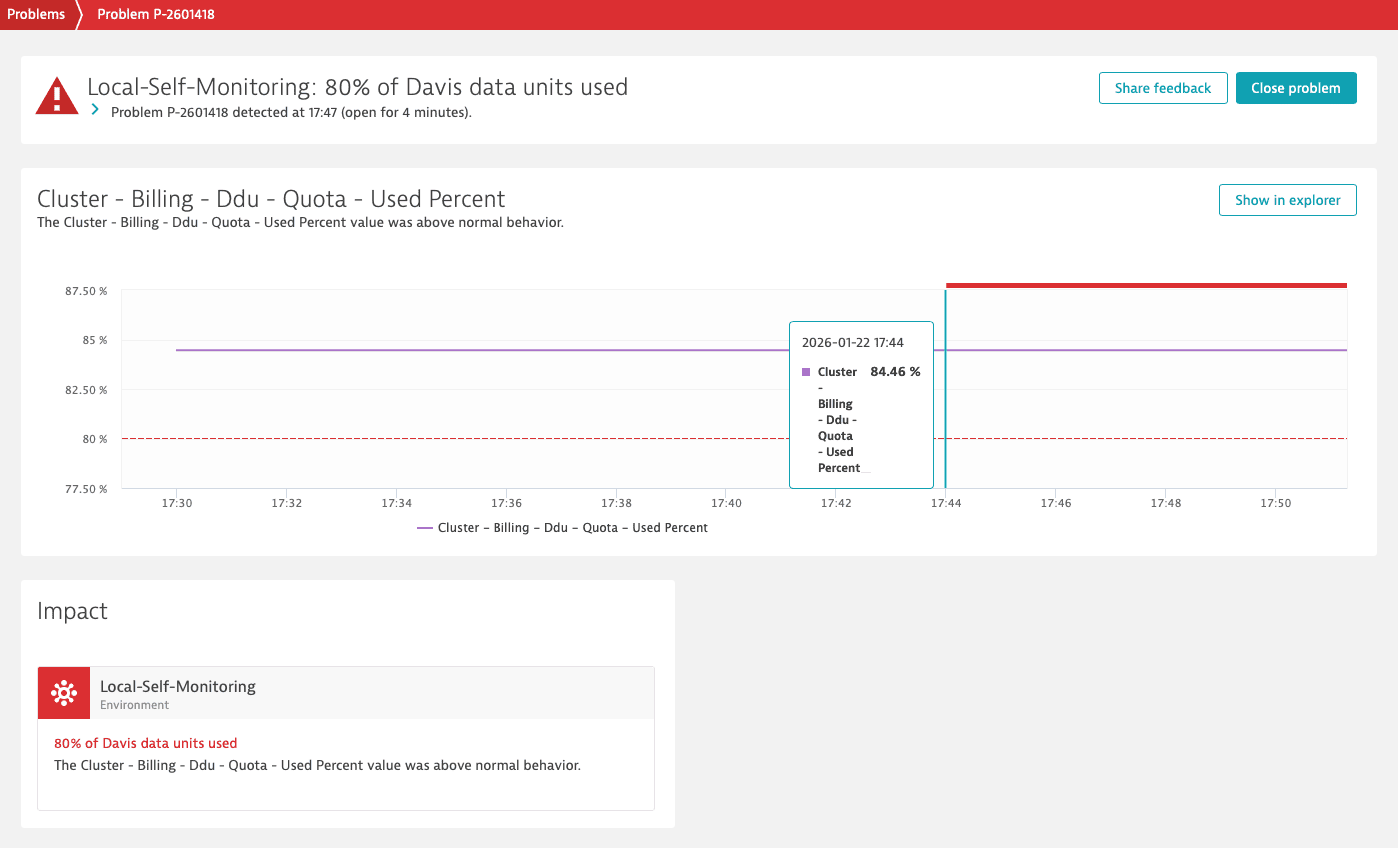
To set up a license event (for example, when your Managed Cluster consumes 80% of the Davis data units):
-
Go to the Local-Self-Monitoring environment and select Settings > Anomaly detection > Metric events.
-
Select Add metric event.
-
Define the Query definition properties:
-
Query type: Metric selector
-
Metric selector: Metric key with
maxandrolluptransformations. For example:isfm:cluster.billing.ddu.quota.used_percent:max:rollup(max,10m)
-
-
Define the Monitoring strategy properties:
- Model type: Static threshold
- Threshold:
80 - Threshold input unit: percent
- Alert condition: Alert if metric is above
-
Define the Advanced model properties:
- Violating samples:
3 - Sliding window:
5 - Dealerting samples:
5
- Violating samples:
-
Test the configuration using Alert preview.
-
Define the Event template and set event type to Error.
-
Select Save changes.
When your Managed Cluster exceeds 80% of the Davis data units, Dynatrace opens a problem. Under Problems you'll find, for example, an alert like this: