What's new in Dynatrace SaaS 1.345
- Release notes
- 12-min read
- Rollout start on Aug 11, 2026
This page showcases new features, changes, and bug fixes in Dynatrace SaaS version 1.345. It contains:
Platform | OpenPipeline
Enrich signals at ingest with the new Inline lookup processor
With the new Inline lookup processor, you can map an existing attribute on a record to a new or updated value using a lookup table you define directly in the pipeline, without connecting to an external system. Use it instead of complex DQL statements for common enrichment tasks—such as adding a description based on an error code, mapping an app ID to a business unit or cost center, or adding security context based on an existing attribute—so enrichment stays simple and readable.
Feature updates
Account Management | Subscriptions and Licensing
Improved process for purchasing Dynatrace Platform Subscriptions
Purchasing Dynatrace Platform Subscriptions via private offers on the Azure Marketplace is now easier. The updated interface and workflow let you synchronize your Dynatrace Platform Subscription start and end dates with your Azure SaaS subscription, so contract periods align.
For more information, see Azure Native Dynatrace Service.
Application Observability | Distributed Tracing
Dynatrace links are no longer persisted as span links
Dynatrace links between subpaths are no longer persisted as span links. The DT_TRACING_LINK_ID Semantic Dictionary field is now deprecated.
Application Security | Vulnerabilities
Stay ahead of security risks in your AI services with automated vulnerability alerts
The Notify on New Critical & High Vulnerabilities workflow template automatically monitors your generative AI services for newly detected critical and high vulnerabilities and sends a Slack notification as soon as they appear. Each alert includes a breakdown of affected services, vulnerable components, and direct links to the security findings  Vulnerabilities and
  AI Observability views—so your team can investigate and act without leaving their existing tools. To use it, install the template, connect your Slack workspace, and turn on the schedule trigger to get continuous coverage with no manual checks required.
Digital Experience | Users & Sessions
Session Replay skips to the first replay view
Session Replay now skips directly to the first replay view when loading.
Infrastructure Observability
Streamlined Dynatrace Snowflake Observability Agent deployment via installation wizard
Introduced a Dynatrace Snowflake Observability Agent (DSOA) installation wizard that streamlines the setup process within Business Observability.
- Simplified installation through a guided, step-by-step workflow.
- Reduced manual configuration effort.
- Faster and more consistent onboarding to DSOA capabilities.
Infrastructure Observability | Discovery & Coverage
Network coverage now uses Smartscape queries
 Discovery & Coverage network coverage now uses Smartscape on Grail queries. This means faster queries at a large scale. Additionally, we've added cross-linking to
  Smartscape so you can quickly see network device relationships.
Infrastructure Observability | Infrastructure & Operations
ActiveGate support for raw installers
ActiveGate installers obtained through the new deployment endpoints are now available as raw installers on Linux and Windows, without embedded environment configuration.
Configuration is now separate from the installer binary so that the same artifact can be safely stored, shared across teams, and reused across environments — reducing the risk of accidental credential exposure during distribution.
Infrastructure Observability | Kubernetes
New centralized telemetry metadata enrichment
We've introduced a new tagging strategy that allows you to centrally manage metadata enrichment across all telemetry data and data sources. With this central configuration, you can:
- Define custom key-value pairs as primary tags.
- Derive primary tags from Kubernetes namespace annotations and labels.
- Resolve and attach domain tags.
- Set fields such as security context, cost center, and cost product.
- Use Dynatrace Operator to enrich key-value pairs directly through DynaKube resource attributes.
This configuration supports metadata enrichment of Kubernetes signals and metadata enrichment of host/process signals (collected by OneAgent). Enrichment of cloud signals will be released in an upcoming Dynatrace version.
For more information, see Enrich Kubernetes telemetry with primary Grail fields and tags and Enrichment of OneAgent telemetry.
Infrastructure Observability | Kubernetes
Dynatrace Operator now supports platform tokens
Dynatrace is introducing platform tokens as the successor to access tokens, offering a more secure and unified way to authenticate with the Dynatrace platform.
We encourage you to start migrating from access tokens to platform tokens at your earliest convenience. Existing access tokens will continue to be accepted for the time being, but they will eventually be removed from Dynatrace Operator. We will inform you about dates and best practices with appropriate lead time in our release notes.
Infrastructure Observability | Kubernetes
Auto-update for ActiveGate and OneAgent container images on public registries
Dynatrace now supports auto-update for ActiveGate and OneAgent images hosted on supported public registries, bringing the same seamless update experience previously available through the Dynatrace built-in registry. Supported public registries offer multi-arch images compatible with ARM64 (AArch64), x86-64, s390x, and PPC64le architectures on Linux, adhering to best practices for immutability and signing to strengthen supply chain security.
If you source images from a private registry, Dynatrace now emits events that can be used in Workflows to trigger custom image replication pipelines. This allows teams to keep their private registry automatically in sync, without sacrificing control over their internal image management processes.
For configuration details, a component breakdown, and more, see Use a public registry.
Platform
Record deletion improvements
You can now track record-level deletion tasks more easily and get clearer status details while deletions are in progress. Broader deletion windows also make overall deletion progress more efficient, reducing the need to split a single deletion into many smaller requests (smaller than 24h). Status reporting now includes submission time and indicates when a deletion completed incompletely.
Platform | Dashboards
Scanned bytes now displayed in GiB to align with pricing
In  Dashboards and
  Notebooks, the Scanned bytes query metadata is now always formatted as GiB, aligning directly with the pricing rate card.
Platform | Dashboards
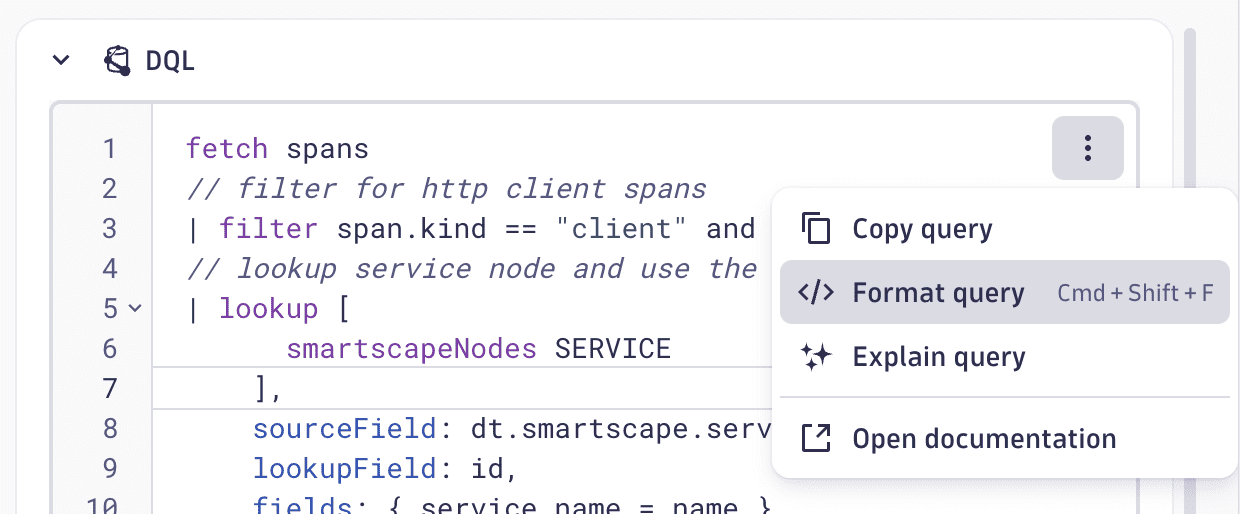
Automatically format DQL queries in Dashboards and Notebooks
To automatically format a DQL query in Dashboards or Notebooks
- Edit a DQL dashboard tile or notebook section.
- In the upper-right corner of the DQL editor, select > Format query (or use the keyboard shortcut Ctrl/Cmd+Shift+F) to instantly clean up your query for better readability.
Additionally, the Explain query command has moved into the DQL editor menu.
Platform | Dashboards
Updated layout for Dashboards and Notebooks
In Dashboards and Notebooks, we've made some minor layout changes for consistency across apps and to support upcoming mobile improvements.
- The New dashboard/notebook button has moved to the right in the app header and is now combined with the Upload button.
- In the left panel, the All dashboards/notebooks button has moved to the top. The full list now loads in the main content area, making it easier to get back to your last opened items.
- Direct entry to ready-mades has been removed from the panel but is still accessible as a tab in the dashboards and notebooks lists.
Platform | Dynatrace Intelligence
Configurable PII blocking rules for agentic AI
You can now configure which personally identifiable information (PII) blocking patterns get detected by the Dynatrace Intelligence agentic AI. A new setting allows administrators to disable individual PII detection patterns or turn off PII blocking entirely, giving you control over the balance between data protection and response quality.
PII blocking protects sensitive data in user and workflow prompts, but overly broad detection can degrade response quality by blocking false positives. Patterns designed to detect credit card numbers or government IDs were also flagging legitimate observability data, including timestamps, CVE identifiers, host IDs, Kubernetes metrics, and vulnerability patterns. This overly broad detection resulted in blocked or degraded responses for common operational queries. With configurable blocking rules, you can selectively disable patterns that cause false positives in your environment while keeping the protections that matter to your organization.
When PII blocking is active, and a detection pattern is identified in the user prompt, the chat UI highlights the match and identifies which pattern triggered it, with a link to documentation for further explanation.
Platform | Grail
Cost allocation for lookup data in Grail
You can now assign cost allocation metadata to your lookup files in Grail. This allows you to track and attribute storage and ingest costs to specific cost centers or products across your organization:
- The upload endpoint accepts two new optional parameters
dt.cost.costcenteranddt.cost.productto associate a file with a cost center or product at upload time. - The output of
fetch dt.system.filesincludesdt.cost.costcenteranddt.cost.productfields so that you can query and filter your files by cost allocation metadata directly in DQL. - The Files - Ingest & Process and Files - Retain billing usage events break down billed bytes per assigned cost center or product.
- Audit events capture the cost allocation configuration.
Platform | OpenPipeline
Improved UX for pipeline stages
In OpenPipeline, we have improved the UX for pipeline stages:
- Accordion-based vertical pipeline UX with clear stage configuration status.
- Order of stages now reflects the processing sequence in OpenPipeline.
- Processor search across names and existing configuration values.
Platform | OpenPipeline
Temporary fields within OpenPipeline
During OpenPipeline extraction and assignment, fields prefixed with dt.temp are now considered temporary and won't be stored in Grail, but are available throughout OpenPipeline processing. This allows easier creation of custom metrics and events without impact on the original data (such as logs and spans).
Platform | Platform Services
EdgeConnect now supports Dynatrace domain patterns
You can now configure Dynatrace domains as host patterns in EdgeConnect, including wildcards like *.dynatrace.com and absolute hosts like myenvironment.apps.dynatrace.com. This enables cross-environment routing through a fixed IP, which is useful when the target environment enforces IP allowlisting.
This requires versiontag label='EdgeConnect version 1.744.0+'.
Platform | Platform Services
Add document labels in Dashboards and Notebooks
In Dashboards and Notebooks, you can now add and delete labels on your dashboards and notebooks, and use them to search and filter your content list.
- To manage labels, use (Actions menu) on any dashboard or notebook and select Info & labels. Then use the Add labels field to create or assign labels.
- To use labels, list all dashboards or notebooks, and then use the Filter by labels dropdown to narrow results by one or more labels.
Threat Observability | Security events
Know which AI workloads are vulnerable
When you ask about vulnerabilities on your AI workloads, the dt-sec-insights skill returns vulnerability insights for the monitored GenAI services in your environment. You get either confirmed vulnerable services or a clear response that there are no monitored AI workloads—never misleading results based on guesswork.
Breaking changes
Application Observability
Connections from OneAgent version 1.215 and earlier are rejected
Dynatrace now rejects connections from OneAgent version 1.215 and earlier. Action plan: If you're running OneAgent version 1.215 and earlier, upgrade to a supported OneAgent version to avoid data loss and connectivity issues, and to benefit from enhanced security and features unavailable in earlier OneAgent versions.
For details, see End-of-life announcements.
Application Observability | Services
Improved derived http.route for enhanced endpoints
Enhanced endpoints now derive an http.route when OneAgent sends the /* fallback value. For details, see Automatic naming for services without http.route.
Digital Experience
Updated naming for hard navigation user actions
Hard navigation user actions are now named Load <page name> instead of Loading of <page name>, providing a more concise and consistent naming format across all user action types.
Fixes and maintenance
Resolved issues in this release (SaaS)
- Fixed a login issue where users with Time-based One-Time Password (TOTP) enabled could not sign in using Sign in with Microsoft without SAML federation, resulting in a redirect loop. (PS-47395)
- Fixed a pin-to-dashboard issue that caused HTTP 400 errors. (PRISM-13091)
- Fixed the cell actions for the Type column in
 Clouds. (INFOBS-11615)
 - Fixed missing settings-oauth-client secret mount in deployment-scraper.yaml that caused the scraper worker to fail fetching per-tenant PII settings. (DI-30863)
- Fixed an issue where the event would not be processed for problem creation if
event.severitywas set through a custom Davis event OpenPipeline processor to a type that was not thelongGrail data type (as stated in Semantic Dictionary). (DI-30305) - Fixed an issue where logs for failing tools did not display the tool name. (DI-29143)
- Recorder recognizes data-testid attributes and adds them as valid CSS selectors. This increases the stability of recorded paths. (DEM-30909)
- Fixed conditional permissions in
 Users & Sessions. (DEM-30157)
 - Updated session classification to distinguish standalone navigations from navigations that occur as part of a user action, resulting in more accurate session handling. (DEM-29922)
- Updated Session Replay to suppress the status cloak when a view has operations. (DEM-29568)
- Fixed an issue in settings where adding a new health alert for a frontend application did not show the unsaved-changes banner, making it impossible to save the new alert. (DEM-29307)
- Fixed an issue where named-target
POSTforms failed to submit when the target window was already open, causing the action to time out. If you applied thedisableNewWindowPostFormsHandlingexperimental property as a workaround, you can now remove it. (DEM-28422) - Fixed linking AWS MSK Connect metrics to entities in AWS monitoring in Latest Dynatrace. (DAQ-27361)
- Reduced amount and size of messages sent to the enrichment-processor by dropping metrics with no datapoints. (DAQ-27290)
- Fixed an issue in
 Live Debugger where the Edit breakpoint pop-up remained open when you hovered over other context-menu items. (APPOBS-37406)
 - Fixed an issue in which selecting Open in Bitbucket on a file opened the repo instead of the specific file. (APPOBS-37405)
- In Live Debugger, added a new message stating, for non-code file types, that this file type is not supported for viewing. (APPOBS-37399)
- Fixed an enablement check in Live Debugger that showed the incorrect "Live Debugger not enabled" notice. (APPOBS-37289)
- Fixed an error where the chart crashed if there were more than 50 legend items. (APPDEV-18778)
- Fixed an issue where certain Latest Dynatrace environments could not access deprecated data. (PPX-13444)