Dynatrace SaaS release notes version 1.274
- Latest Dynatrace
- Release notes
- Published Aug 30, 2023
Rollout start: Aug 29, 2023
Want to ask questions or give feedback? Head over to What's New in Dynatrace in the Dynatrace Community.
Product news
- Unified services: Easily keep track of your pipelines
We’ve all been there. An important fix is waiting to be delivered, and a manager asks you why it’s taking so long and says that the pipeline was much faster a few months ago. Although you disagree with the assessment, you can’t dispute it because you don’t have the data to show that the pipeline […]
Breaking changes
Fixed data types of Grail fields for DAVIS_EVENT and DAVIS_PROBLEM events
Breaking change
We have fixed data types of Grail fields for DAVIS_EVENT and DAVIS_PROBLEM events.
This is a breaking change for string-specific DQL functions (for example, == "…", contains, startsWith). Use toString(...) to fix the behavior.
Newly written records use these types:
| Field | Data type before fix | Data type after fix |
|---|---|---|
| event.start | string | timestamp |
| event.end | string | timestamp |
| resolved_problem_duration | string (in milliseconds) | duration (in nanoseconds) |
| dt.davis.timeout | string | long |
| dt.davis.is_frequent_event | string | boolean |
| maintenance.is_under_maintenance | string | boolean |
| dt.davis.analysis_time_budget | string | long |
| dt.davis.analysis_trigger_delay | string | long |
| dt.davis.is_frequent_issue_detection_allowed | string | boolean |
| dt.davis.is_merging_allowed | string | boolean |
| dt.davis.is_problem_suppressed | string | boolean |
| dt.davis.is_entity_remapping_allowed | string | boolean |
If you use DQL functions that only work with string data types, you need to do a toString(...) before that so that it still works.
For example, change this:
| filter dt.davis.is_frequent_event == "true"
to this:
| filter toString(dt.davis.is_frequent_event) == "true"
There are also other options, but adding toString(...) to a changed field name will fix every query.
Announcements
Thresholds API sunset
With the release of Dynatrace version 1.275, we will turn off the Thresholds API. Any requests to these endpoints will stop working. Migrate your automations to the Settings API instead. For more information, see the migration guide.
New features and enhancements
New matcher attribute in log storage configuration
Infrastructure Observability | Logs
Now you can use Log record level attribute in log storage configuration:
New DQL keyword
Platform | DQL
Now you can use the in keyword in your DQL queries as a comparison operator.
New DQL functions
Platform | DQL
Now you can include the following functions in your DQL queries:
- arrayConcat
ThearrayConcatfunction concatenates multiple arrays into a single array.
View the origin of vulnerable libraries
Application Security | Vulnerabilities
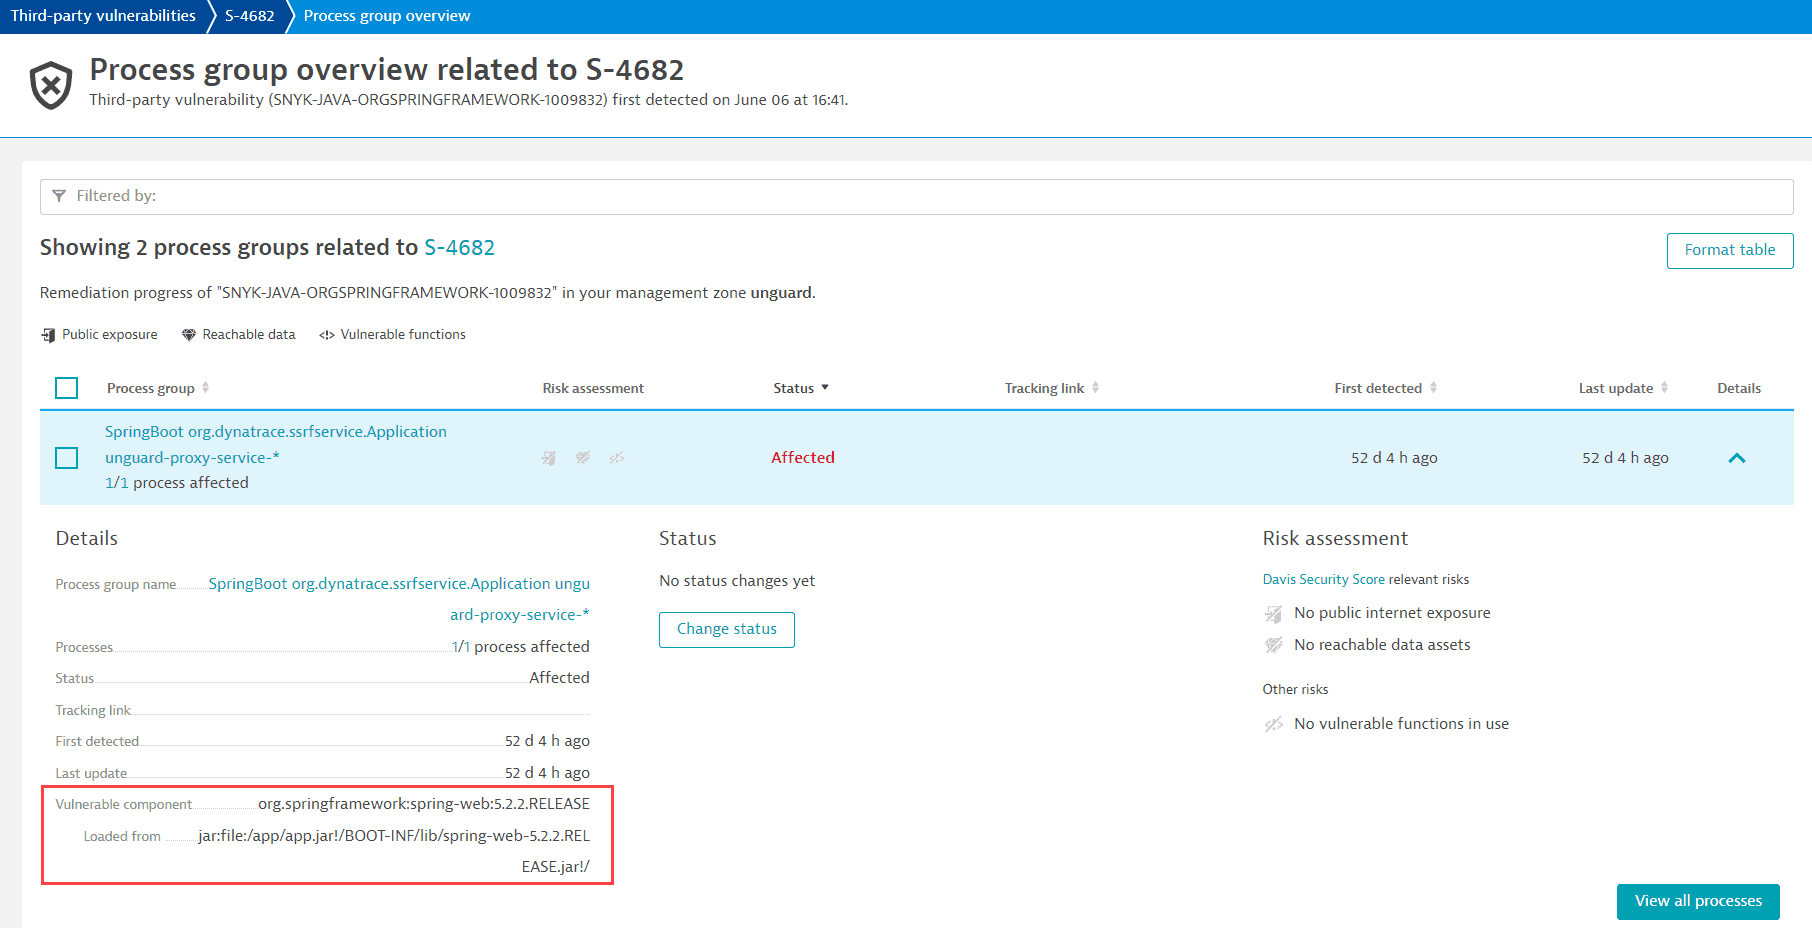
You can now view the origin of a vulnerable Java software component on the remediation tracking for process groups and processes affected by a vulnerability.
For example:

For information on how to navigate there, see Remediation tracking.
Unified services for trace ingest
Application Observability | Services
We enhanced support for OpenTelemetry and cloud-native monitoring with a new service type, Unified service. Unified services are based on OpenTelemetry spans ingested via the ingestion APIs and provide
- Automatic baselining and Davis® AI integration
- Automatic endpoint detection
- New service metrics, such as response time, throughput, and failure rate
- Advanced horizontal topology detection
- Support for custom application metrics and application logs
- Agentless support for Istio service meshes
- Opt-in endpoint monitoring with new metrics
To get started, see Unified services.
Share your feedback in the Feedback channel for the enhancements to OpenTelemetry trace-ingest (Unified Services) released w/ v1.274 (SaaS & Managed) in the Dynatrace Community!
Detection attributes highlights
Application Observability | ServicesApplication Observability | Databases
Attributes used for detection are marked with an asterisk ✱ on the service and database, under Properties and tags.
Davis problems refresh rate
Platform | Davis AI
We now refresh Davis events and problems in Grail every 6 hours for as long as they're not closed. This guarantees query results for problems/event snapshots by querying 6-hour timeframes.
Unified analysis screens for Kubernetes nodes
Infrastructure Observability | Kubernetes
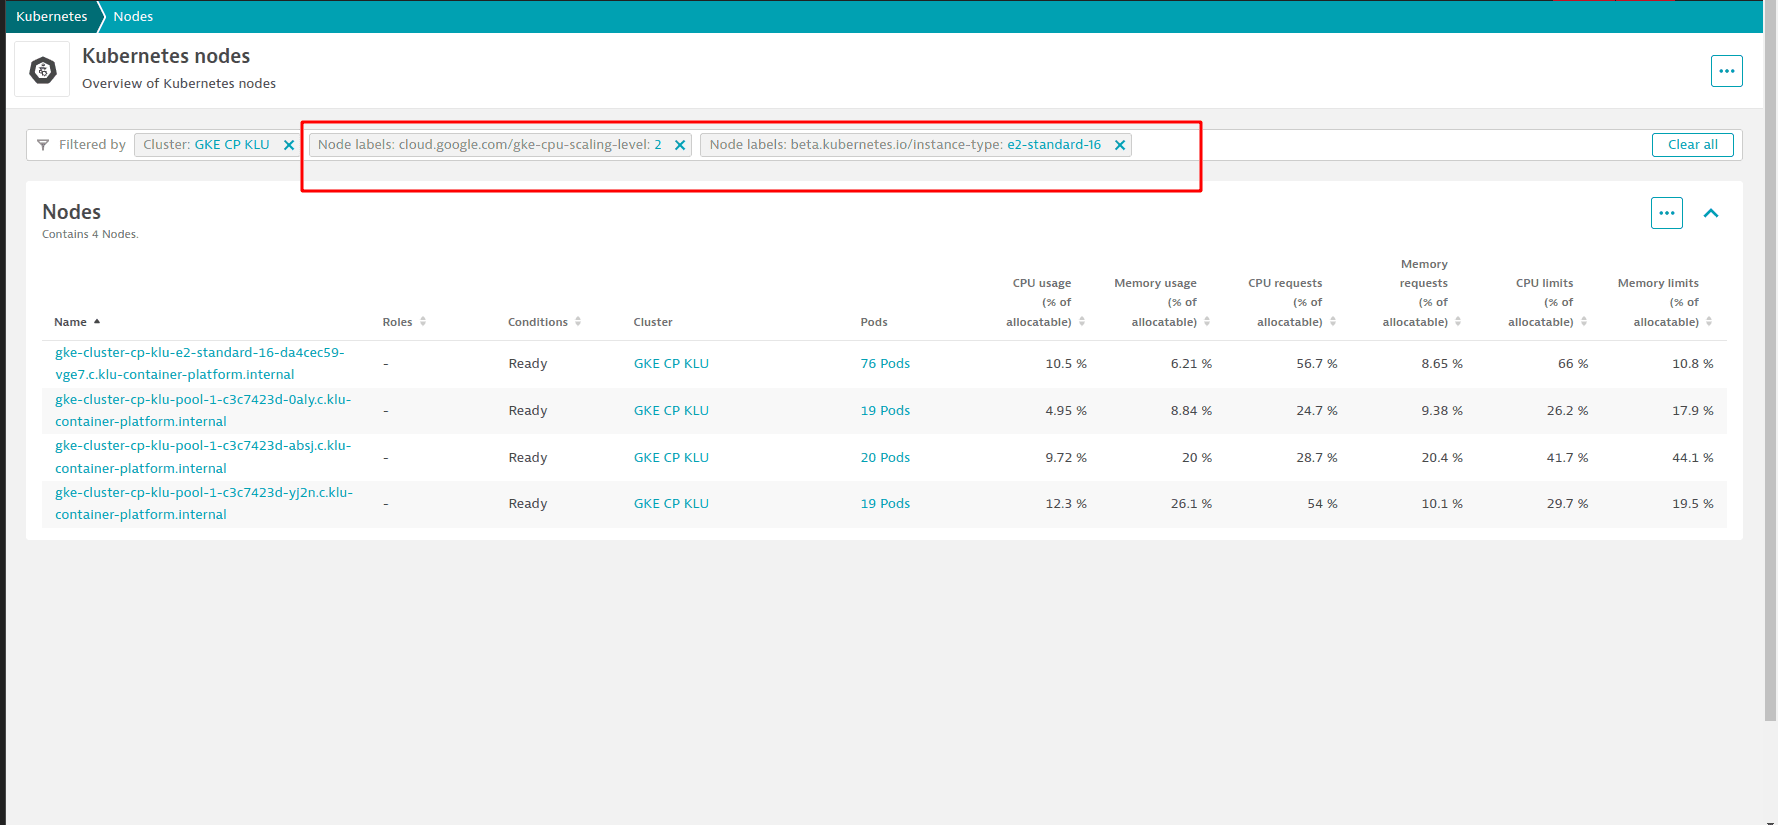
You can now access new unified analysis list and detail screens for Kubernetes nodes.
Advanced Kubernetes label filtering
Infrastructure Observability | Kubernetes
You can now apply multiple values simultaneously in the Kubernetes label filter.

Detailed OneAgent status in unified analysis host page
Infrastructure Observability | Hosts
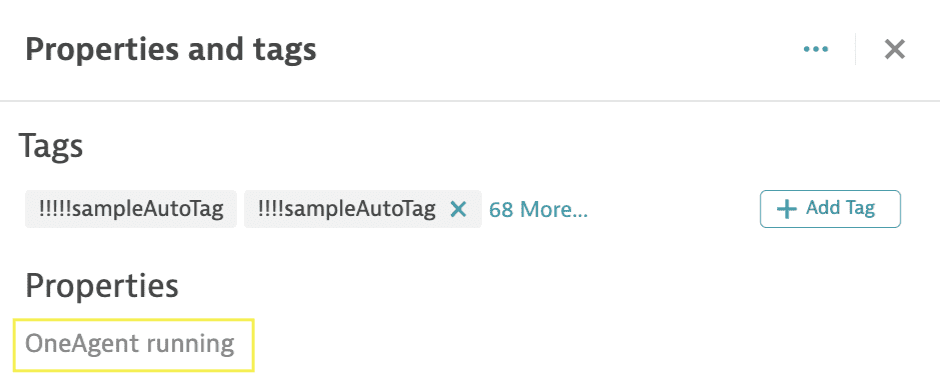
The Properties and tags section of the unified analysis host page features a OneAgent status:
- The status can be either active or inactive, along with a reason for the status.
- Detailed status information is available for up to 24 hours. Beyond that, the status will default to inactive.
- An unknown status will be displayed if data is unavailable.
- The status may be delayed by up to 5 minutes.

RKE2 technology grouping
Infrastructure Observability | Hosts
We've added RKE2 technology per PGI. RKE2 Agents and RKE2 Servers are now grouped into separate process groups.
High System Load events trigger process instance snapshots
Infrastructure Observability | Hosts
High System Load events will now automatically trigger process instance snapshots.
Dynatrace API
To learn about changes to the Dynatrace API in this release, see Dynatrace API changelog version 1.274.
Resolved issues
- General Availability (Build 1.274.71)
- Update 75 (Build 1.274.75)
- Update 84 (Build 1.274.84)
- Update 91 (Build 1.274.91)
- Update 98 (Build 1.274.98)
- Update 103 (Build 1.274.103)
- Update 109 (Build 1.274.109)
- Update 112 (Build 1.274.112)
- Update 115 (Build 1.274.115)
- Update 121 (Build 1.274.121)
- Update 124 (Build 1.274.124)
- Update 132 (Build 1.274.132)
- Update 157 (Build 1.274.157)
General Availability (Build 1.274.71)
The 1.274 GA release doesn't contain any user-facing resolved issues.
Update 75 (Build 1.274.75)
This is a cumulative update that contains all previously released updates for the 1.274 release.
Update 84 (Build 1.274.84)
This is a cumulative update that contains all previously released updates for the 1.274 release.
Update 91 (Build 1.274.91)
This is a cumulative update that contains all previously released updates for the 1.274 release.
Update 98 (Build 1.274.98)
This is a cumulative update that contains all previously released updates for the 1.274 release.
Update 103 (Build 1.274.103)
This is a cumulative update that contains all previously released updates for the 1.274 release.
Update 109 (Build 1.274.109)
This is a cumulative update that contains all previously released updates for the 1.274 release.
Update 112 (Build 1.274.112)
This is a cumulative update that contains all previously released updates for the 1.274 release.
Update 115 (Build 1.274.115)
This cumulative update contains 1 resolved issue and all previously released updates for the 1.274 release.
metric query
- Fixed an issue that caused HTTP 500 to be returned by the metric query/definition endpoints of the Timeseries API v1 if the User-Agent header was not set in the request. (CLUSTER-8252)
Update 121 (Build 1.274.121)
This is a cumulative update that contains all previously released updates for the 1.274 release.
Update 124 (Build 1.274.124)
This is a cumulative update that contains all previously released updates for the 1.274 release.
Update 132 (Build 1.274.132)
This is a cumulative update that contains all previously released updates for the 1.274 release.
Update 157 (Build 1.274.157)
This cumulative update contains 18 resolved issues (including 1 vulnerability resolution) and all previously released updates for the 1.274 release.
| Component | Resolved issues |
|---|---|
| Cluster | 12 |
| Autonomous Cloud | 2 |
| OneAgent | 1 (1 vulnerability) |
| Synthetic monitoring | 1 |
| User interface | 1 |
| metric query | 1 |
Cluster
- The action validation in extension is now stricter to avoid incorrect error messages. (TI-7825)
- Resolved an issue where very large problems could halt problem processing. (DAVIS-5701)
- Cluster now waiting for connection responses from all ActiveGates after ActiveGate update. (Cluster wasn't waiting for all ActiveGates to respond if an attempt to connect to VMware was successful.). (HOST-3654)
- Fixed metrics malfunction when more than a certain threshold is created. (CLUSTER-7919)
- Added extensibility to the new service UI. (TI-7916)
- Fixed an issue that prevented access to entity settings when user has permissions restricted to a management zone. (PS-9401)
- We disabled obsolete custom process monitoring rules, fixing the issue in which it was impossible to delete them. (HOST-3507)
- Fixed VMware credentials state button. (HOST-3466)
- The status of problems that receive updates after resolving is now UPDATED instead of RESOLVED. The RESOLVED status is now unique between the previous and succeeding records for the same event ID. (DAVIS-5443)
- Fixed an issue where unnecessary allocations may require cluster resizing. Reduced memory allocations during log metrics ingest. (LOG-4206)
- Fixed an issue where problems that were directly impacting the host were not displayed on the host page problems tab in a timeframe that the problem was present. (HOST-3493)
- Cluster now waiting for connection responses from all ActiveGates after ActiveGate update. (Cluster wasn't waiting for all ActiveGates to respond if an attempt to connect to VMware was successful.). (HOST-3654)
Autonomous Cloud
- Corrected a Deployment page reference to point to the newly released Dynatrace Operator v0.12.1. (K8S-6603)
- Corrected a Deployment page reference to point to the newly released Dynatrace Operator v0.13.0. (K8S-6907)
OneAgent
- Vulnerability: Improved security by updating the aiohttp package to version 3.8.5.Improved security by updating the aiohttp package to version 3.8.5. (HOST-3456)
Synthetic monitoring
- Fixed an issue with validation of credentials in a customized script of a browser monitor on-demand execution. (SYNTH-6024)
User interface
- We now display errors from thrown by the execute endpoint. (EXA-7365)
metric query
- Fixed an issue that caused HTTP 500 to be returned by the metric query/definition endpoints of the Timeseries API v1 if the User-Agent header was not set in the request. (CLUSTER-8252)