Dynatrace SaaS release notes version 1.218
- Latest Dynatrace
- Release notes
- Published May 07, 2021
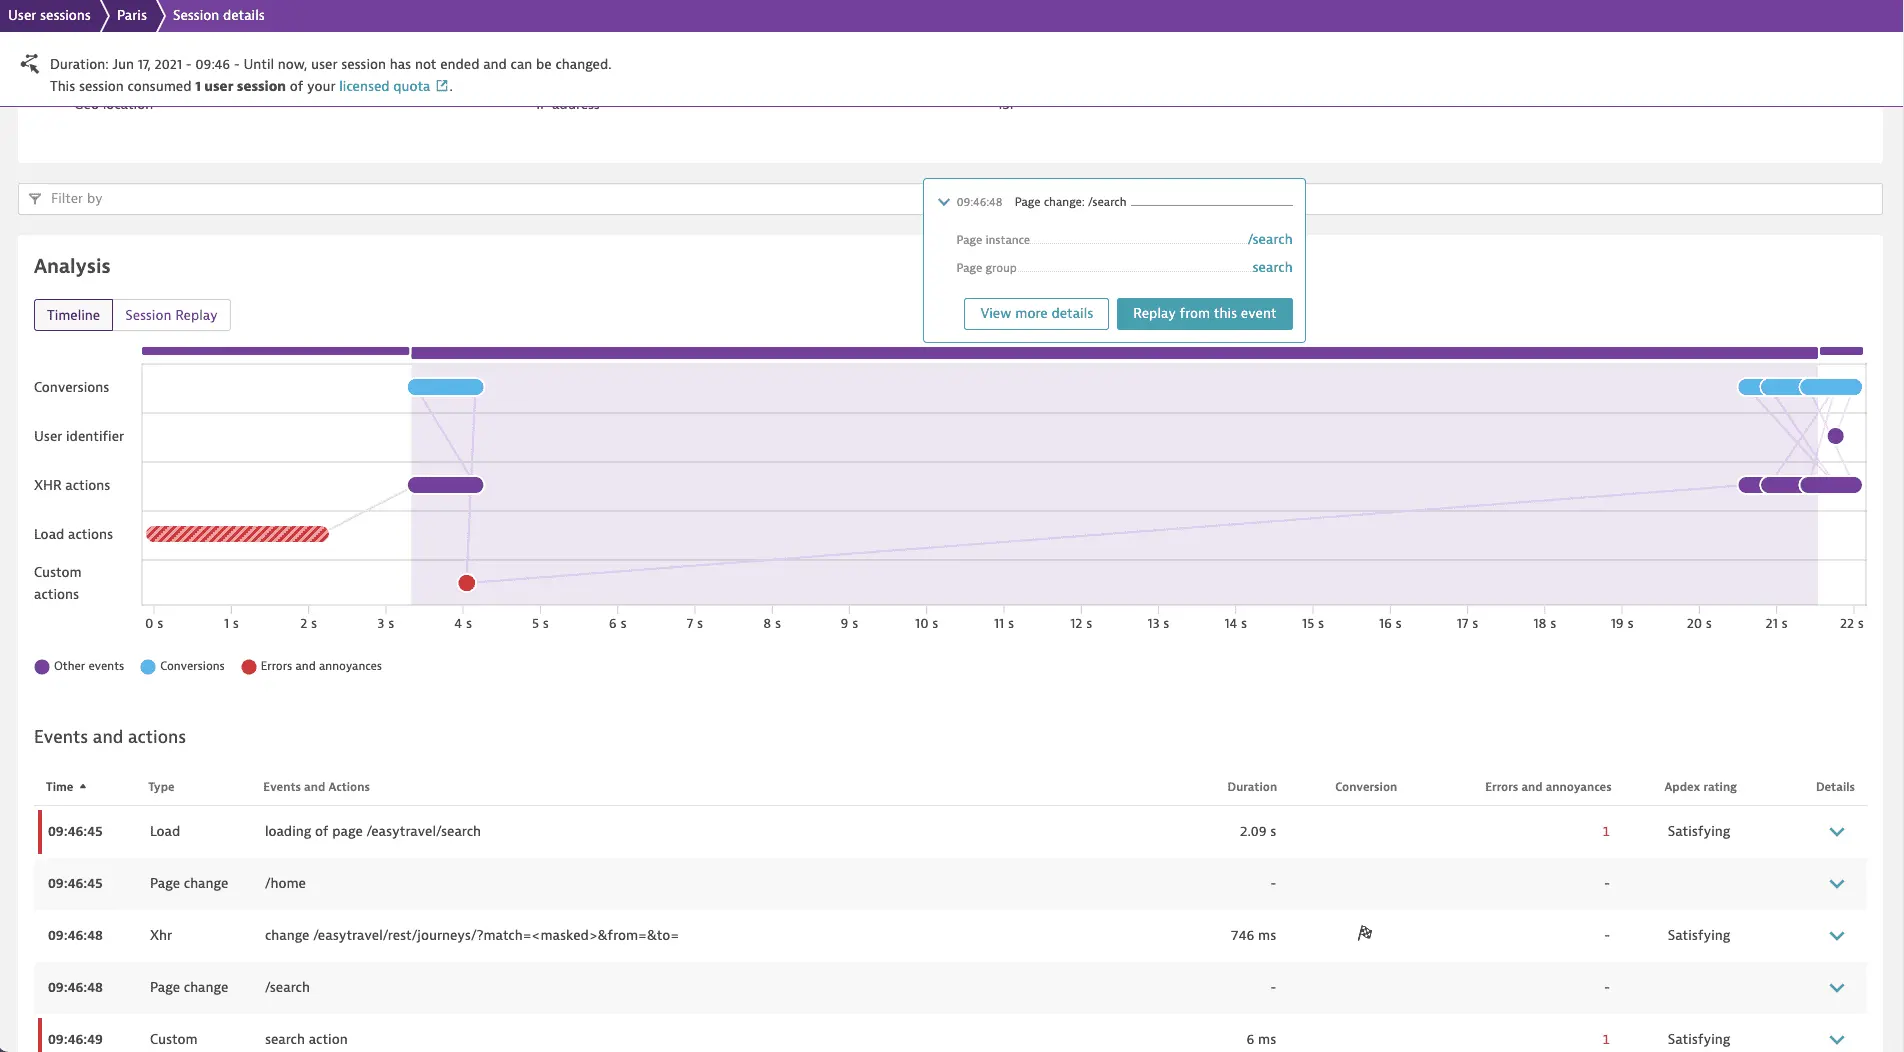
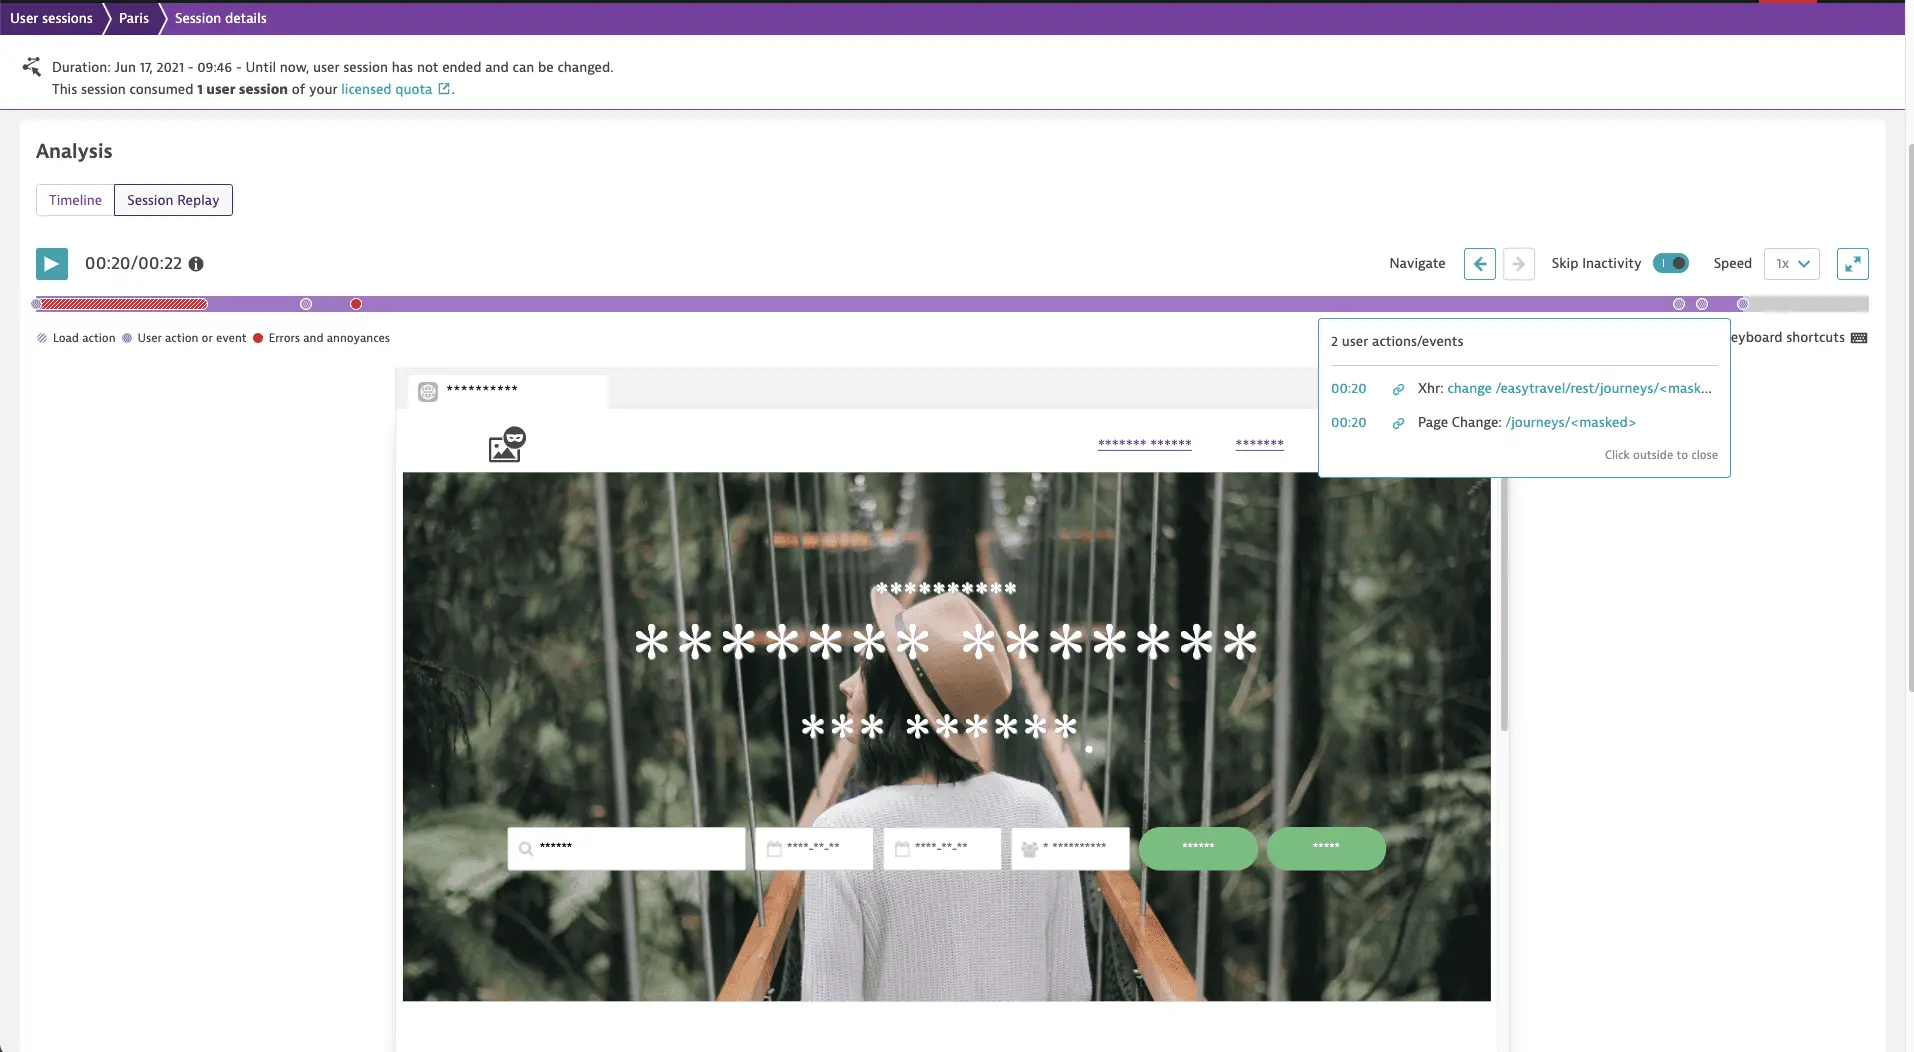
RUM web: Page change events
Find and analyze your page change events, including all the automatically detected page loads and route changes of your web application, on the user session detail page. Page change events are displayed on both the Timeline and Session Replay tabs.


Release monitoring settings
The Issue-tracking system list in the issue-tracking queries for release monitoring settings page has been modified to split the Jira options into on-premises and cloud. The old Jira option is marked as deprecated and will be removed in a future release. Please make sure to create new issue-tracking configurations based on your issue-tracking system.
Log Monitoring
With Dynatrace SaaS version 1.218, the new version of Log Monitoring is available for trial accounts. The following Dynatrace components are required to fully benefit from the Log Monitoring Classic:
- Dynatrace SaaS version 1.218+
- Dynatrace OneAgent version 1.187+
- Dynatrace Environment ActiveGate version 1.217+
With the new version of Log Monitoring, you have a new way to:
- Acquire log data - Log ingestion API (Logs Classic)
- Analyze log data - Log viewer (Logs Classic)
- Alert on log data - Log metrics (Logs Classic)
Possible change in ISP names
Internet Service Provider (ISP) names for RUM user sessions are now resolved using the MaxMind database. If an ISP name changes, it is more accurate now. For example, a full ISP name rather than just an upper case acronym.
Session Replay sharing
You can now share a Session Replay recorded session as a link to an exact point in the timeline.
Private Synthetic location utilization
You can now analyze the utilization level of your private Synthetic locations in global settings (Settings > Web and mobile monitoring > Private synthetic locations). You can see if they're overloaded and make educated decisions on adding more Synthetic-enabled ActiveGates if you wish to run additional monitors. Each private Synthetic location in the list is marked in green/yellow/red indicating overall capacity-utilization status. You can also see the type and number of synthetic monitors assigned to each location. Synthetic-enabled ActiveGate version 1.217+ is required.
Declarative process grouping
Starting with this release, your custom process group definitions are migrated to Declarative process grouping available at Settings > Processes and containers. For OneAgents version 1.217+, only changes made to declarative process grouping settings will have an effect from now on. For more information, see Declarative process grouping.
Custom metric metadata
You can now provide metadata for custom ingested metrics.
Dynatrace API
To learn about changes to the Dynatrace API in this release, see Dynatrace API changelog version 1.218.
Resolved issues
General Availability (Build 1.218.79)
The 1.218 GA release contains 18 resolved issues.
| Component | Resolved issues |
|---|---|
| Cluster | 12 |
| Dashboards | 2 |
| Infrastructure monitoring | 1 |
| RUM | 1 |
| Dynatrace API | 2 |
Cluster
- Extension details in Dynatrace Hub can now be edited. (APM-299631)
- Resolved issue with selecting a metric in `Data explorer` when using some versions of Safari. (APM-299419)
- "Contains" string operations now honor the case sensitivity flag for calculated service metric conditions. (APM-300406)
- Fixed incorrect links to documentation from installation pages for ActiveGate for Windows and Linux. (APM-296758)
- Dynatrace Hub breadcrumbs are now updated correctly after changing an extension name. (APM-300548)
- Fixed issue that, under certain circumstances, caused errors when aggregating problems using the Problem REST API v2. (APM-300027)
- Resolved issue that caused occasional technical difficulties page display when navigating through host details page while the page was still loading. (APM-298915)
- In Dynatrace Hub extension edit wizard, improved user feedback for `Copy` command. (APM-297914)
- Enhanced memory dumps page to better take into account management zones when triggering or downloading memory dumps. (APM-299687)
- Fixed issue with links not being clickable (live) in the event properties. (APM-298496)
- Dynatrace Hub now shows correct details in About section for extensions. (APM-300902)
- Fixed issue preventing the correct application of request naming rules. (APM-298360)
Dashboards
- Saving the general settings of a dashboard no longer creates a reporting token if reporting is disabled. (APM-299057)
- Dashboards created by Dynatrace employees in a customer environment are now visible to customers. (APM-300290)
Infrastructure monitoring
- Advanced SNMP properties in extension activation JSON ("timeoutSecs", "maxRepetitions", "retries") must be provided under the "advanced" subproperty. (APM-299394)
RUM
- Resolved issue in which, after adding global entities to query, filtering did not work (no data was returned). (APM-300250)
Dynatrace API
- Fixed an issue in which some time series units in the Problems API v1 were not properly resolved. (APM-300374)
- Fixed attribute names in payload of the GET connectivity information for ActiveGate endpoint of the Deployment API. (APM-298839)
Update 86 (Build 1.218.86)
This cumulative update contains 1 resolved issue and all previously released updates for the 1.218 release.
Problem detection and analysis
- Fixed a problem with "Send test notification" in custom problem notifications where the content-type was not `application/json`. (APM-304432)
Update 89 (Build 1.218.89)
This is a cumulative update that contains all previously released updates for the 1.218 release.
Update 94 (Build 1.218.94)
This cumulative update contains 2 resolved issues and all previously released updates for the 1.218 release.
| Component | Resolved issues |
|---|---|
| Cloud Automation | 1 |
| Cluster | 1 |
Cloud Automation
- Resolved issue in which having two metrics with different entity types in an SLO resulted in being unable to evaluate the SLO. (APM-305867)
Cluster
- Fixed issue in which service metrics with multiple value conditions did not fetch data. (APM-305663)