Dynatrace Managed release notes version 1.274
- Release notes
Rollout start: Sep 11, 2023
Announcements
Red Hat Enterprise Linux support
Upgrade to this release of Dynatrace Managed is now enabled with cluster nodes running on Red Hat Enterprise Linux 8.x or 9.x.
Thresholds API sunset
With the release of Dynatrace version 1.276, we will turn off the Thresholds API. Any requests to these endpoints will stop working. Migrate your automations to the Settings API instead. For more information, see the migration guide.
Azure API Management request metrics retired
 Breaking change
As described in Microsoft documentation, Microsoft has retired the following Azure API Management requests metrics as of August 31, 2023.
- Total Gateway Requests
- Successful Gateway Requests
- Unauthorized Gateway Requests
- Failed Gateway Requests
- Other Gateway Requests
Dashboards and alerts based on these metrics will no longer work.
New metrics are available in Azure API Management Service monitoring.
New features and enhancements
New matcher attribute in log storage configuration
Infrastructure Observability | Logs
You can now use the Log record level attribute in log storage configuration:
View the origin of vulnerable libraries
Application Security | Vulnerabilities
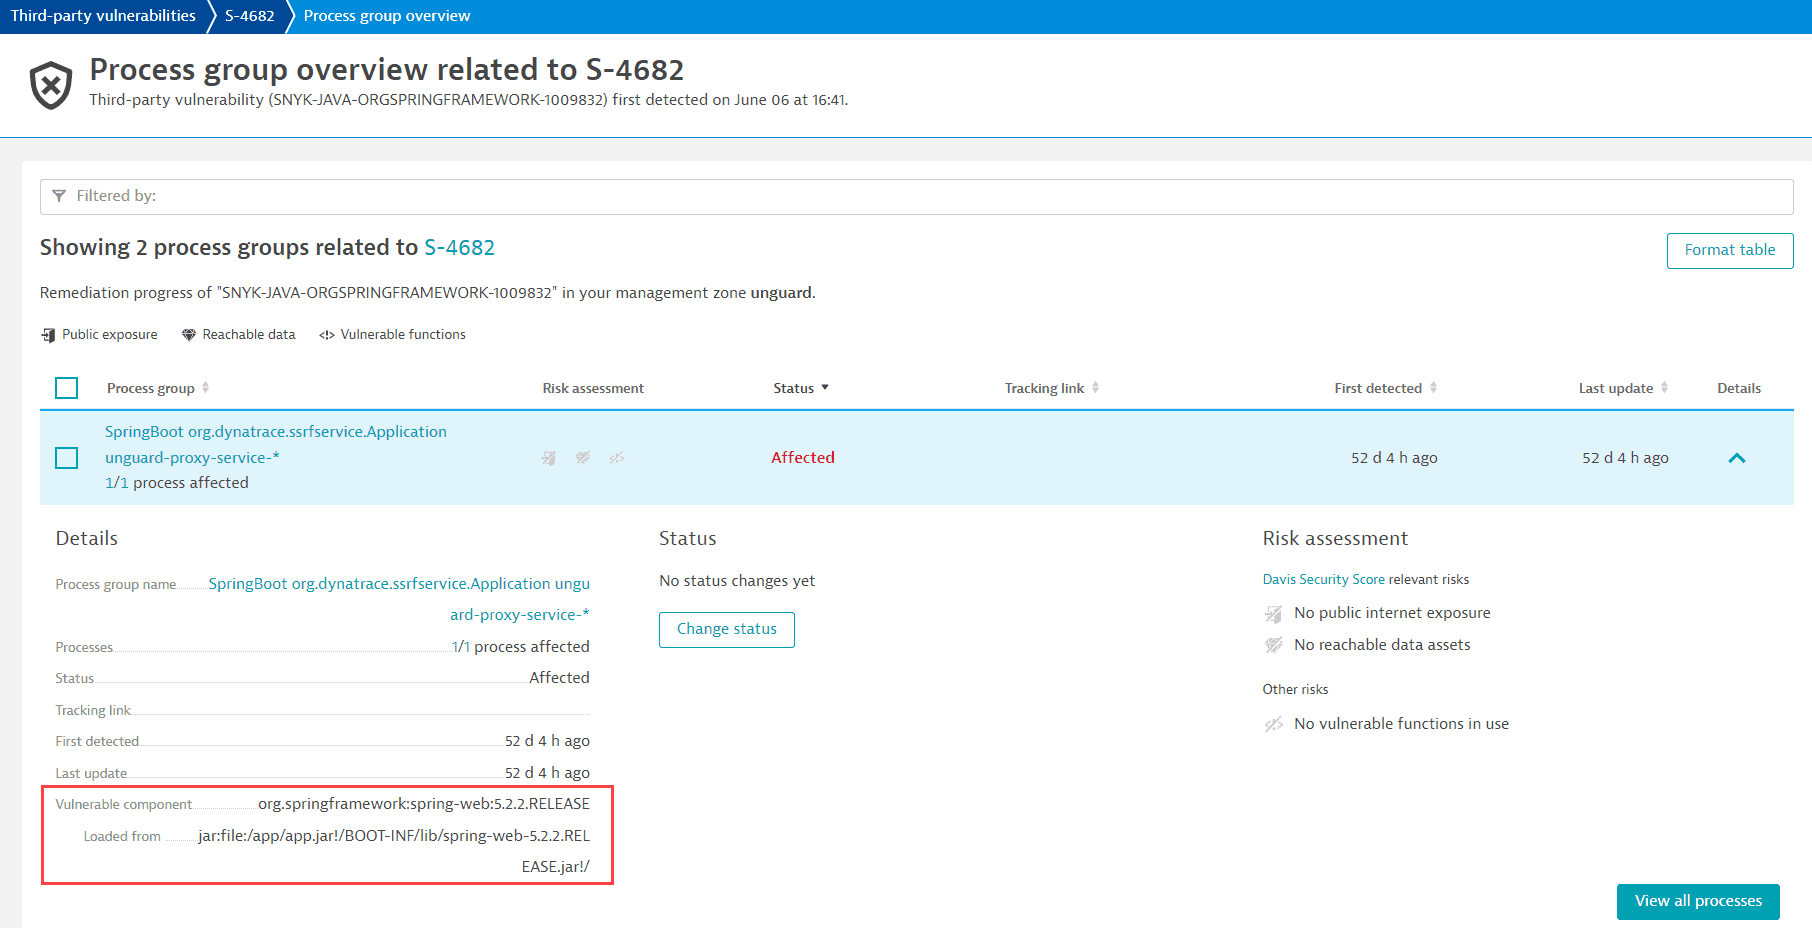
You can now view the origin of a vulnerable Java software component in the remediation tracking for process groups and processes affected by a vulnerability.
For example:

For navigation details, see Remediation tracking.
Unified services for trace ingest
Application Observability | Services
We have enhanced support for OpenTelemetry and cloud-native monitoring with a new service type, Unified service. Unified services are based on OpenTelemetry spans ingested via the ingestion APIs and provide
- Automatic baselining and Davis® AI integration
- Automatic endpoint detection
- New service metrics, such as response time, throughput, and failure rate
- Advanced horizontal topology detection
- Support for custom application metrics and application logs
- Agentless support for Istio service meshes
- Opt-in endpoint monitoring with new metrics
To get started, see Unified service.
Share your feedback in the Feedback channel for the enhancements to OpenTelemetry trace-ingest (Unified Services) released w/ v1.274 (SaaS & Managed) in the Dynatrace Community.
Detection attributes highlights
Application Observability | Services Application Observability | Databases
Attributes used for detection are marked with an asterisk ✱ on the service and database, under Properties and tags.
Unified analysis screens for Kubernetes nodes
Infrastructure Observability | Kubernetes
You can now access new unified analysis list and detail page for Kubernetes nodes.
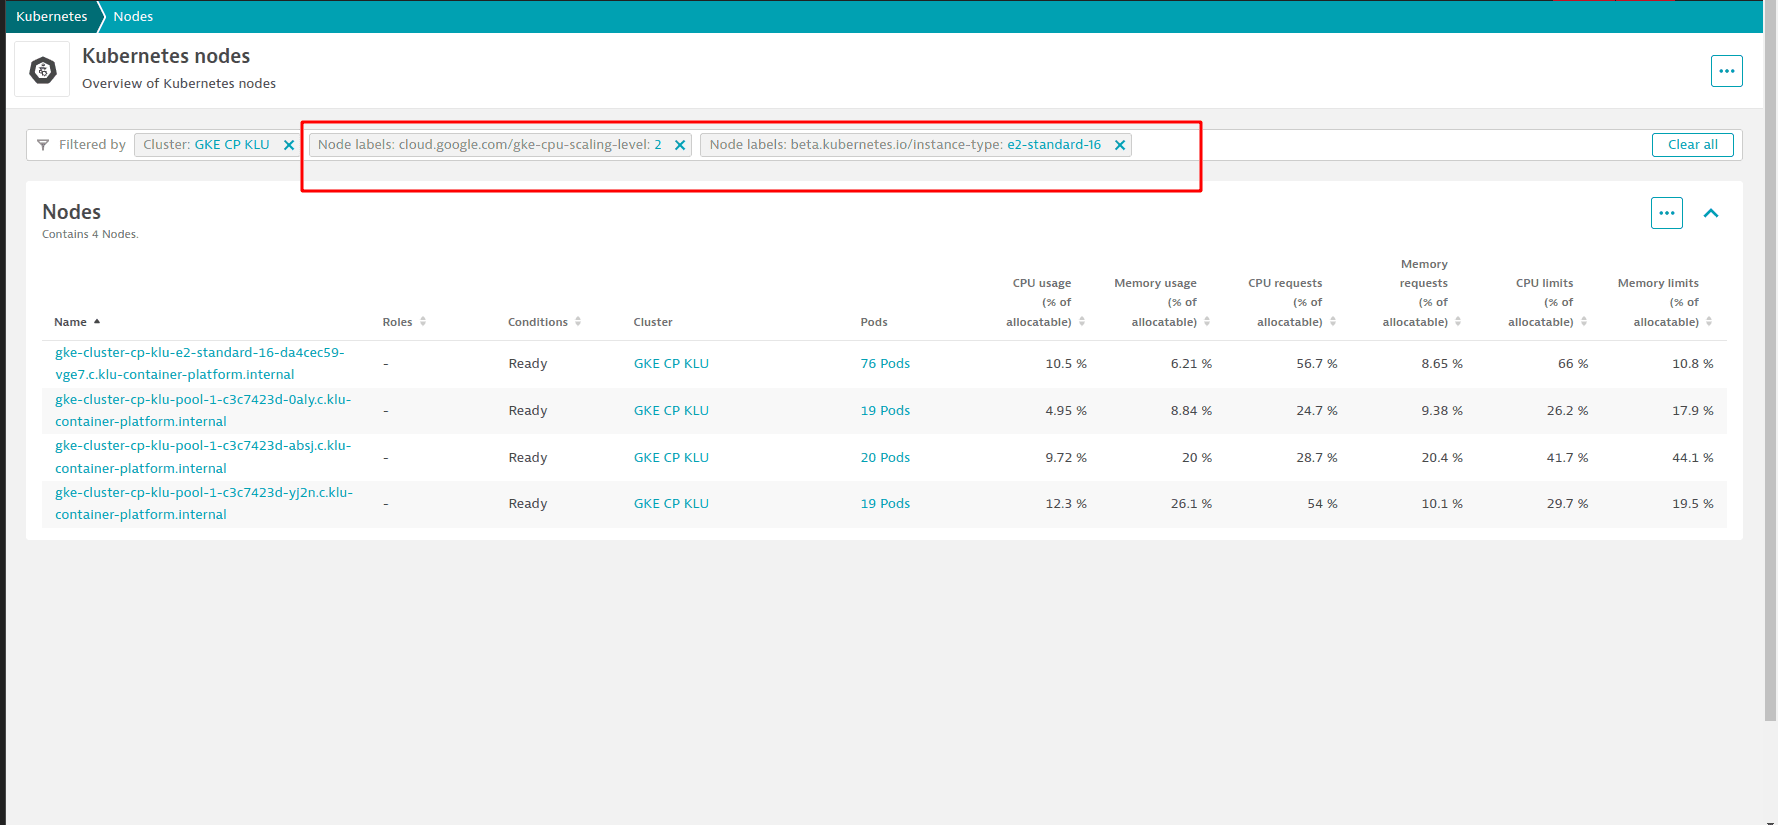
Advanced Kubernetes label filtering
Infrastructure Observability | Kubernetes
You can now apply multiple values simultaneously in the Kubernetes label filter.

Detailed OneAgent status in unified analysis host page
Infrastructure Observability | Hosts
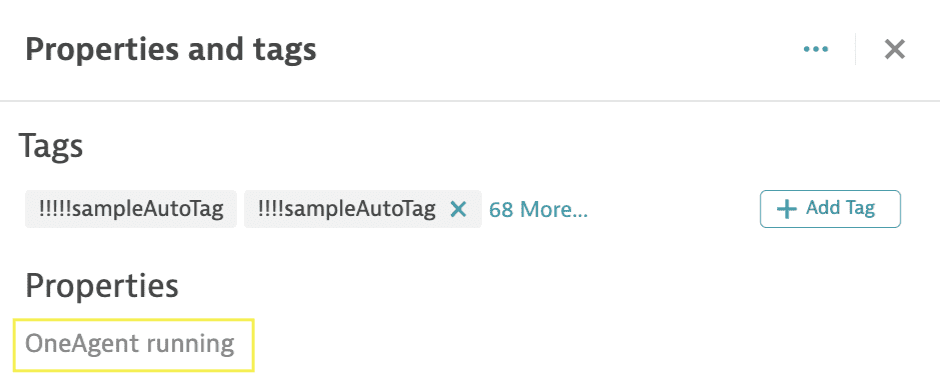
The Properties and tags section of the unified analysis host page now displays the OneAgent status.
- The status can be either active or inactive, along with a reason for the status.
- Detailed status information is available for up to 24 hours. Beyond that, the status defaults to inactive.
- An unknown status is displayed if data is unavailable.
- The status may be delayed by up to 5 minutes.

RKE2 technology grouping
Infrastructure Observability | Hosts
We've added RKE2 technology per process group instance. RKE2 agents and RKE2 servers are now grouped into separate process groups.
High System Load events trigger process instance snapshots
Infrastructure Observability | Hosts
High System Load events will now automatically trigger process instance snapshots.
Timeout for "Detect pod backoff events" alert reduced
Platform | Davis AI
The timeout for Davis problem Detect pod backoff events (after which it is closed automatically) has been changed from 1 hour to 15 minutes.
Dynatrace API
To learn about changes to the Dynatrace API in this release, see:
Operating systems support
- Added support for SUSE Linux Enterprise Server 15 SP5
- Added support for SUSE Enterprise Linux 15.5
Future Dynatrace Managed operating systems support changes
The following operating systems will no longer be supported starting 01 June 2026
- Linux: Oracle Linux 9.6
- x86-64
- Vendor announcement
- Linux: Rocky Linux 9.6
- x86-64
- Vendor announcement
The following operating systems will no longer be supported starting 01 July 2026
- Linux: SUSE Enterprise Linux 15.3
- x86-64
- Vendor announcement
The following operating systems will no longer be supported starting 01 November 2026
- Linux: Red Hat Enterprise Linux 9.4
- x86-64
- Vendor announcement
- Linux: Ubuntu 16.04
- x86-64
- Vendor announcement
Past Dynatrace Managed operating systems support changes
The following operating systems are no longer supported since 01 July 2025
- Linux: Oracle Linux 7.9
- x86-64
- Vendor announcement
The following operating systems are no longer supported since 01 December 2025
- Linux: Red Hat Enterprise Linux 8.8, 9.2, 9.5
- x86-64
- Vendor announcement
- Linux: Oracle Linux 9.5
- x86-64
- Vendor announcement
- Linux: Rocky Linux 9.5
- x86-64
- Vendor announcement
The following operating systems are no longer supported since 01 January 2026
- Linux: Debian 10
- x86-64
- Vendor announcement
Resolved issues
General Availability (Build 1.274.157)
The 1.274 GA release contains 22 resolved issues.
| Component | Resolved issues |
|---|---|
| Application Security | 1 |
| Cluster | 20 |
| Synthetic monitoring | 1 |
Application Security
- On the vulnerability details page, the number of resolved process groups is shown independent of timeframe. (RSA-10953)
Cluster
- Resolved an issue where very large problems could halt problem processing. (DAVIS-5701)
- The action validation in extension is now stricter to avoid incorrect error messages. (TI-7825)
- We now display errors from thrown by the execute endpoint. (EXA-7365)
- Cluster now waiting for connection responses from all ActiveGates after ActiveGate update. (Cluster wasn't waiting for all ActiveGates to respond if an attempt to connect to VMware was successful.). (HOST-3654)
- Improved robustness to prevent very rare cases where root cause analysis was not performed when more than 1,000 baselining events were raised on the same entity within a few seconds. (DAVIS-5360)
- Corrected the problems count in the weekly report. (DAVIS-5334)
- Unicode whitespace characters at the end of an LQL query no longer cause an error. (LOG-4066)
- The status of problems that receive updates after resolving is now UPDATED instead of RESOLVED. The RESOLVED status is now unique between the previous and succeeding records for the same event ID. (DAVIS-5443)
- Added extensibility to the new service UI. (TI-7916)
- We disabled obsolete custom process monitoring rules, fixing the issue in which it was impossible to delete them. (HOST-3507)
- Corrected a Deployment page reference to point to the newly released Dynatrace Operator v0.13.0. (K8S-6907)
- Fixed a race condition in the calculated service metric updating logic that could occur when two or more configuration updates were done within a short timeframe, which resulted in the metric not showing the correct data values until the next update refreshed the configuration. (TI-7634)
- URL filters without a value are now ignored and no longer cause an error. (RUM-12092)
- Fixed an issue that caused HTTP 500 to be returned by the metric query/definition endpoints of the Timeseries API v1 if the User-Agent header was not set in the request. (CLUSTER-8252)
- Resolved issue that prevented problem comments from being read shortly after a problem was raised if the problem was raised slightly into the future. (DAVIS-5356)
- Removed unavailable dimensions in unified services' metrics. In the Data explorer, unified metrics (for example, `Response time`) are separated by the type of aggregation and represented as separate metrics. Previously, all metrics in the "Split by" allowed the same dimensions to be selected, and if an unavailable dimension was selected, "No data" was displayed. Now, the "Split by" field shows only those dimensions for which the metric contains data and a chart can be displayed. (TI-7960)
- Corrected the new database overview page to show the correct throughput metric. (TI-7724)
- Fixed issue during the process of restoring visit backups causing dropped visits. (RUM-12405)
- Fixed a bug where live user sessions without visitor ID were dropped during rolling updates. (RUM-12292)
- Cluster now waiting for connection responses from all ActiveGates after ActiveGate update. (Cluster wasn't waiting for all ActiveGates to respond if an attempt to connect to VMware was successful.). (HOST-3654)
Synthetic monitoring
- Fixed an issue with validation of credentials in a customized script of a browser monitor on-demand execution. (SYNTH-6024)
Update 173 (Build 1.274.173)
This cumulative update contains 1 resolved issue and all previously released updates for the 1.274 release.
Cluster
- Fixed the "Include backup of Log Monitoring v2 events" option in the backup configuration that didn't work correctly. (CLD-8000)
Update 189 (Build 1.274.189)
This is a cumulative update that contains all previously released updates for the 1.274 release.
Update 241 (Build 1.274.241)
This cumulative update contains 2 resolved issues and all previously released updates for the 1.274 release.
Cluster
- Fixed an issue where remote deletion in Multi-DC did not work correctly. (CLUSTER-10553)
- Fixed an issue where the user is unable to view any services on the Service page. (TI-9754)
Update 275 (Build 1.274.275)
This is a cumulative update that contains all previously released updates for the 1.274 release.