Pure Storage FlashArray extension
- Latest Dynatrace
- Extension
Monitor your Pure Storage FlashArray alerts, capacity, and performance metrics.
Get started
Overview
Monitor multiple FlashArrays and aggregate these into a single dashboard, or group them together by customer-defined environments.
Use cases
- View high-level array configuration.
- Monitor performance metrics and configure alerts.
- Correlate FlashArray metrics with other platforms.
Compatibility information
- Purity//FA version 6.1.0+: Some metrics may have been exposed in later versions of the Purity REST API 2.x and Pure Storage OpenMetrics exporter.
Exporter compatibility:
- Purity//FA version 6.6.11 and earlier: Requires the external exporter.
- Purity//FA version 6.7.0+: The OpenMetrics Exporter is integrated natively.
Activation and setup
To enable the extension, find Pure Storage FlashArray in the Dynatrace Hub.
To use this extension, Dynatrace will need to connect to the Pure Storage OpenMetrics exporter. This exporter receives requests for exposed metric endpoints and sends the request to the FlashArray via the REST API client. The REST results are interpreted and sent back to Dynatrace in the OpenMetrics standard format for ingestion.
The metrics exporter can be connected to in one of two ways:
-
Purity//FA version 6.7.0+: Native exporter (internal to array).
- For more information about the exporter, see Pure Technical Support.
- For configuration steps, see Set up the native metrics exporter.
-
Purity//FA version 6.6.11 and earlier: Open-source exporter (external).
- For more information about the exporter, see pure-fa-openmetrics-exporter on GitHub.
- For configuration steps, see Configure Open Source Metrics Exporter.
Both exporters provide the same telemetry data, only the integrated version will receive feature request updates. It depends on your Purity//FA version.
Check the compatibility section for latest information on specific Dynatrace prerequisites.
Set up the native metrics exporter
Purity//FA version 6.7.0+.
Metrics can be consumed directly from the array.
-
Enable the extension, see Activation.
-
At the top of this page, select the blue Add configuration button.
-
Select ActiveGate.
-
Select your deployed ActiveGate group capable of connecting to the FlashArray, then select Next.
-
Configure your endpoints with the following information:
- URL:
https://arrayname01.fqdn/metrics/array?namespace=purefa - Authentication scheme:
Bearer (token) authentication - Token:
111111-1111-1111-111111111111(enter array token) - Press + Add endpoint to add additional metric endpoints.
- URL:
-
Select Next.
-
Select Attributes.
- Add a descriptive name for the configuration.
- Select the required metric feature sets to be ingested.
-
Select Save.
-
Log in to the Dynatrace ActiveGate which has access to the OpenMetrics Exporter. Restart the ActiveGate
extensionsmoduleservice to download and enable the configuration.# systemctl restart extensionsmodule -
The status should change from Pending to Ok
-
After a few minutes the status should show OK If Error is displayed, then check troubleshooting section.
The OpenMetrics Overview dashboard requires metrics from the following endpoints:
/metrics/array/metrics/hosts/metrics/volumes.
Alternatively, configure all metric endpoints and select metrics from the feature sets in the next page.
Configure Open Source Metrics Exporter
Purity//FA 6.6.11 and earlier
The external metrics exporter is a very lightweight binary/container which queries the array REST API and converts the response into a standardized open metrics format to be consumed by monitoring and observability platforms.
-
Enable the extension, see Activation.
-
At the top of this page, select Add to environment.
-
In Configuration > Versions, select Add monitoring configuration.
-
Select the Monitor remotely tab.
-
In the ActiveGates section, select the appropriate ActiveGate group and then select Next step.
-
In the Prometheus section, add configuration entries for each metric endpoint to be scraped.
-
Select Add endpoint.
-
Select the URL, according to the exporter:
- Open Source Exporter URL:
http://pure-ome-address:9490/metrics/array?endpoint=arrayname01 - Native Exporter URL:
http://array-address/metrics/array?namespace=purefa - TLS: use HTTPS
- Open Source Exporter URL:
-
Authentication scheme: In the drop-down menu, select No authentication.
-
Skip ssl verification: Select the Skip ssl verification toggle so that it is enabled.
Refrain from scraping all metrics using
/metrics*as these are expensive queries in large environments. -
-
In the Finalize configuration section, check the configuration and select the required metric feature sets to be ingested into Dynatrace. Then, select Activate.
-
Log in to the Dynatrace ActiveGate that has access to the OpenMetrics Exporter and restart the
extensionsmoduleservice to download and enable the configuration.# systemctl restart extensionsmodule -
After a few minutes the configuration will appear with status Ok and metrics will be ingested.
Authentication
Dynatrace requires secure connections when using any kind of authentication. Pure Storage OpenMetrics Exporter must be configured with either
- Insecure: http with API
tokens.yamlfile and no authentication. - Secure: TLS https with bearer token.
Dynatrace will not allow Pure Storage OpenMetrics Exporter to be configured with standard HTTP and bearer token.
If using TLS, ensure url is set to https.
No further Dynatrace configuration is required if Skip ssl verification is enabled.
Alternatively, the ActiveGate will require the certificate to be added to the OS trust store and ActiveGate collector configuration.
For more information, see Determine the required CA certificates and prepare them as a file.
See Configure Pure Storage OpenMetrics exporter for configuration dependencies.
Metric endpoints and scrape intervals
Performance metrics are scraped as frequently as possible to capture trends in data. Other metrics are scraped less frequently to reduce the amount of metrics ingested into the platform.
By default, this extension scrape endpoints at predefined intervals as follows:
| Feature Set | Device Metric Endpoint | Scrape Interval | Required for Fleet Overview dashboard |
|---|---|---|---|
default |
| one minute | Yes |
Alerts |
| five minutes | Yes |
Directories |
| five minutes | |
Hosts |
| one minute | Yes |
HW |
| five minutes | |
Pods |
| one minute | |
Volumes |
| one minute | Yes |
To customize these scrape intervals, contact your Dynatrace representative to configure a custom extension.
Details
The integration can provide performance data at the array, host, volume and pod level, as well as high-level capacity and configuration information.
This extension provides two integrated dashboards:
-
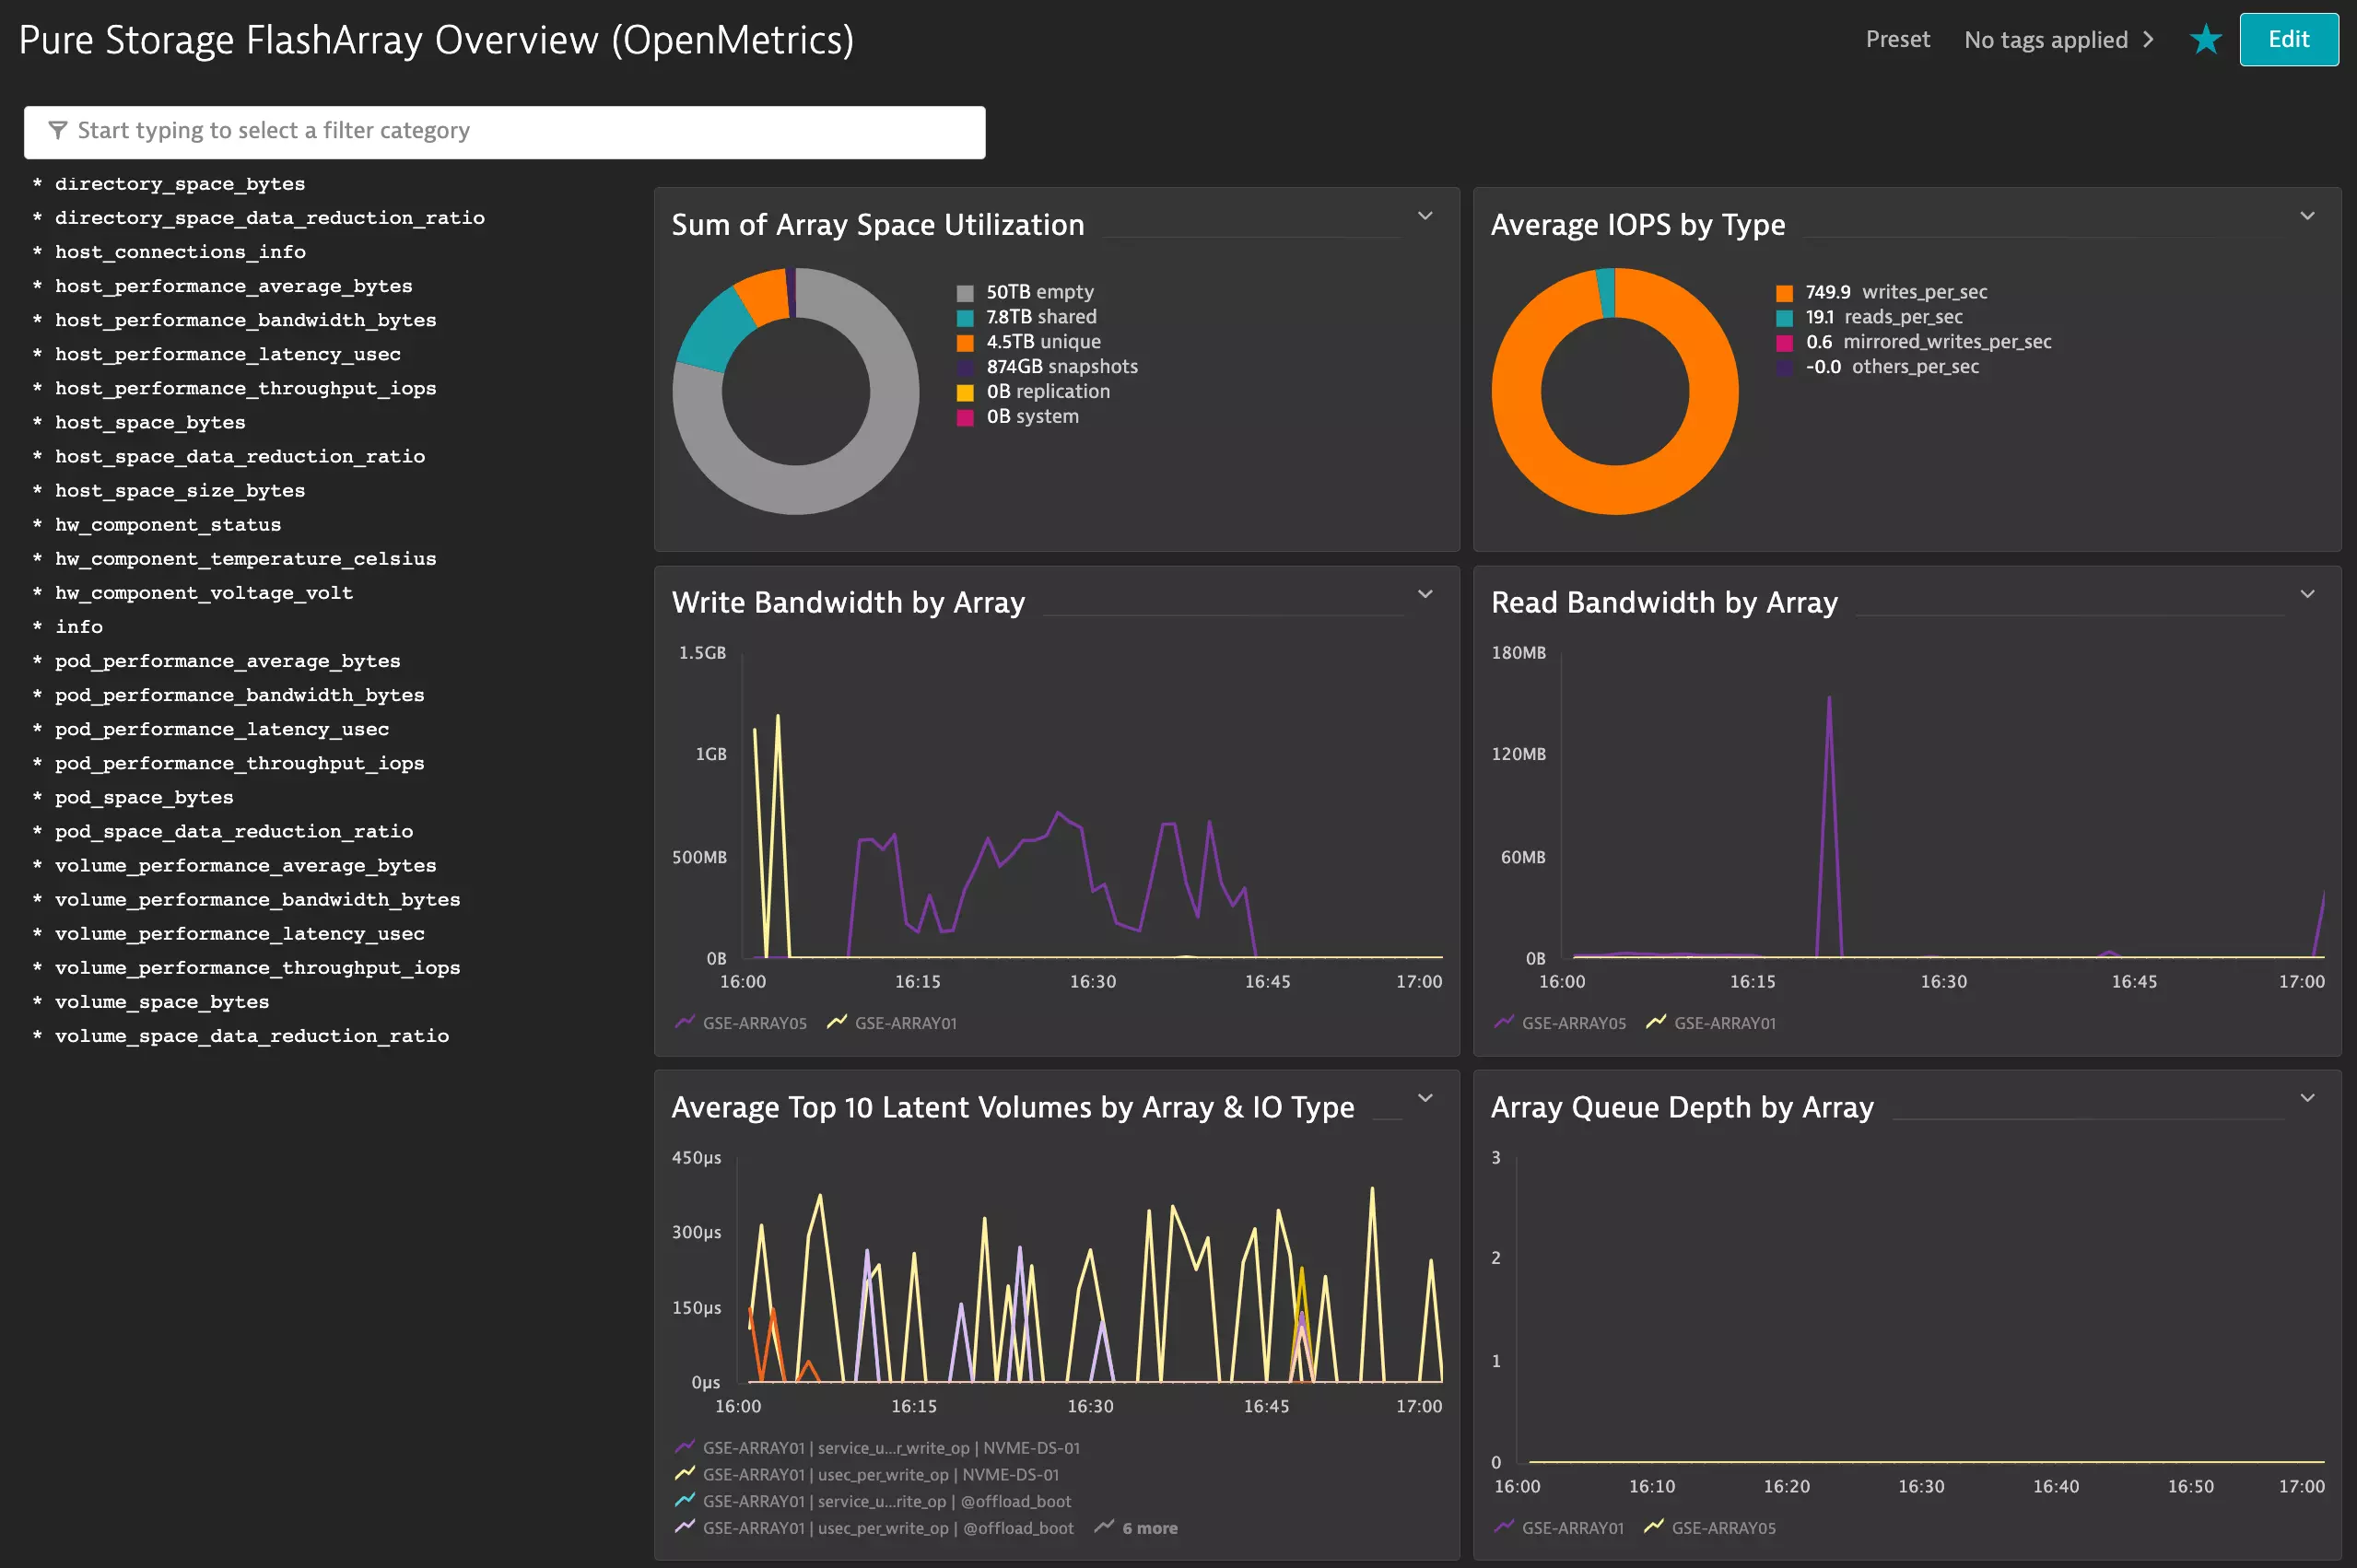
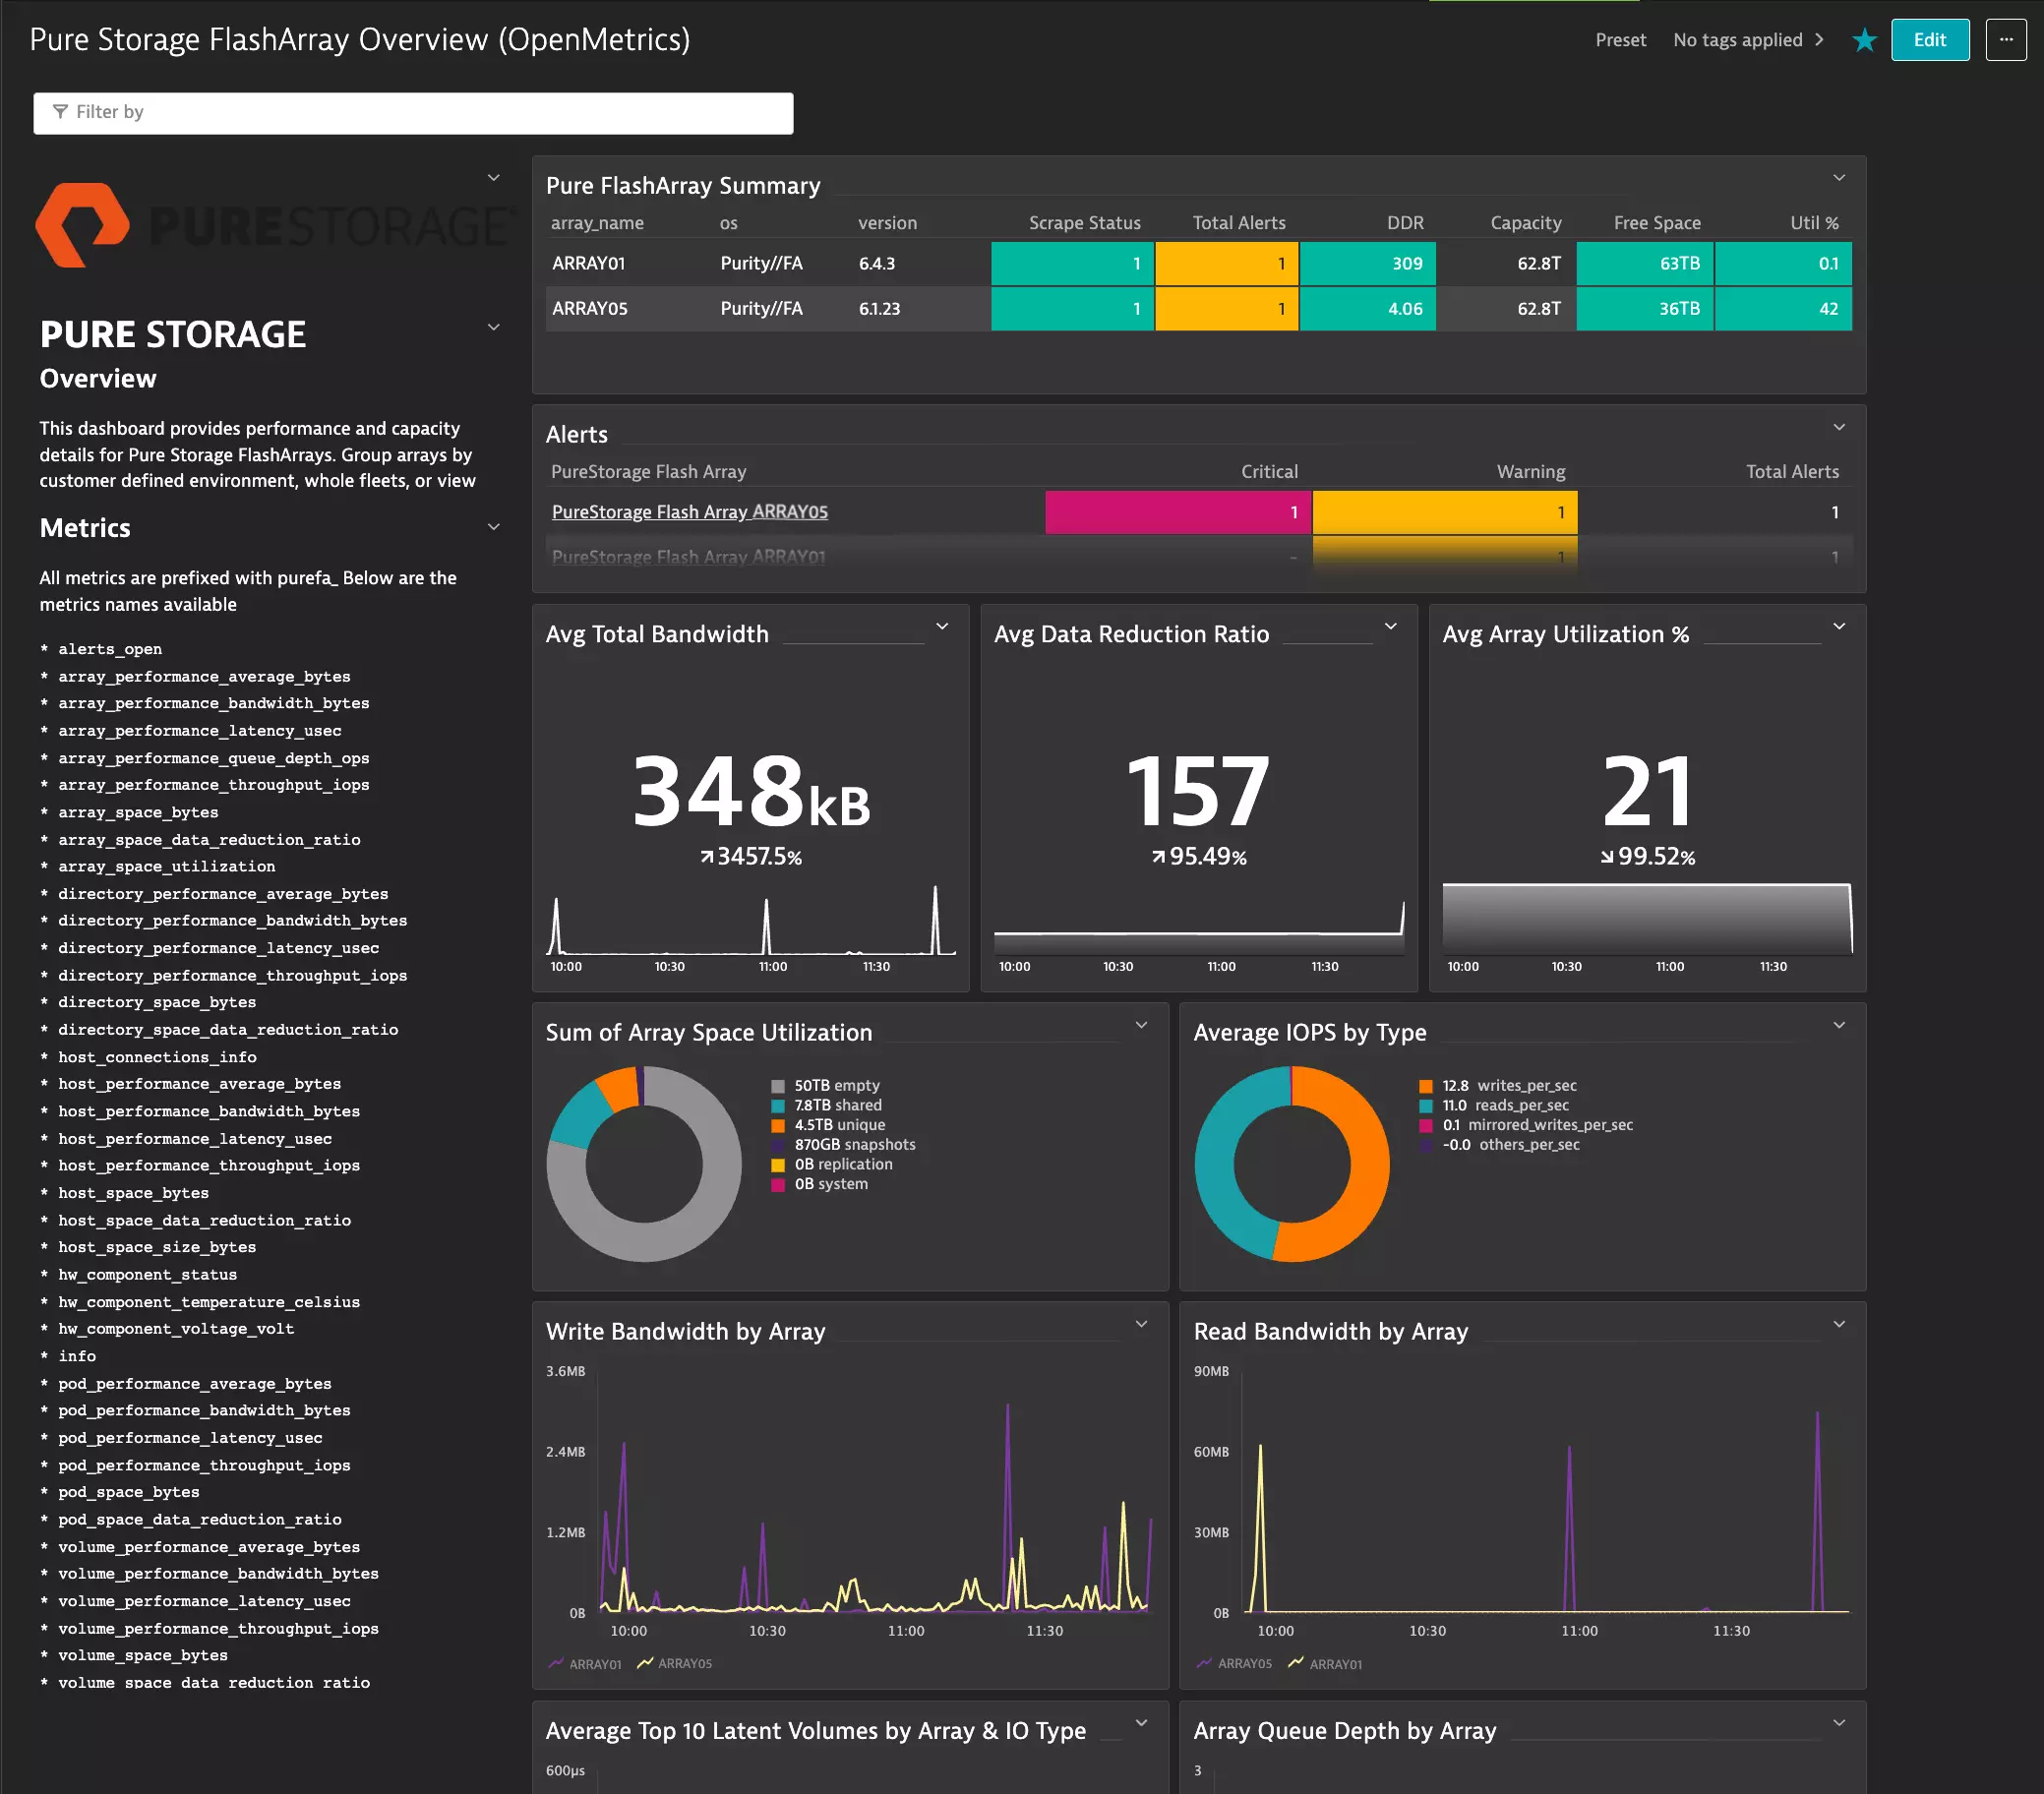
Pure storage overview (OpenMetrics) dashboard. Monitor your fleet of FlashArrays in one simple view, which displays:
- Purity//FA version.
- Alerts and criticality.
- Data reduction ratio.
- Capacity utilization.
- Data throughput.
- IOPS by type.
This dashboard requires certain metric endpoints and feature sets. For more information, see Metric endpoints and scrape intervals.
-
Pure storage entity overview dashboard. Drill down into individual FlashArray configurations and components.
Licensing and costs
There is no charge to use the extension. You are only charged for the data that the extension ingests.
The Pure Storage FlashArray extension ingests custom metrics, which consume Davis Data Units (DDUs) (Dynatrace classic license) or Metrics powered by Grail (DPS), according to your license model.
To calculate license consumption per array, you need the following information:
- Number of hosts
- Number of pods
- Number of volumes
- Number of NICs
- Number of hardware components
- Number of temp sensors
- Number of power supplies
- Number of directories (filesystems)
The following formula provides the number of metric data points per minute, assuming all feature sets are enabled.
(45 + (39 * hosts) + (56 * pods) + (38 * volumes))+(((10 * NICs) + total hardware components + temp sensors + power supplies + (26 * directories) + 2) / 5)
- The first piece of the equation
(45 + (39 * hosts) + (56 * pods) + (38 * volumes))covers metrics polled every one minute. - The second piece of the equation covers metrics polled every five minutes (divided by 5 to express per-minute).
Dynatrace Platform Subscription
In the Dynatrace Platform Subscription, metric ingestion consumes Metrics powered by Grail according to the number of ingested metric data points.
To calculate the approximate yearly consumption, apply the following calculation: <metric data points per minute> * 60 minutes * 24 hours * 365 days.
Dynatrace classic license
In the classic licensing model, metric ingestion consumes Davis Data Units (DDUs) at the rate of .001 DDUs per metric data point. Multiply the above formula for annual data points by .001 to estimate annual DDU usage.
The DDU cost above does not include any possible log events or custom events that are triggered by the extension. For more information, see DDU events.
Feature sets
When activating your extension using a monitoring configuration, you can limit monitoring to one of the feature sets. To work properly, the extension has to collect at least one metric after the activation.
In highly segmented networks, feature sets can reflect the segments of your environment. Then, when you create a monitoring configuration, you can select a feature set and a corresponding ActiveGate group that can connect to this particular segment.
All metrics that aren't categorized into any feature set are considered to be the default and are always reported.
A metric inherits the feature set of a subgroup, which in turn inherits the feature set of a group. Also, the feature set defined on the metric level overrides the feature set defined on the subgroup level, which in turn overrides the feature set defined on the group level.
Hosts
| Metric name | Metric key | Description |
|---|---|---|
| PureFA Host Connections Info | purefa_host_connections_info | FlashArray host volumes connections |
| PureFA Host Connectivity Info | purefa_host_connectivity_info | FlashArray host connectivity info |
| PureFA Host Performance Average Bytes | purefa_host_performance_average_bytes | FlashArray host average operations size in bytes |
| PureFA Host Performance Bandwidth Bytes | purefa_host_performance_bandwidth_bytes | FlashArray host bandwidth in bytes per second |
| PureFA Host Performance Latency Usec | purefa_host_performance_latency_usec | FlashArray host latency in microseconds |
| PureFA Host Performance Throughput Iops | purefa_host_performance_throughput_iops | FlashArray host throughput in iops |
| PureFA Host Space Bytes | purefa_host_space_bytes | FlashArray host space in bytes |
| PureFA Host Space Data Reduction Ratio | purefa_host_space_data_reduction_ratio | FlashArray host space data reduction |
Array
| Metric name | Metric key | Description |
|---|---|---|
| PureFA Array Performance Average Bytes | purefa_array_performance_average_bytes | FlashArray array average operations size |
| PureFA Array Performance Bandwidth Bytes | purefa_array_performance_bandwidth_bytes | FlashArray array bandwidth |
| PureFA Array Performance Latency Usec | purefa_array_performance_latency_usec | FlashArray array latency |
| PureFA Array Performance Queue Depth Ops | purefa_array_performance_queue_depth_ops | FlashArray array queue depth size |
| PureFA Array Performance Throughput Iops | purefa_array_performance_throughput_iops | FlashArray array throughput |
| PureFA Array Space Bytes | purefa_array_space_bytes | FlashArray array space in bytes |
| PureFA Array Space Data Reduction Ratio | purefa_array_space_data_reduction_ratio | FlashArray array space data reduction |
| PureFA Array Space Utilization | purefa_array_space_utilization | FlashArray array space utilization in percent |
Alerts
| Metric name | Metric key | Description |
|---|---|---|
| PureFA Alerts Open | purefa_alerts_open | FlashArray open alert events |
Drives
| Metric name | Metric key | Description |
|---|---|---|
| PureFA Drive Capacity Bytes | purefa_drive_capacity_bytes | FlashArray drive capacity bytes |
default
| Metric name | Metric key | Description |
|---|---|---|
| PureFA Info | purefa_info | FlashArray system information |
Pods
| Metric name | Metric key | Description |
|---|---|---|
| PureFA Pod Mediator Status | purefa_pod_mediator_status | FlashArray pod mediator status |
| PureFA Pod Performance Average Bytes | purefa_pod_performance_average_bytes | FlashArray pod average operations size |
| PureFA Pod Performance Bandwidth Bytes | purefa_pod_performance_bandwidth_bytes | FlashArray pod bandwidth |
| PureFA Pod Performance Latency Usec | purefa_pod_performance_latency_usec | FlashArray pod latency |
| PureFA Pod Performance Replication Bandwidth Bytes | purefa_pod_performance_replication_bandwidth_bytes | FlashArray pod replication bandwidth |
| PureFA Pod Performance Throughput Iops | purefa_pod_performance_throughput_iops | FlashArray pod throughput |
| PureFA Pod Replica Links Lag Average Sec | purefa_pod_replica_links_lag_average_sec | FlashArray pod links average lag seconds |
| PureFA Pod Replica Links Lag Max Sec | purefa_pod_replica_links_lag_max_sec | FlashArray pod links max lag seconds |
| PureFA Pod Replica Links Performance Bandwidth Bytes | purefa_pod_replica_links_performance_bandwidth_bytes | FlashArray pod links bandwidth |
| PureFA Pod Space Bytes | purefa_pod_space_bytes | FlashArray pod space in bytes |
| PureFA Pod Space Data Reduction Ratio | purefa_pod_space_data_reduction_ratio | FlashArray pod space data reduction |
Network Interfaces
| Metric name | Metric key | Description |
|---|---|---|
| PureFA Network Interface Performance Bandwidth Bytes | purefa_network_interface_performance_bandwidth_bytes | FlashArray network interface bandwidth |
| PureFA Network Interface Performance Errors | purefa_network_interface_performance_errors | FlashArray network interface errors |
| PureFA Network Interface Performance Throughput Pkts | purefa_network_interface_performance_throughput_pkts | FlashArray network interface throughput |
Directories
| Metric name | Metric key | Description |
|---|---|---|
| PureFA Directory Performance Average Bytes | purefa_directory_performance_average_bytes | FlashArray directory average operations size |
| PureFA Directory Performance Bandwidth Bytes | purefa_directory_performance_bandwidth_bytes | FlashArray directory bandwidth |
| PureFA Directory Performance Throughput Iops | purefa_directory_performance_throughput_iops | FlashArray directory throughput |
| PureFA Directory Performance Latency Usec | purefa_directory_performance_latency_usec | FlashArray directory latency |
| PureFA Directory Space Bytes | purefa_directory_space_bytes | FlashArray directory space in bytes |
| PureFA Directory Space Data Reduction Ratio | purefa_directory_space_data_reduction_ratio | FlashArray directory space data reduction |
Volumes
| Metric name | Metric key | Description |
|---|---|---|
| PureFA Volume Space Bytes | purefa_volume_space_bytes | FlashArray volume space in bytes |
| PureFA Volume Performance Average Bytes | purefa_volume_performance_average_bytes | FlashArray volume average operations size |
| PureFA Volume Performance Bandwidth Bytes | purefa_volume_performance_bandwidth_bytes | FlashArray volume throughput |
| PureFA Volume Performance Latency Usec | purefa_volume_performance_latency_usec | FlashArray volume latency |
| PureFA Volume Performance Throughput Iops | purefa_volume_performance_throughput_iops | FlashArray volume throughput |
| PureFA Volume Space Data Reduction Ratio | purefa_volume_space_data_reduction_ratio | FlashArray volume space data reduction |
HW
| Metric name | Metric key | Description |
|---|---|---|
| PureFA Hw Component Status | purefa_hw_component_status | FlashArray hardware component status |
| PureFA Hw Component Temperature Celsius | purefa_hw_component_temperature_celsius | FlashArray hardware component temperature |
| PureFA Hw Component Voltage Volt | purefa_hw_component_voltage_volt | FlashArray hardware component voltage |
| PureFA Hw Controller Uptime | purefa_hw_controller_mode_since_timestamp_seconds | FlashArray hardware controller uptime in seconds |
| PureFA Hw Controller Info | purefa_hw_controller_info | FlashArray controller info |
FAQ
"GENERIC_ERROR:There is no endpoint that could have connected."
-
Symptoms:
When scraping metrics, the following error occurs:
Failed to assign monitoring configuration to ActiveGate. Reason: GENERIC_ERROR:There is no endpoint that could have connected. -
Cause: The ActiveGate has not been successful in reaching the endpoint.
-
Resolution: There are a number things to check here:
-
Check that the IP address or fully qualified domain name is reachable from the ActiveGate.
-
Check that the connection is via HTTPS and not HTTP.
-
Check the port number:
- Native Exporter: There is no need to specify the port number. The default HTTPS port (443) will be used.
- Open Source Exporter: Confirm the port number is correct.
-
Confirm there are no typos in the endpoints, see Metric endpoints and scrape intervals.
-
"ERROR: Querying Native Array Exporter returns 'There are no queryMetrics defined in the extension'"
-
Symptoms: When scraping metrics, the following messages appear:
INFO:There are no queryMetrics defined in the extension. Nothing to query Prometheus API for.ERROR:GENERIC_ERROR:Failed to query 'https://<array_address>/metrics/array?namespace=purefa/' for metrics: purefa_volume_space_bytes, purefa_volume_performance_average_bytes, purefa_volume_performance_bandwidth_bytes, purefa_volume_performance_latency_usec, purefa_volume_performance_throughput_iops, purefa_volume_space_data_reduction_ratio, purefa_network_interface_performance_bandwidth_bytes, purefa_network_interface_performance_errors, purefa_array_performance_average_bytes, purefa_network_interface_performance_throughput_pkts, purefa_array_performance_bandwidth_bytes, purefa_array_performance_latency_usec, purefa_array_performance_queue_depth_ops, purefa_array_performance_throughput_iops, purefa_array_space_bytes, purefa_pod_mediator_status, purefa_array_space_data_reduction_ratio, purefa_array_space_utilization, purefa_pod_performance_average_bytes, purefa_pod_performance_bandwidth_bytes, purefa_host_connections_info, purefa_host_performance_average_bytes, purefa_pod_performance_latency_usec, purefa_host_performance_bandwidth_bytes, purefa_pod_performance_replication_bandwidth_bytes, purefa_host_performance_latency_usec, purefa_host_performance_throughput_iops, purefa_pod_performance_throughput_iops, purefa_host_space_bytes, purefa_pod_replica_links_lag_average_sec, purefa_host_space_data_reduction_ratio, purefa_pod_replica_links_lag_max_sec, purefa_pod_replica_links_performance_bandwidth_bytes, purefa_pod_space_bytes, purefa_pod_space_data_reduction_ratio, Reason: Invalid content type (https://<array_address>/metrics/array?namespace=purefa//query): text/html;charset=UTF-8 [status code=27]; -
Cause: The agent might be pointing to an array running Purity//FA 6.6.10 and earlier and the exporter is not available.
-
Resolution: Use the (external) Open Source OpenMetrics exporter, see pure-fa-openmetrics-exporter on GitHub.
ERROR: Failed to query /metrics/directories
-
Symptoms: The following errors are seen in the logs.
-
Error1:
DEVICE_CONNECTION_ERROR:Failed to query 'http://pure-ome:9590/metrics/directories?endpoint=arrayname.fqdn/' for metrics: -
Error 2:
OK:Verified successfully 5 of 5 Prometheus endpoint(s). Starting polling of verified endpoints. Non verified endpoints will be verified again in next interval.; DEVICE_CONNECTION_ERROR:Failed to query 'http://pure-ome:9590/metrics/directories?endpoint=arrayname.fqdn/'
-
-
Cause: FA file is not enabled on the array, therefore there are not file directories to list.
-
Resolution: Remove the endpoint query scraping
/metrics/directories.
