MariaDB extension
- Latest Dynatrace
- Extension
Remotely monitor your MariaDB instances, collect key KPIs & slow queries details
Get started
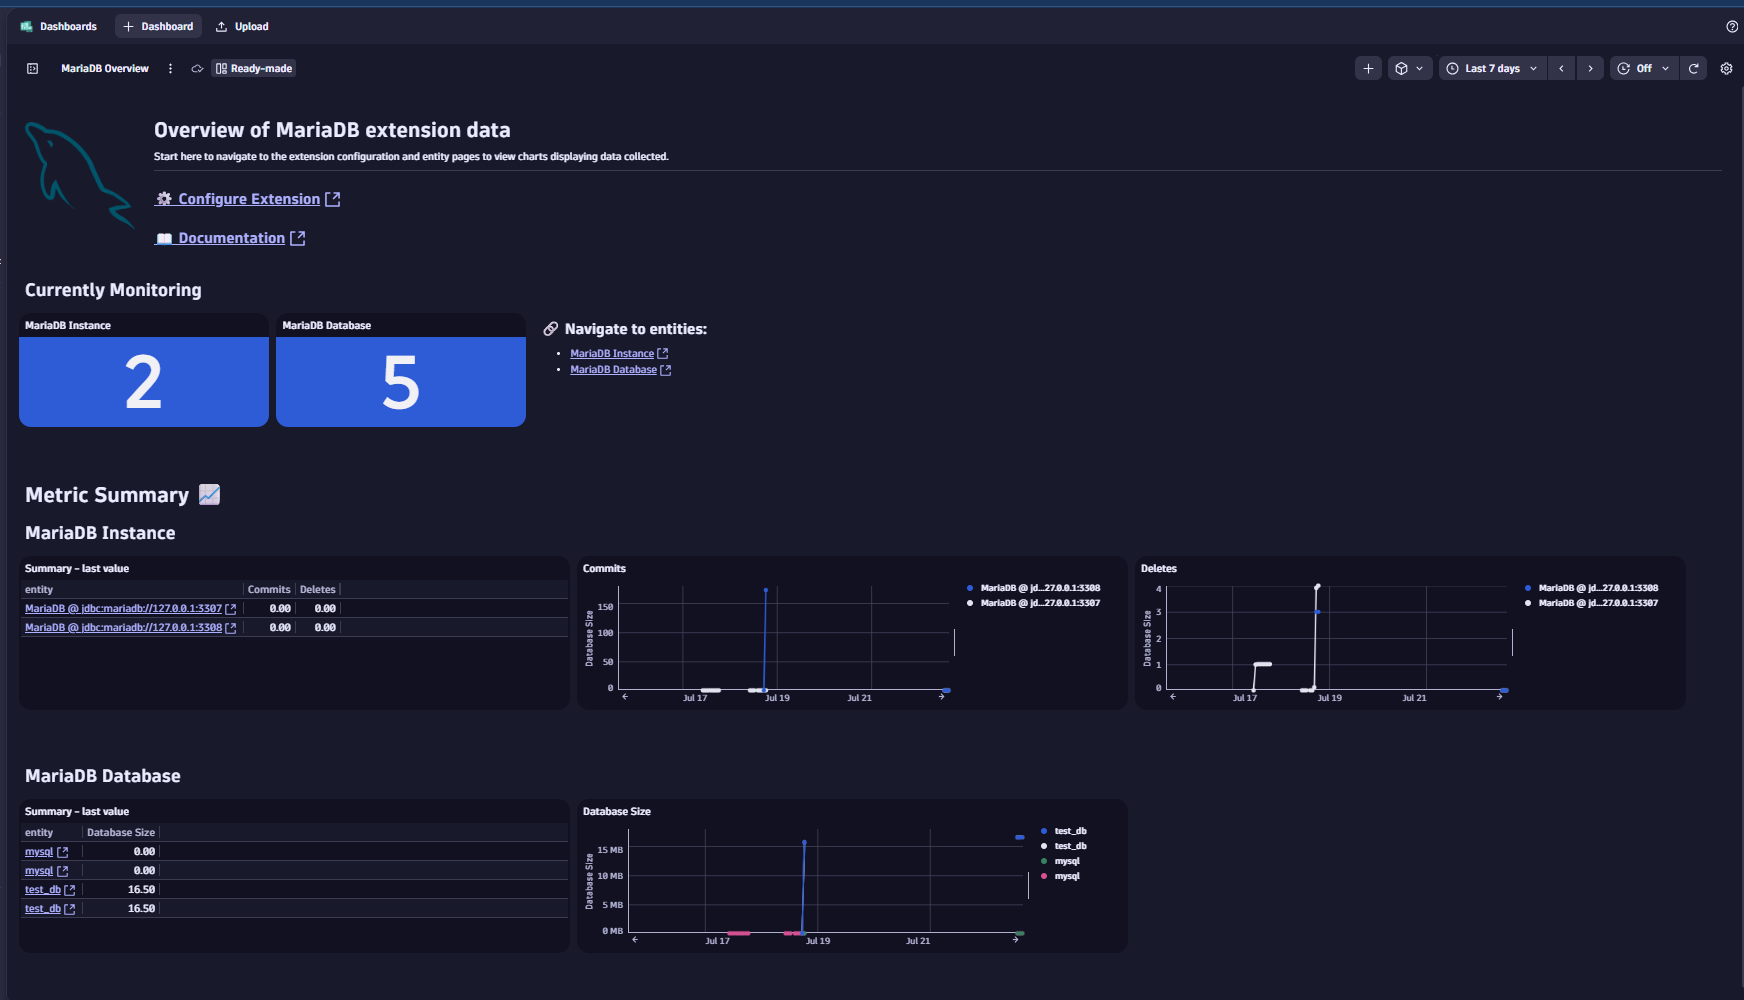
Overview
Monitor your MariaDB instances remotely and collect key performance indicators and slow query details.
Requirements
-
Install ActiveGate with version 1.295 or later.
-
Download the Java 8+ platform-independent connector, and copy the JAR file to this directory on all ActiveGates in your desired group:
- Windows:
C:\ProgramData\dynatrace\remotepluginmodule\agent\conf\userdata\libs - Linux:
/var/lib/dynatrace/remotepluginmodule/agent/conf/userdata/libs
- Windows:
-
Ensure the
dtuseraguser has read access to the driver. -
Add
custom_code_jdbc_allowed=trueto extensionsuser.conf. -
Restart the EEC service.
-
Ensure the performance schema is activated and enabled for the MariaDB instances you monitor.
-
Download the MariaDB JDBC driver from MariaDB Downloads.
-
Create a dedicated database user in your database instance with necessary permissions. Dynatrace uses this user to run monitoring queries against your MariaDB database.
-
Configure a user with permissions
- Create a user that is identified by a native password. Customize the username and password as needed:
CREATE USER 'dynatrace'@'%' IDENTIFIED BY 'password';-
Grant the user these permissions:
GRANT SELECT ON performance_schema.* TO 'dynatrace'@'%';- Allows querying the performance_schema database.
GRANT PROCESS ON *.* TO 'dynatrace'@'%';- Allows viewing thread and connection metrics for all users.
GRANT SHOW DATABASES ON *.* TO 'dynatrace'@'%';- Allows viewing database metrics for all databases.
GRANT SELECT ON sys.x$memory_global_by_current_bytes TO 'dynatrace'@'%';- Allows querying memory statistics.
GRANT SLAVE MONITOR ON *.* TO 'dynatrace'@'%';- Allows querying slave/replica metrics.
Due to a MariaDB limitation, you have to grant SELECT permissions on individual databases to calculate their sizes.
-
Compatibility information
global_status and global_status_extended feature sets: MariaDB 10.5.2+
- Performance schema global_status table was introduced in this version.
replicas and replica_error_logs feature sets: MariaDB 11.6+
- Information Schema SLAVE_STATUS Table was introduced in this version.
Activation and setup
Add DB instance
-
Go to Dynatrace Hub
 .
. -
Select and install MariaDB extension. This enables the extension in your monitoring environment.
- Required permission: Change monitoring settings
-
Select Add DB Instance in the
 Databases. This opens the Add DB Instance wizard.
 -
Select MariaDB section in the wizard.
Select hosting type
Select a hosting type from the options. This choice determines which script generates the necessary database objects later in the process.
- From the Add DB Instance wizard, select the host type that matches your requirement.
- Select Next.
Select ActiveGate group
- Select the ActiveGate group to determine which ActiveGates will run the extension.
- Select Next step.
Create a connection
Set up the connection to your database instance.
- Name the connection, so you can identify it later.
- Add the details in the Configure connection section.
- Provide the following connection details:
- Host
- Port
- Connection string
- Provide the following connection details:
- Provide the Authenticate credentials directly or use secure alternatives.
- Basic credentials: With basic authentication, authentication details passed to Dynatrace when activating monitoring configuration are masked to prevent them from being retrieved.
- Credential vault: Use vault credentials to securely store and retrieve database credentials.
- Select Next.
Install instance
- Add manual configurations based on the monitoring requirements.
-
Add configurations to collect top slow queries
This applies to the
top_queriesfeature set, which retrieves data fromperformance_schema.events_statements_summary_by_digest:-
Enable the necessary statement instruments - this tells MariaDB to track all statements:
UPDATE performance_schema.setup_instrumentsSET ENABLED = 'YES', TIMED = 'YES'WHERE NAME LIKE 'statement/%'; -
Enable the consumers - this tells MariaDB where to store the tracked statements:
UPDATE performance_schema.setup_consumersSET ENABLED = 'YES'WHERE NAME IN ('events_statements_history', 'events_statements_summary_by_digest');While the above commands work, create a custom Parameter Group for a more robust RDS configuration. In the parameter group, set
performance_schemato1and enable the consumer settings. This configuration persists across restarts and instance modifications. For more information, see Turn on the Performance Schema for Amazon RDS for MariaDB or MySQL.
-
-
- Select Create DB instance monitoring.
Details
Licensing and costs
There is no charge to use the extension. You are only charged for the data that the extension ingests.
The MariaDB extension ingests custom metrics, which consume Davis Data Units (DDUs) (Dynatrace classic license) or Metrics powered by Grail (DPS), according to your license model.
The following formula provides the number of metric data points per minute.
(69 * # of Instances) + (1 * # of Databases)
This extension also ingests logs.
Dynatrace Platform Subscription
In the Dynatrace Platform Subscription, metric ingestion consumes Metrics powered by Grail according to the number of ingested metric data points.
To calculate the approximate yearly consumption, apply the following calculation: <metric data points per minute> * 60 minutes * 24 hours * 365 days.
For logs, regular consumption applies. See Log Management and Analytics.
Dynatrace classic license
In the classic licensing model, metric ingestion consumes Davis Data Units (DDUs) at the rate of .001 DDUs per metric data point. Multiply the above formula for annual data points by .001 to estimate annual DDU usage.
For logs, regular DDU consumption applies. See DDU consumption for Log Management and Analytics or DDUs for Log Monitoring Classic.
The DDU cost above does not include any possible log events or custom events that are triggered by the extension. For more information, see DDU events.
Feature sets
When activating your extension using a monitoring configuration, you can limit monitoring to one of the feature sets. To work properly, the extension has to collect at least one metric after the activation.
In highly segmented networks, feature sets can reflect the segments of your environment. Then, when you create a monitoring configuration, you can select a feature set and a corresponding ActiveGate group that can connect to this particular segment.
All metrics that aren't categorized into any feature set are considered to be the default and are always reported.
A metric inherits the feature set of a subgroup, which in turn inherits the feature set of a group. Also, the feature set defined on the metric level overrides the feature set defined on the subgroup level, which in turn overrides the feature set defined on the group level.
globalStatus
| Metric name | Metric key | Description |
|---|---|---|
| Queries | mariadb.global_status.queries.count | The number of statements executed by the server. This variable includes statements executed within stored programs, unlike the Questions variable. It does not count COM_PING or COM_STATISTICS commands. |
| Slow Queries | mariadb.global_status.slow_queries.count | The number of queries that have taken more than long_query_time seconds. This counter increments regardless of whether the slow query log is enabled. For information about that log, see Section 5.4.5, The Slow Query Log. |
| Table Locks Waited | mariadb.global_status.table_locks_waited.count | The number of times that a request for a table lock could not be granted immediately and a wait was needed. If this is high and you have performance problems, you should first optimize your queries, and then either split your table or tables or use replication. |
| Table Locks Immediate | mariadb.global_status.table_locks_immediate.count | The number of times that a request for a table lock could be granted immediately. |
| Current Connections | mariadb.global_status.current_connections | The number of currently open connections. |
| Threads Running | mariadb.global_status.threads_running | The number of threads that are not sleeping. |
| Threads Created | mariadb.global_status.threads_created | The number of threads created to handle connections. If Threads_created is big, you may want to increase the thread_cache_size value. The cache miss rate can be calculated as Threads_created/Connections. |
| Innodb Buffer Pool Pages Data | mariadb.global_status.innodb_buffer_pool_pages_data | The number of pages in the InnoDB buffer pool containing data. The number includes both dirty and clean pages. When using compressed tables, the reported Innodb_buffer_pool_pages_data value may be larger than Innodb_buffer_pool_pages_total |
| Innodb Buffer Pool Pages Dirty | mariadb.global_status.innodb_buffer_pool_pages_dirty | The current number of dirty pages in the InnoDB buffer pool. |
| Innodb Buffer Pool Pages Free | mariadb.global_status.innodb_buffer_pool_pages_free | The number of free pages in the InnoDB buffer pool. |
| Innodb Buffer Pool Pages Total | mariadb.global_status.innodb_buffer_pool_pages_total | The total size of the InnoDB buffer pool, in pages. When using compressed tables, the reported Innodb_buffer_pool_pages_data value may be larger than Innodb_buffer_pool_pages_total |
| Innodb Data Reads | mariadb.global_status.innodb_data_reads.count | The total number of data reads (OS file reads). |
| Innodb Data Writes | mariadb.global_status.innodb_data_writes.count | The total number of data writes. |
| Innodb Data Read | mariadb.global_status.innodb_data_read.count | The total amount of data read from files. |
| Innodb Data Written | mariadb.global_status.innodb_data_written.count | The total amount of data written. |
| Innodb Buffer Pool Reads | mariadb.global_status.innodb_buffer_pool_reads | The number of logical reads that InnoDB could not satisfy from the buffer pool, and had to read directly from disk. |
| Innodb Buffer Pool Read Requests | mariadb.global_status.innodb_buffer_pool_read_requests | The number of logical read requests. |
| Availability | mariadb.global_status.availability | Whether or not a connection can be made to the database |
| Status | mariadb.global_status.status | A status of AVAILABLE is returned if we can query the database |
| Uptime | mariadb.global_status.uptime | The time in seconds that the mariadb server has been running since it was started. |
| Handler Rollback | mariadb.global_status.handler_rollback.count | The number of requests for a storage engine to perform a rollback operation. |
| Innodb Log Waits | mariadb.global_status.innodb_log_waits.count | The number of times that the log buffer was too small and a wait was required for it to be flushed before continuing. |
| Innodb Row Lock Current Waits | mariadb.global_status.innodb_row_lock_current_waits | The number of row locks currently waited for by operations on InnoDB tables. |
| Innodb Row Lock Time (Avg) | mariadb.global_status.innodb_row_lock_time_avg | The average time to acquire a row lock for InnoDB tables |
| Innodb Row Lock Waits | mariadb.global_status.innodb_row_lock_waits.count | The number of times operations on InnoDB tables had to wait for a row lock. |
| Opened Tables | mariadb.global_status.opened_tables.count | The number of tables that have been opened. If Opened_tables is big, your table_open_cache value is probably too small. |
| Open Files | mariadb.global_status.open_files | The number of files that are open. This count includes regular files opened by the server. It does not include other types of files such as sockets or pipes. Also, the count does not include files that storage engines open using their own internal functions rather than asking the server level to do so. |
| Open Tables | mariadb.global_status.open_tables | The number of tables that are open. |
| Query Cache Free Memory | mariadb.global_status.qcache_free_memory | The amount of free memory for the query cache. |
| Query Cache Hits | mariadb.global_status.qcache_hits.count | The number of query cache hits. |
| Query Cache not Cached | mariadb.global_status.qcache_not_cached.count | The number of noncached queries (not cacheable, or not cached due to the query_cache_type setting). |
| Aborted Clients | mariadb.global_status.aborted_clients.count | The number of connections that were aborted because the client died without closing the connection properly. |
| Aborted Connects | mariadb.global_status.aborted_connects.count | The number of failed attempts to connect to the MySQL server. |
| Connection Errors Max Connections | mariadb.global_status.connection_errors_max_connections.count | The number of connections refused because the server max_connections limit was reached. |
| Max Used Connections | mariadb.global_status.max_used_connections | The maximum number of connections that have been in use simultaneously since the server started. |
| Questions | mariadb.global_status.questions.count | The number of statements executed by the server. This includes only statements sent to the server by clients and not statements executed within stored programs, unlike the Queries variable. This variable does not count COM_PING, COM_STATISTICS, COM_STMT_PREPARE, COM_STMT_CLOSE, or COM_STMT_RESET commands. |
infrastructure
| Metric name | Metric key | Description |
|---|---|---|
| Memory | mariadb.infrastructure.memory | The amount of memory used per each code area. |
topQueries
| Metric name | Metric key | Description |
|---|
waits
| Metric name | Metric key | Description |
|---|---|---|
| Waits IO | mariadb.waits.waits_io.count | The number of times that the server has waited for an I/O operation to complete. |
| Waits IO Time | mariadb.waits.waits_io_time.count | The total time the server has waited for I/O operations to complete. |
| Waits Sync | mariadb.waits.waits_sync.count | The number of times that the server has waited for a synchronization operation to complete. |
| Waits Sync Time | mariadb.waits.waits_sync_time.count | The total time the server has waited for synchronization operations to complete. |
replicaErrorLogs
| Metric name | Metric key | Description |
|---|
statements
| Metric name | Metric key | Description |
|---|---|---|
| Commits | mariadb.statements.commit.count | The number of COMMIT statements executed by this server |
| Deletes | mariadb.statements.delete.count | The number of DELETE statements executed by this server |
| Multi-Table Deletes | mariadb.statements.delete_multi.count | The number of multi-table DELETE statements executed by this server |
| Inserts | mariadb.statements.insert.count | The number of INSERT statements executed by this server |
| Selects | mariadb.statements.select.count | The number of SELECT statements executed by this server |
| Updates | mariadb.statements.update.count | The number of UPDATE statements executed by this server |
| Executes | mariadb.statements.execute.count | The number of EXECUTE statements executed by this server |
| Multi-Table Updates | mariadb.statements.update_multi.count | The number of multi-table UPDATE statements executed by this server |
| Bytes Sent | mariadb.statements.bytes_sent.count | The number of bytes sent to all clients |
| Bytes Received | mariadb.statements.bytes_received.count | The number of bytes received from all clients |
| Rollbacks | mariadb.statements.rollback.count | The number of ROLLBACK statements executed by this server |
| Insert Selects | mariadb.statements.insert_select.count | The number of insert-select statements executed by this server |
| Replace Selects | mariadb.statements.replace_select.count | The number of replace-select statements executed by this server |
| Prepared Statements | mariadb.statements.prepared_stmt_count.count | The current number of prepared statements |
replicas
| Metric name | Metric key | Description |
|---|---|---|
| Slave IO Running | mariadb.replica.slave_io_running | Whether the replica I/O thread is running and connected (Yes - 1), running but not connected to a primary (Connecting - 2) or not running (No - 0). |
| Slave SQL Running | mariadb.replica.slave_sql_running | Whether the SQL thread is running and connected (Yes - 1), running but not connected to a primary (Connecting - 2) or not running (No - 0). |
| Relay Log Space | mariadb.replica.relay_log_space | Total size of all relay log files combined. |
| Last IO Errno | mariadb.replica.last_io_errno | Error code of the most recent error that caused the I/O thread to stop (also recorded in the replica's error log). 0 means no error. RESET SLAVE or RESET MASTER will reset this value. |
| Last SQL Errno | mariadb.replica.last_sql_errno | Error code of the most recent error that caused the SQL thread to stop (also recorded in the replica's error log). 0 means no error. RESET SLAVE or RESET MASTER will reset this value. |
| Seconds Behind Master | mariadb.replica.seconds_behind_master | Difference between the timestamp logged on the master for the event that the replica is currently processing, and the current timestamp on the replica. Zero if the replica is not currently processing an event. |
| Read Master Log Position | mariadb.replica.read_master_log_pos | Position up to which the I/O thread has read in the current primary binary log file. |
| Exec Master Log Position | mariadb.replica.exec_master_log_pos | Position up to which the SQL thread has processed in the current master binary log file. |
databases
| Metric name | Metric key | Description |
|---|---|---|
| Database Size | mariadb.databases.size | The size of the Database |
| Database Queries | mariadb.databases.queries.count | Number of queries executed for the database. |
| Database Rows Read | mariadb.databases.rows_read.count | Number of rows examined by queries executed for the database. |
| Database Rows Written | mariadb.databases.rows_written.count | Number of rows affected by queries executed for the database. |
globalStatusExtended
| Metric name | Metric key | Description |
|---|---|---|
| Query Cache Queries in Cache | mariadb.global_status.qcache_queries_in_cache.count | The number of queries registered in the query cache. |
| Query Cache Free Blocks | mariadb.global_status.qcache_free_blocks | The number of free memory blocks in the query cache. |
| Query Cache Total Blocks | mariadb.global_status.qcache_total_blocks | The total number of blocks in the query cache. |
| Created Temporary Tables | mariadb.global_status.created_tmp_tables.count | The number of internal temporary tables created by the server while executing statements. You can compare the number of internal on-disk temporary tables created to the total number of internal temporary tables created by comparing Created_tmp_disk_tables and Created_tmp_tables values. |
| Created Temporary Disk Tables | mariadb.global_status.created_tmp_disk_tables.count | The number of internal on-disk temporary tables created by the server while executing statements. You can compare the number of internal on-disk temporary tables created to the total number of internal temporary tables created by comparing Created_tmp_disk_tables and Created_tmp_tables values. |
| Innodb Buffer Pool Size | mariadb.global_status.innodb_buffer_pool_size | The size in bytes of the buffer pool, the memory area where InnoDB caches table and index data. |
FAQ
Why am I not seeing wait metrics?
To gather wait metrics, enable data collection for the MariaDB instance. For details, see Performance schema wait event tables.
I get an error "RSA public key is not available client side"
This means the username is not identified by a native password. Refer to the activation and setup section.
Why am I not seeing memory metrics?
Enable data collection for your instance.
For more details, see Monitor MySQL memory use.
You can test that you can query the data by running:
SELECT SUBSTRING_INDEX(event_name,'/',2) AS code_area,SUM(current_alloc) AS current_allocFROM sys.x$memory_global_by_current_bytesGROUP BY SUBSTRING_INDEX(event_name,'/',2)ORDER BY SUM(current_alloc) DESC;
Why am I not able to see slow queries?
For details, see Add configurations to collect top slow queries.