Host availability
- Dynatrace Classic
- How-to guide
- 5-min read
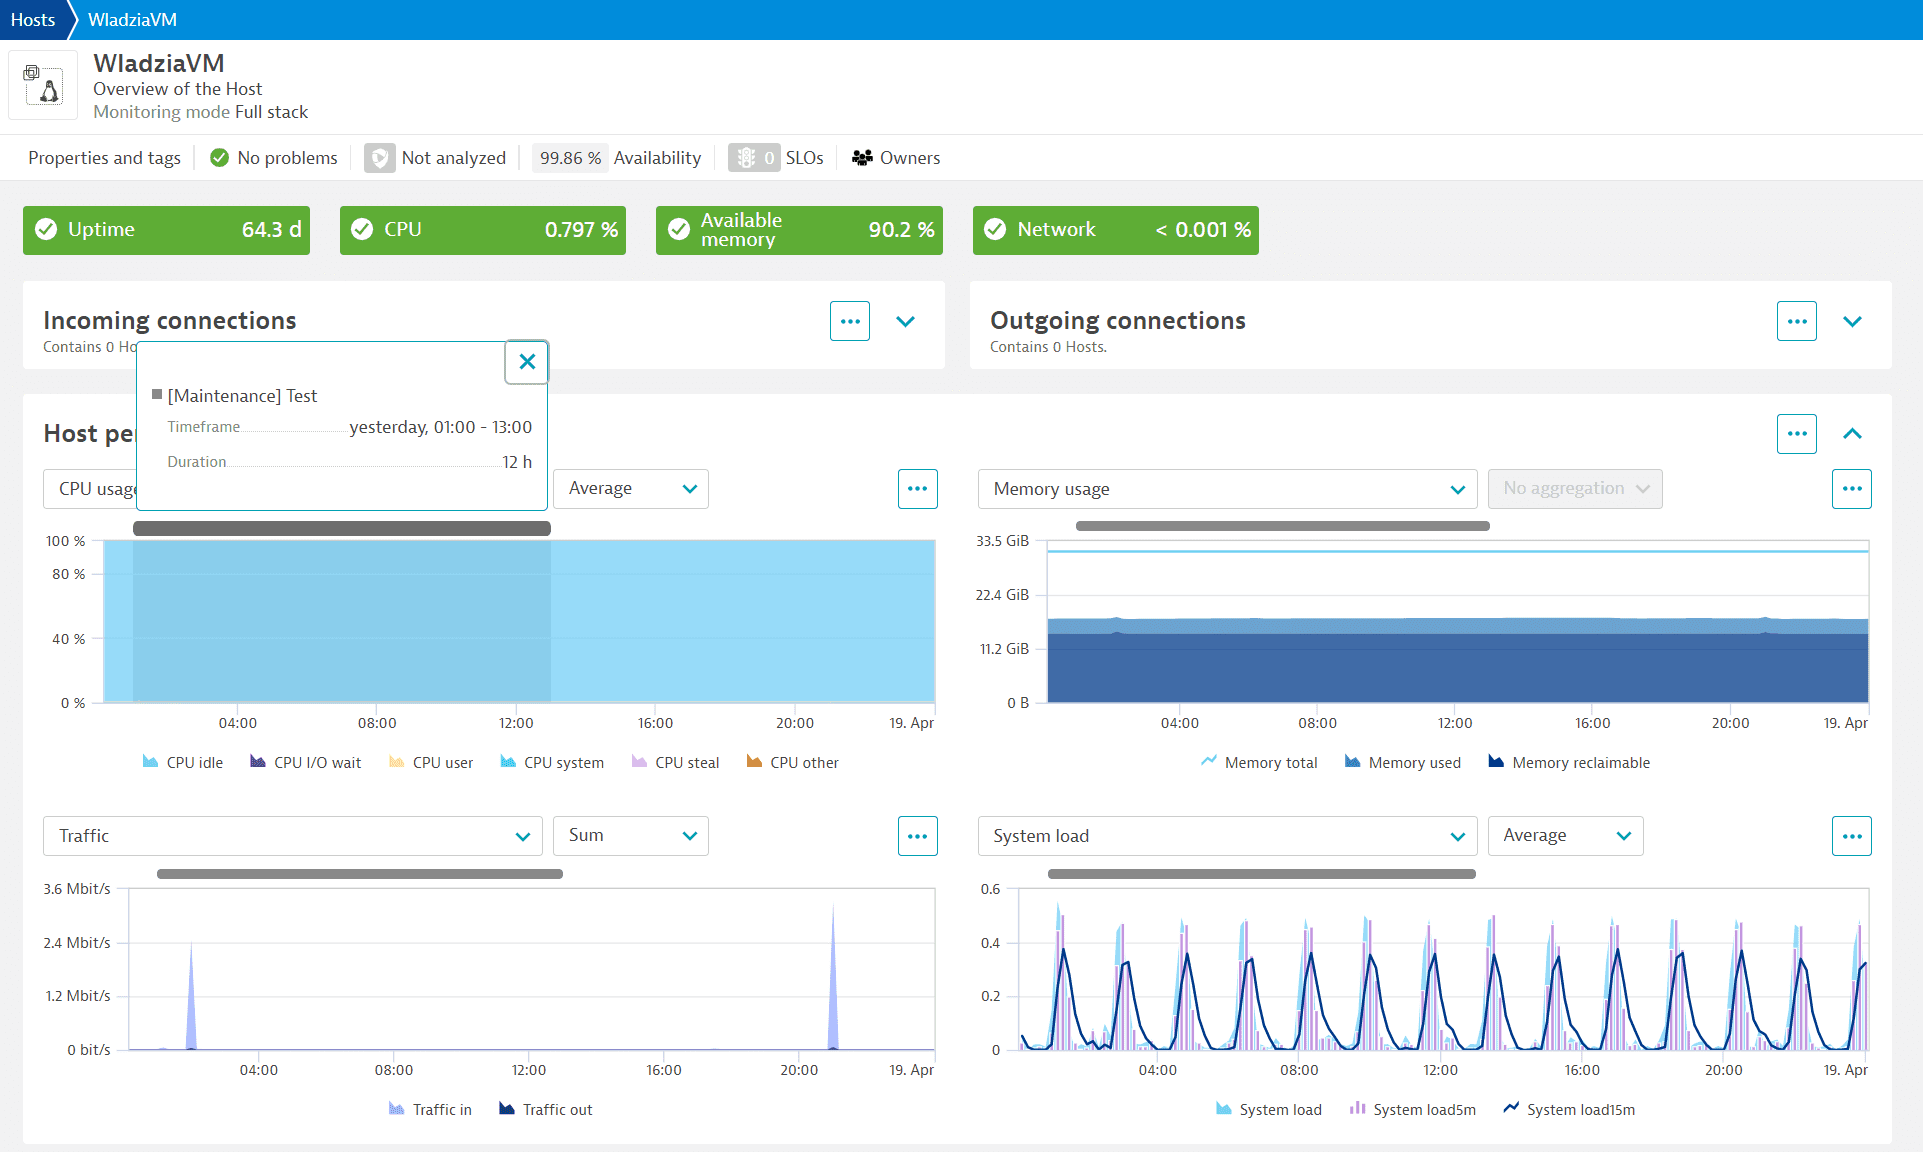
You can track host availability on the overview page for a selected host. The Host availability tile displays the percentage of the selected time range in which the host was online and responsive to requests.
Check host availability state
To check a host's availability state
-
Go to
 Hosts Classic to list all the machines (physical and virtual) in your environment that have OneAgent installed.
 -
Select a host to go to the host overview page, where you can view host details, including all available metrics for the host.
-
On the notifications bar, Availability indicates the percentage of time that the host was online and responsive to requests. Dynatrace detects and shows operating system shutdowns (including reboots) and periods when a host is offline (for example, if the host is down unexpectedly).
When the connection to the host is lost, OneAgent caches all the collected data in a 55-minute buffer. Once the connection is reestablished, the data for the host is collected from the buffer's content and updated.
In this example, the notifications bar displays an availability rate of 99.74% for the selected host during the selected timeframe.
 Host availability on the notifications bar
 -
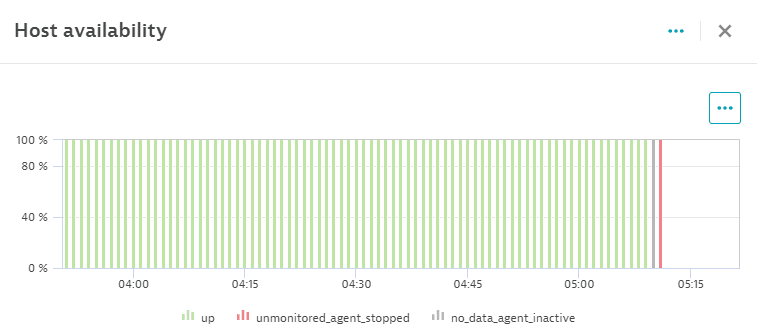
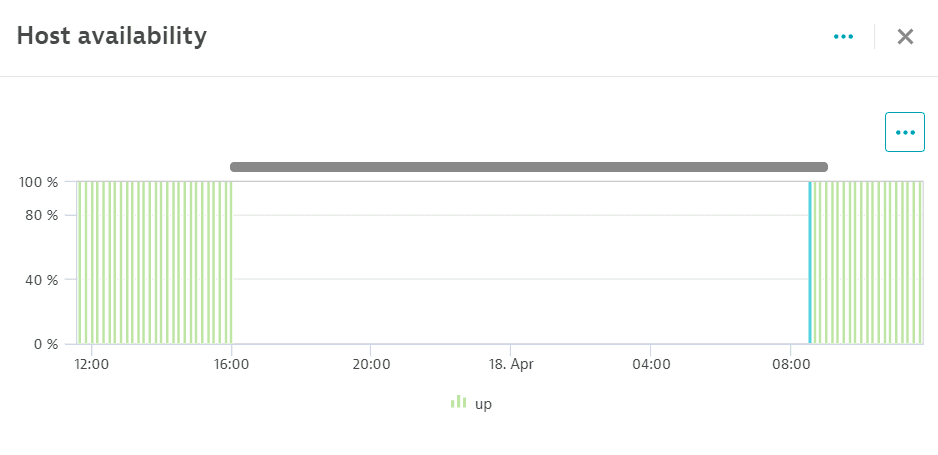
Select Availability on the notifications bar to display the Host availability panel, which charts host availability over time.
In this example, the legend indicates the three different host availability states that occurred during the selected timeframe.
 Host page detail - online availability
Host availability states
| Availability state | Description |
|---|---|
up | The host is working; OneAgent is active and sending data. If the connectivity to the host is lost, OneAgent sends all cached metrics when the connection is restored. |
no_data | The host is working and OneAgent is active, but no data is being sent. This state is also set when collecting monitoring data takes too long (for example, OneAgent freezes). |
no_data_agent_inactive | The host is working, OneAgent is inactive, and no data is being sent because OneAgent has been manually disabled in the configuration. |
shutdown_host | The host has been shut down due to an expected operating system shutdown or reboot. |
unmonitored_agent_stopped | The host is not monitored because OneAgent is inactive. For details, refer to Check OneAgent monitoring settings per host. |
unmonitored_agent_upgrade | The host is not monitored because OneAgent is being upgraded. |
unmonitored_agent_uninstalled | The host is not monitored because OneAgent has been uninstalled. |
reboot_graceful | The host was rebooted following a graceful shutdown, which means an expected operating system shutdown has occurred. |
reboot_ungraceful | The host was rebooted following an ungraceful shutdown, which means an unexpected operating system shutdown has occurred. This may be caused by events, such as power loss or a system crash. |
Check OneAgent monitoring settings per host
To check or change the monitoring settings per host:
- Go to Settings > Monitoring > Monitoring overview.
- Select the Hosts tab.
- Find the host and check the Summary column to see if it's being monitored.
- Select the edit button
 and check the settings in the Monitoring tab.
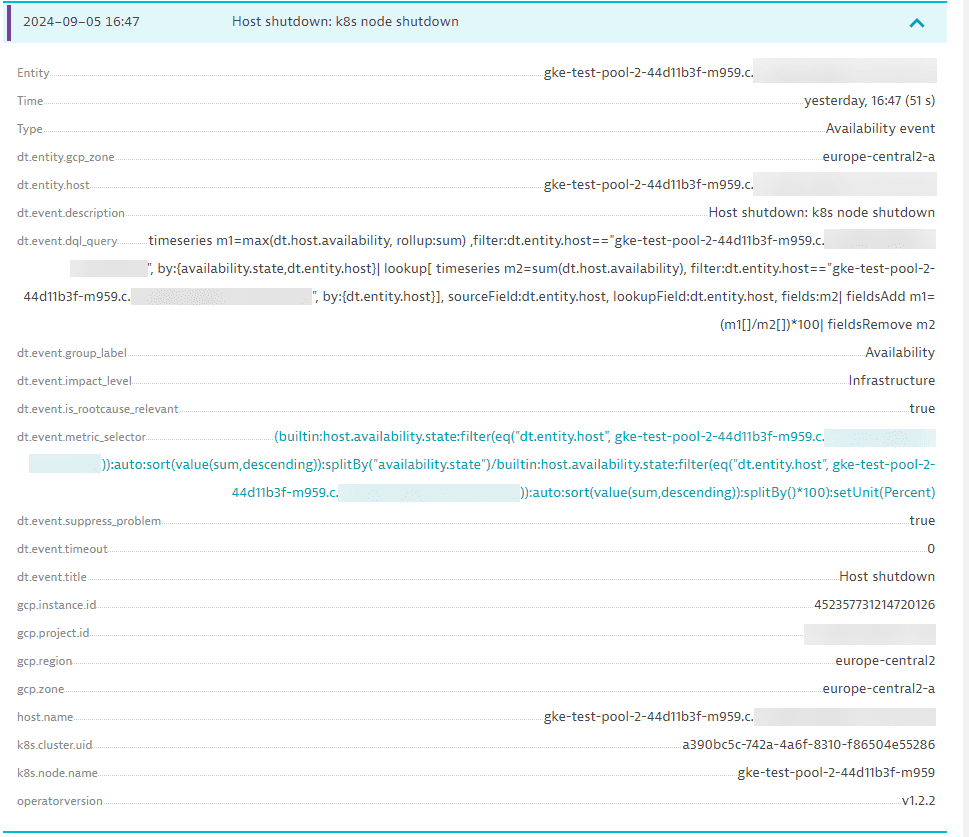
Host availability events
When the availability state changes (for example, when the host is shut down), OneAgent sends availability events. To check all events for a specific host, go to Hosts Classic, select the desired host, and then go to the Events tile.
The event types are:
- Reboot graceful
- Reboot ungraceful
- Graceful shutdown
- K8s node termination (a subelement of Graceful shutdown, specific to Kubernetes environments)
Reboot graceful/ungraceful
After a system restart, OneAgent checks system-specific log files or events to determine if the host was shut down gracefully or ungracefully.
-
Graceful reboot indicates that the host is rebooted following an expected operating system shutdown.
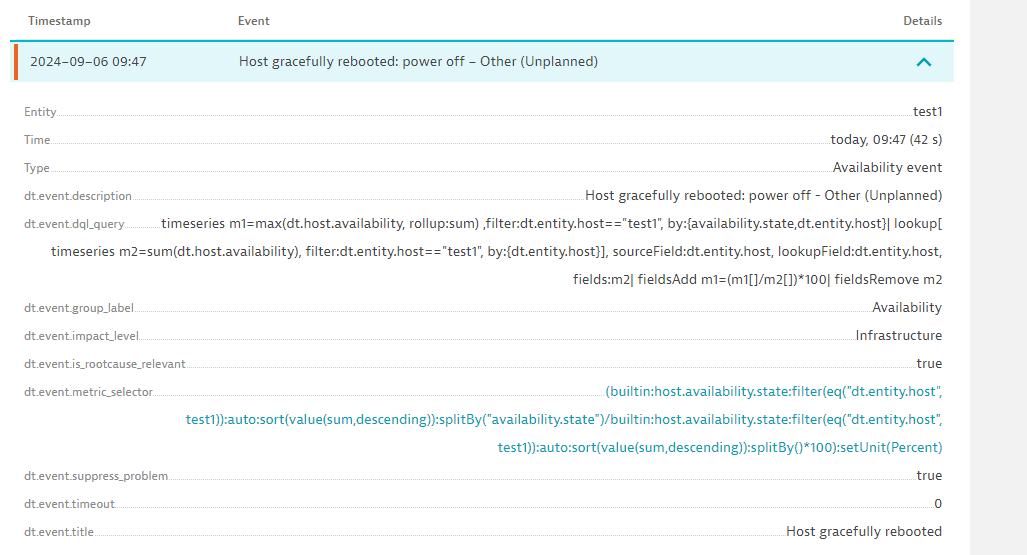 Host availability event - graceful reboot
 -
Ungraceful reboot indicates that the host is rebooted following an unexpected operating system shutdown caused by events, such as power loss or a system crash.
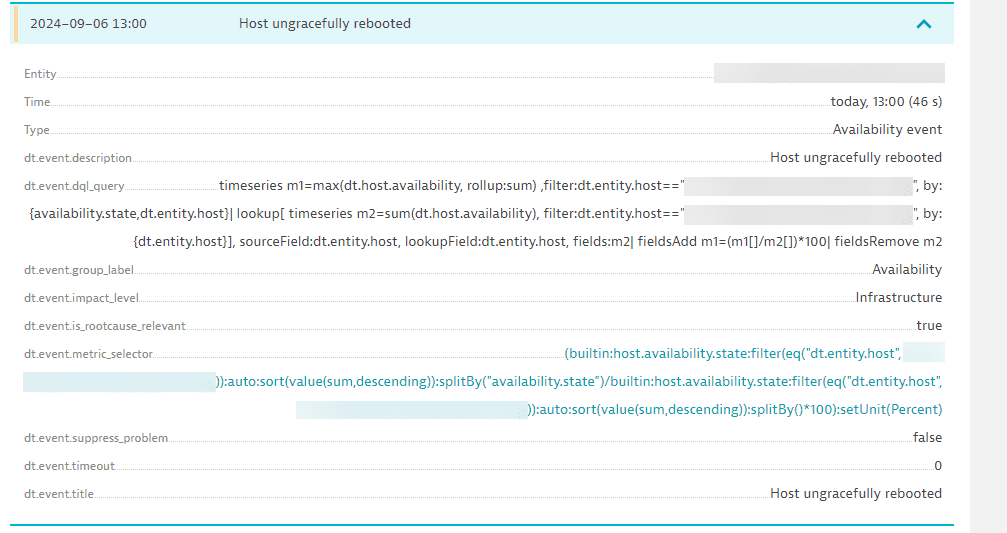 Host availability event - ungraceful reboot
The reboot graceful and reboot ungraceful events are supported on Linux, AIX, and Windows operating systems.
Graceful shutdown
When the host is about to shut down, OneAgent sends the appropriate host shutdown event.
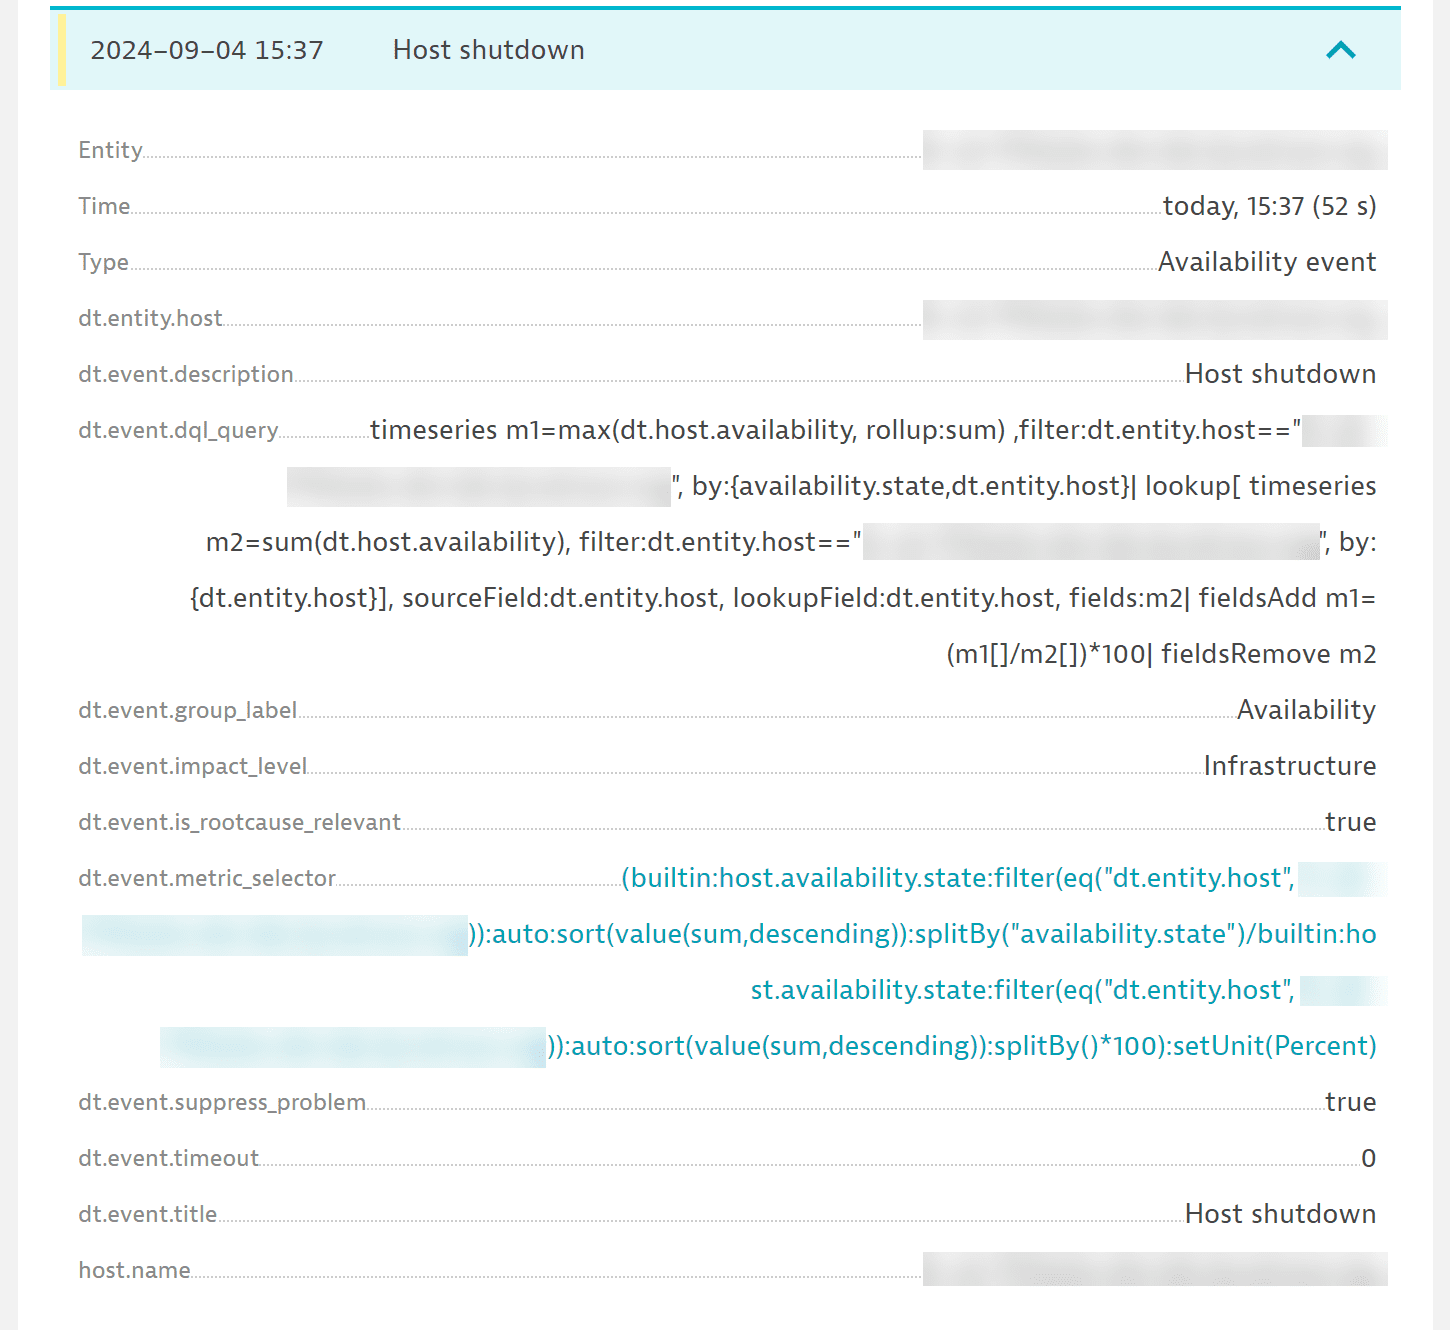
The graceful shutdown event is supported on Linux, AIX, and Windows operating systems.
K8s node termination
K8s node termination is supported on the Linux operating system. This event is generated on hosts where the Kubernetes engine is detected. OneAgent creates an inhibitor lock to get more time during shutdown.
Make sure OneAgent has sufficient rights to register the inhibitor lock.
If your Linux distribution experiences connection problems or the network manager is turned off faster than the event is sent, the shutdown event might not be sent on time.
Maintenance windows
Maintenance windows are periods of time during which maintenance activities are scheduled to be performed in monitored environments. These maintenance windows can be used to prevent alerting, log file collection, system profiling, and other activities from taking place. For details, see Maintenance windows.
Maintenance windows are displayed as gray bars at the top of the Host availability and Host performance tiles on the host overview page.
 Hosts Classic