Filesystem monitoring extension
- Latest Dynatrace
- Extension
Monitor file and folder counts, sizes, ages, and content on Windows and Linux hosts via OneAgent, with Azure file share support.
Get started
Overview
Monitor your files on Windows and Linux OneAgent installations.
Targeting can be done by host, host group, management zone or environment. Tags can be applied to segregate your configurations (100 configurations maximum).
For each path check, Dynatrace will create an entity and link it to the matching host. This way, extension filtering and tagging is possible to view your data. The same can be done with alerts.
Compatibility information
- This is a OneAgent extension compatible with Windows and Linux.
- OneAgent version 1.310+
- Dynatrace version 1.318+
- Azure file shares are supported.
Activation and setup
-
Go to the Filesystem monitoring extension in Dynatrace Hub.
-
Create a new configuration by selecting Add configuration.
-
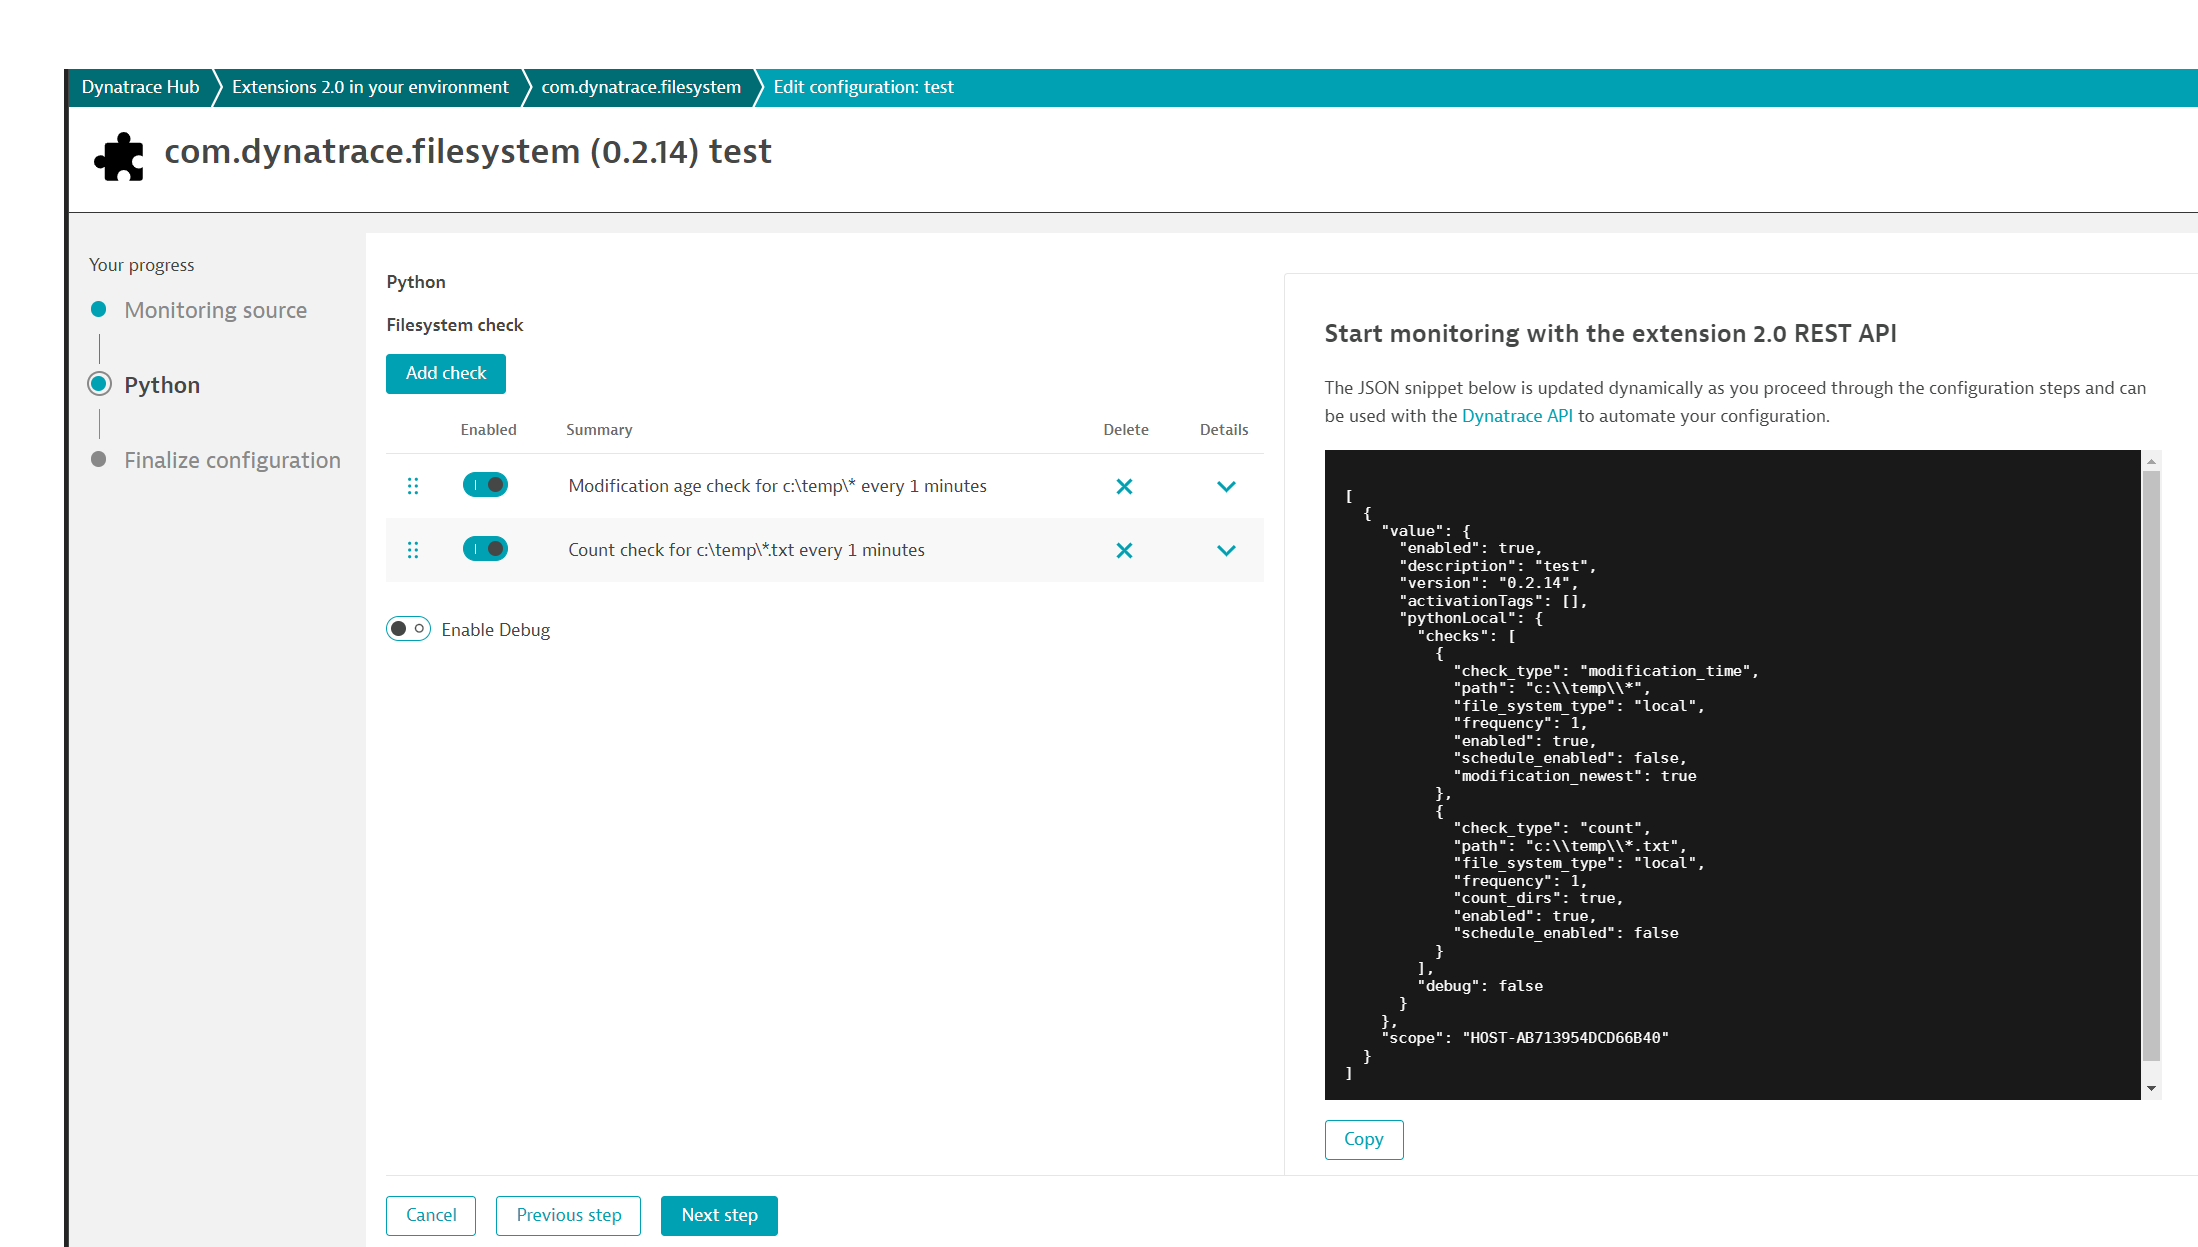
For each check, select Add check.
-
Select the check type and enter the relevant details. Then select Next.
 Configuration
 -
Enter a description for your configuration and select Activate.
Wait until the state of the deployment changes from pending to ok. This might take several minutes.
Details
Path examples
The following examples show how to configure check types and paths for common monitoring scenarios.
- Count the number of log files inside
/var/log/myapp:- Select
check type = count - Set the path to
/var/log/myapp/*.log
- Select
- Count the number of log files inside
c:\temp:- Select
check type = count - Set the path to
c:\temp\*.log
- Select
- Count the number of logs files inside
/var/log/myappand any subdirectories:- Select
check type = count - Set the path to
/var/log/myapp/**/*.log
- Select
- Does the directory
mydirinside/tmpexist?- Select
check type = count - Set the path to
/tmp/mydir - Ensure that the count directories toggle is enabled
- Select
- Count the number of files inside
/tmp:- Select
check type = count - Set the path to
/tmp/*
- Select
- Return the total size of all files files inside
/var/log/myapp:- Select
check type = size - Set the path to
/var/log/myapp/*
- Select
- Return the age of the oldest file in
/tmp/test/:- Select
check type = modification age - Unselect user newest file
- Set the path to
/tmp/test/*
- Select
- Return the number of log files older than 1 hour in
/tmp/test:- Select
check type = modification age count - Set Age comparison operator to Older than
- Set the threshold to 60
- Set the path to
/tmp/test/*.log
- Select
- Check whether
/data/mount-datais mounted:- Select
check type = mount point - Set the path to
/data/mount-data
- Select
- Check that today's log has been produced:
/var/mylog20222211.log:- Select
check type = count - Set the path to
/var/mylogYYYYMMDD.log - Accepts
DDMMYYYY,DD-MM-YYYY,DD_MM_YYYY,YYYYMMDD,YYYY-MM-DD,YYYY_MM_DD. - The date will be the local date where the OneAgent/extension is running.
- You can append dates to paths, for example
C:\DDMMYYYY|-1d, to dynamically resolve the date relative to each run time. The extension recalculates the date on every run.
- Select
Schedules
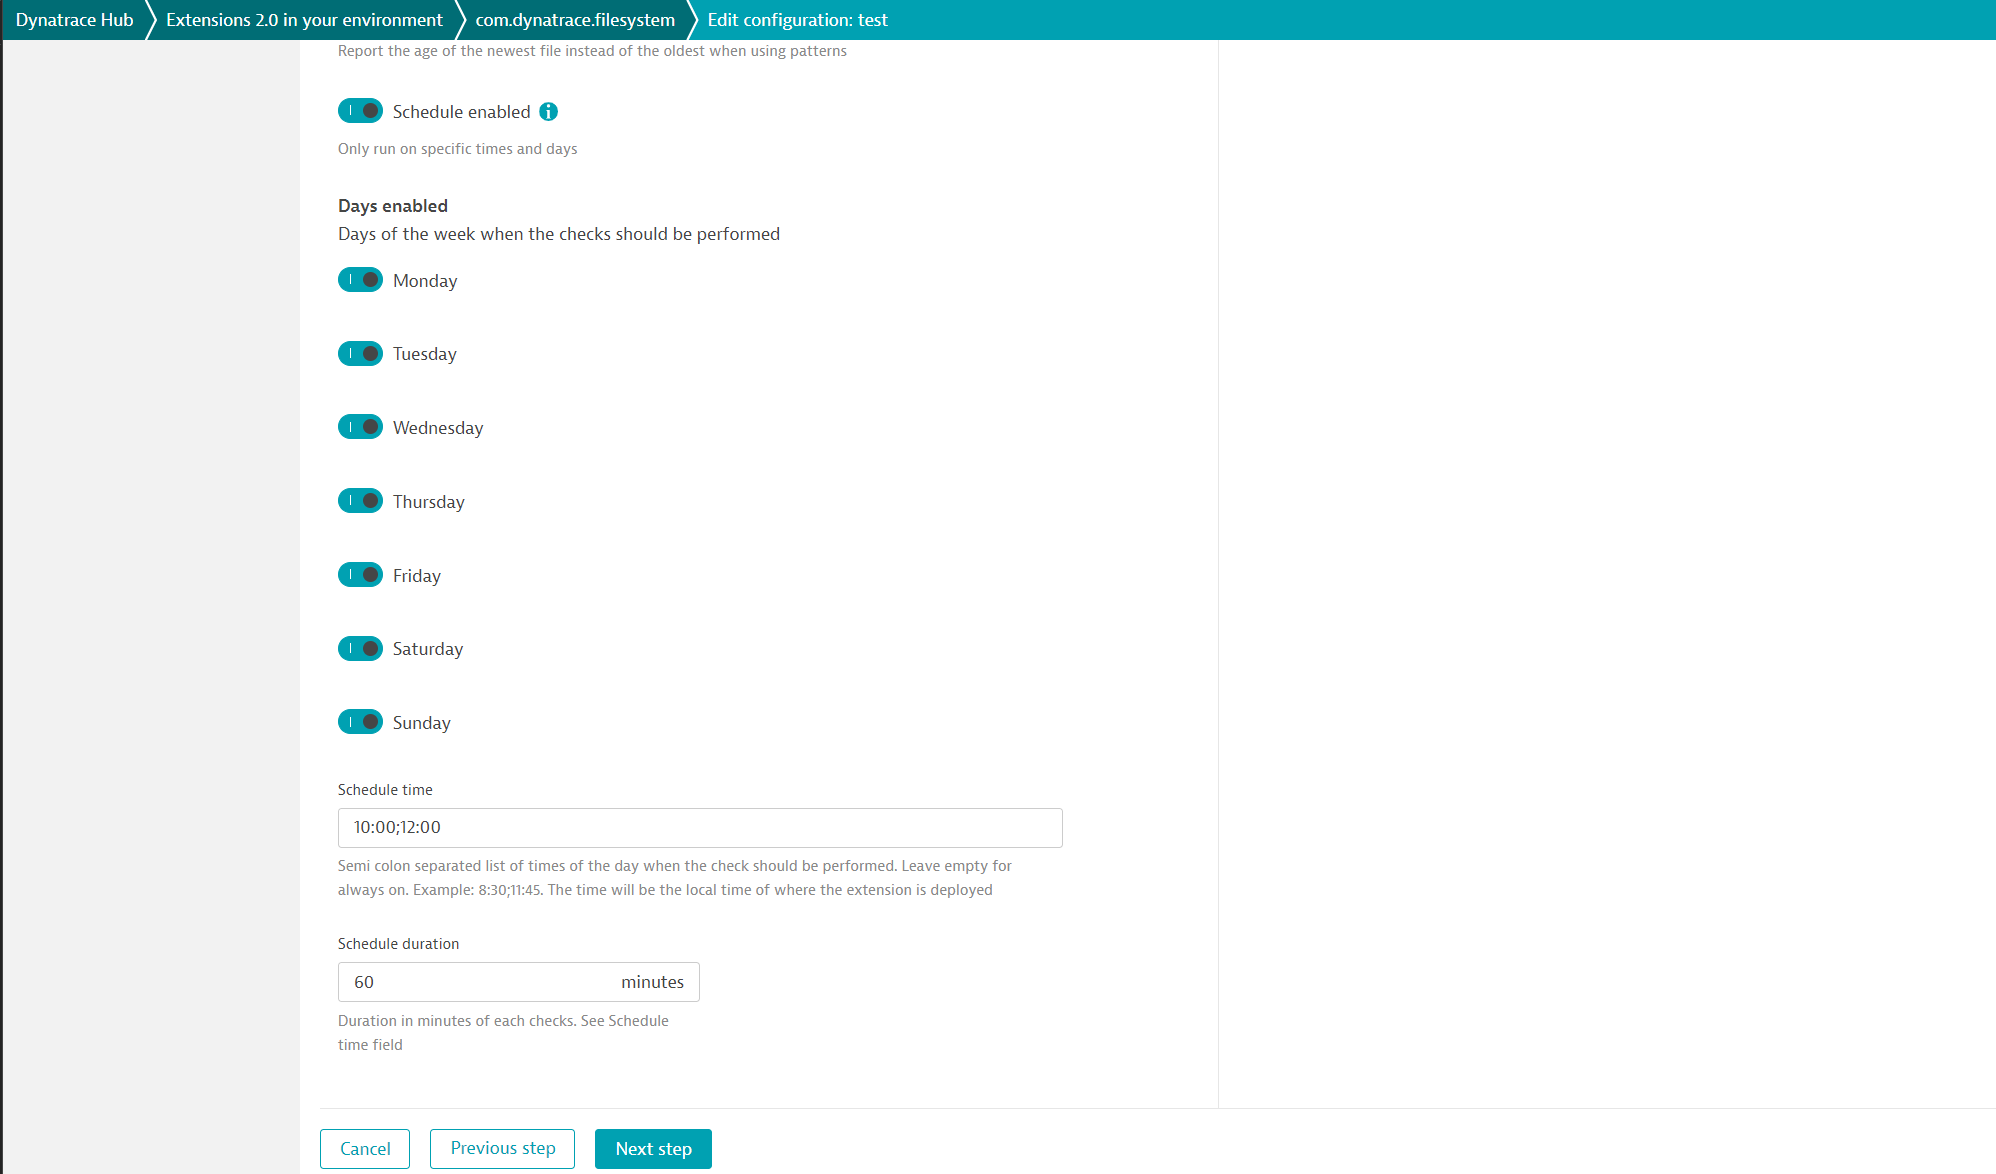
If no schedule is selected, the check runs continuously. To exclude specific days, select a schedule and clear the checkboxes for the days you want to skip, for example, Sunday.
You can define multiple time windows by entering start times separated by semicolons. For each start time, the Schedule duration field determines the end time. In this example, the check runs at 10:00 and 12:00, each for 1 hour.
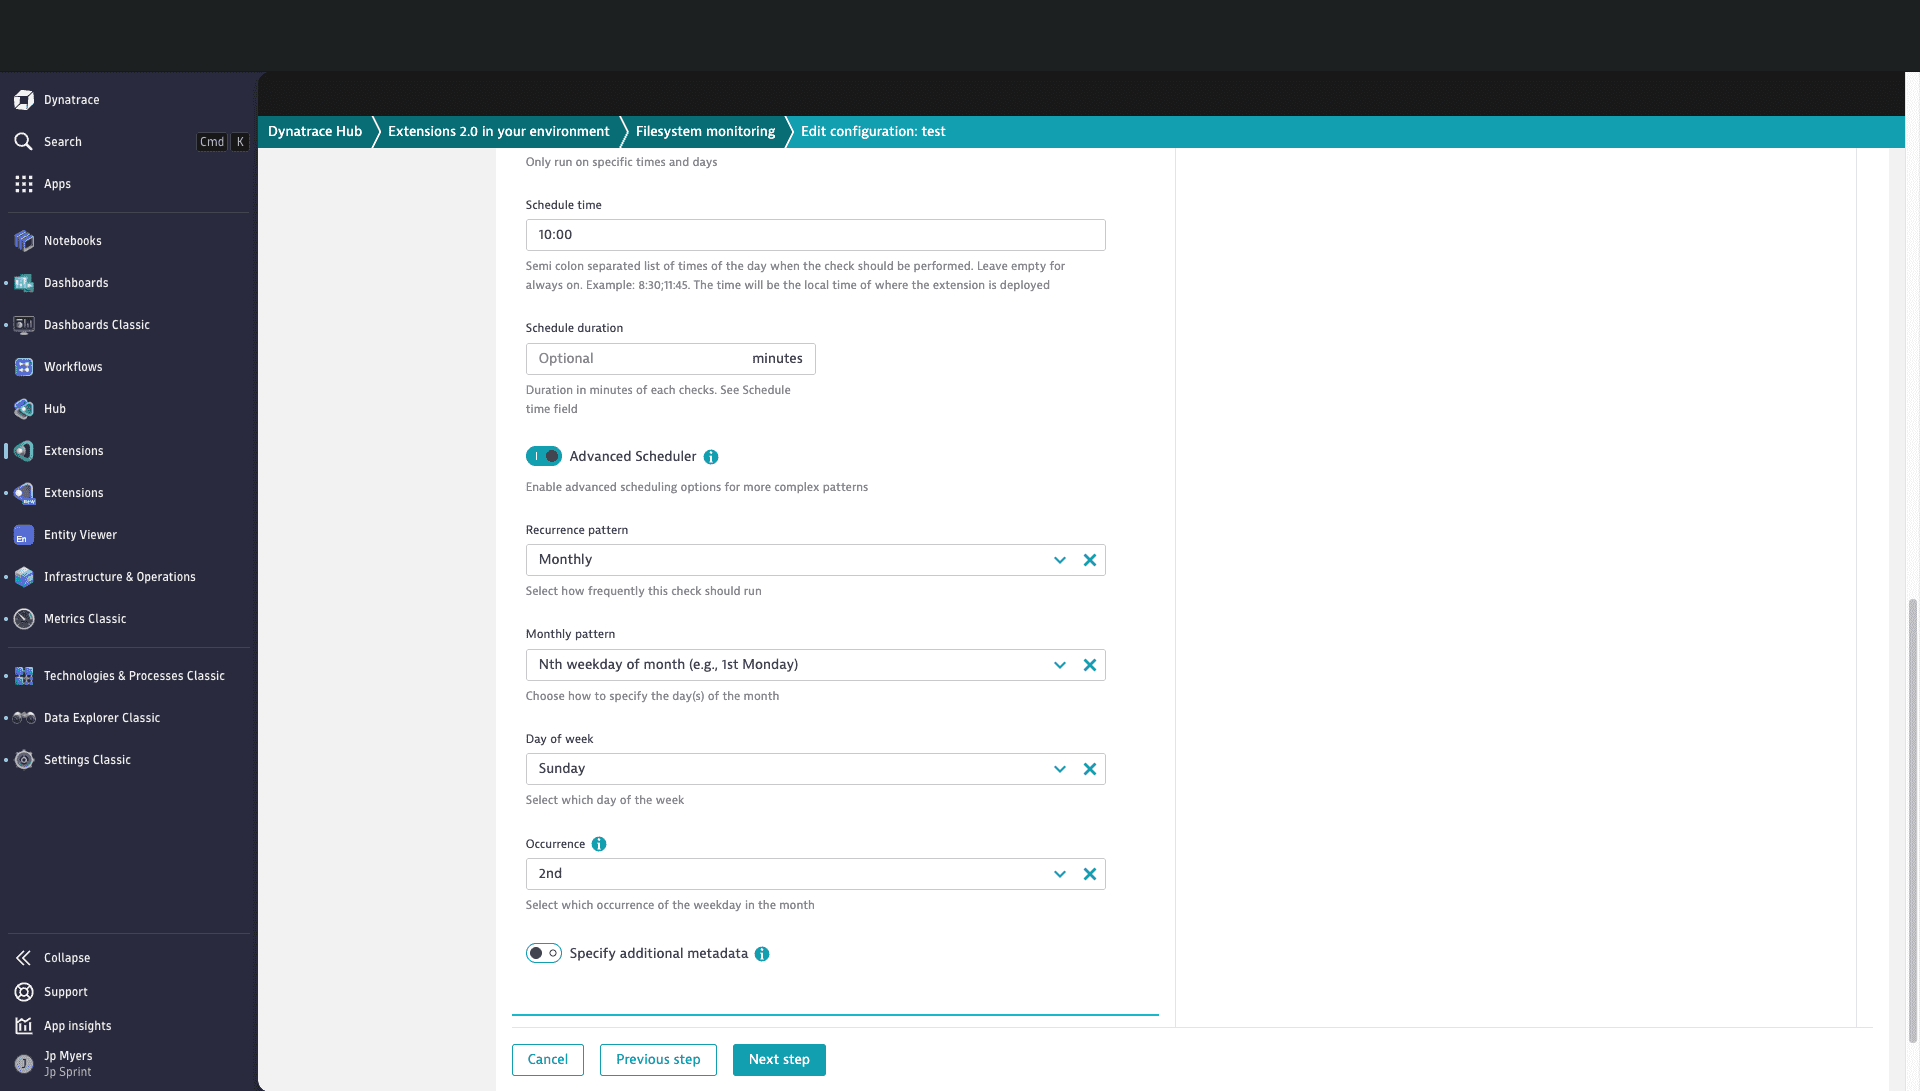
Advanced scheduling options let you run checks on a specific day of the month, on the n-th weekday of the month, or on selected months and days for yearly scans.
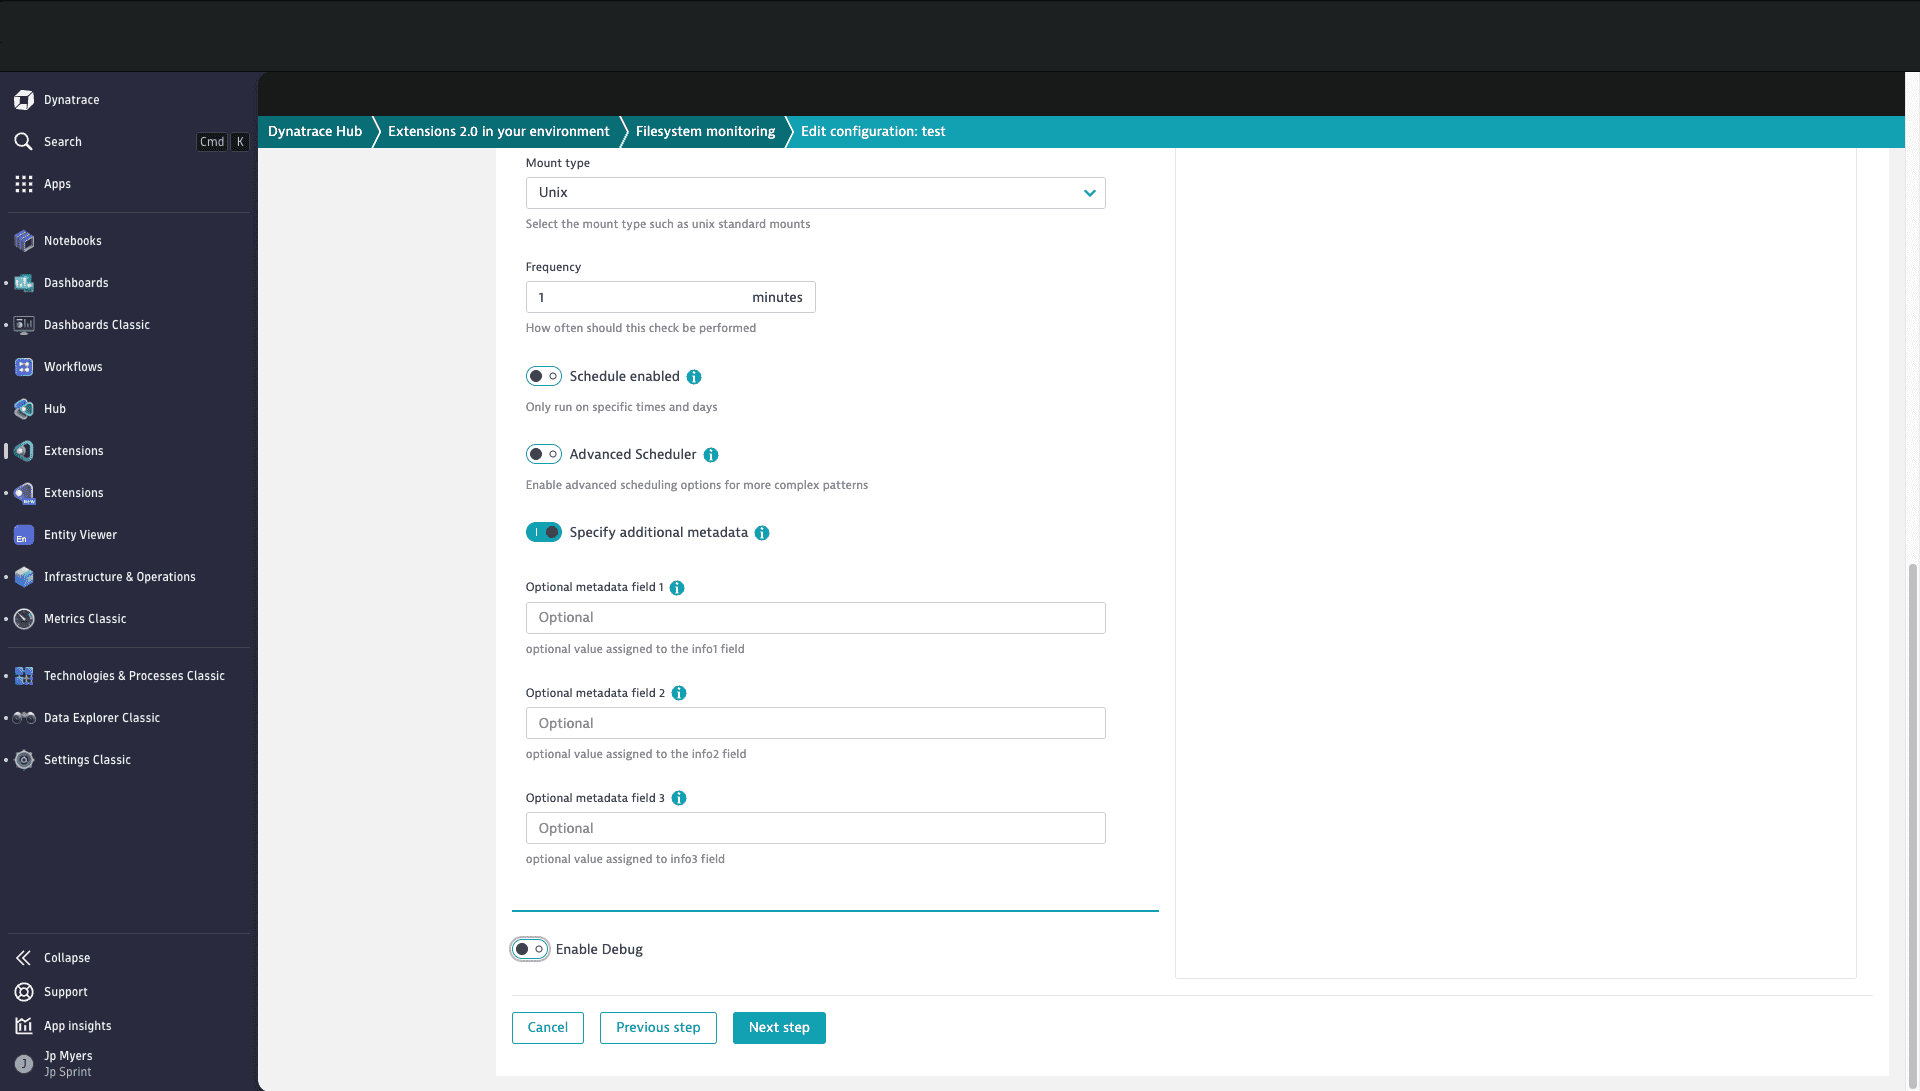
Additional metadata
Each file check supports up to three metadata fields for providing extra context. These fields map to the info1, info2, and info3 dimensions on the related metrics.
Local file systems
-
On Linux, the extension supports local file systems accessible to the
dtuseraccount. Files must be readable bydtuser; otherwise, the extension can't detect them. To use a different account, configure therun_asoption withsudo -u <username>. -
On Windows, The file must be at least readable by
LOCAL SERVICEif not, it will be invisible to the extension.
NFS
- On Linux, ensure
dtuseror therun_asuser has the required permissions. - On Windows, NFS drives are visible only when running as another user, either by entering credentials directly or by selecting an account from the credential vault.
- Only standard NFS drives connected via Windows Explorer are supported.
- Azure file shares are supported.
- When selected, two new fields will appear: the Azure account and the key.
- Make sure OneAgent has network connectivity to Azure.
Run As additional information
Windows Run As
- On Windows, the
run asuser must be able to login locally.- Logon Type policy change to allow type 2
- If you are using a local user for the domain enter prefix the username with ".\" example:
.\username
Linux Run As
- sudo
- When no username is entered dtuser will run
sudoon the checks to elevate privileges.- Ensure dtuser has sudo permissions and is setup passwordless in the sudoers file.
- If you enter a username, it will run
sudo -u <username> commandHowever, sudo requires the calling user to have permissions. dtuser must be setup passwordless as before above.
- When no username is entered dtuser will run
- sesu
- A username must be entered. This account being used must be setup to be run passwordless. it will run
sesu -<user> -c command
- A username must be entered. This account being used must be setup to be run passwordless. it will run
Checks can be disabled for specific days and at specific times.
Metrics
- File count—Number of files matching a pattern
- File age count—Number of files matching a pattern and an age
- File age—Age of a specific file (oldest or newest when returning more than 1 file)
- File size—Size of the files in bytes
- Mount point—Mount point mounted on Unix NFS
Data
To view your data
-
Go to Data explorer.
-
In the metric box type, select
filesystemand select the relevant metric. You can split metrics by host and path, for example.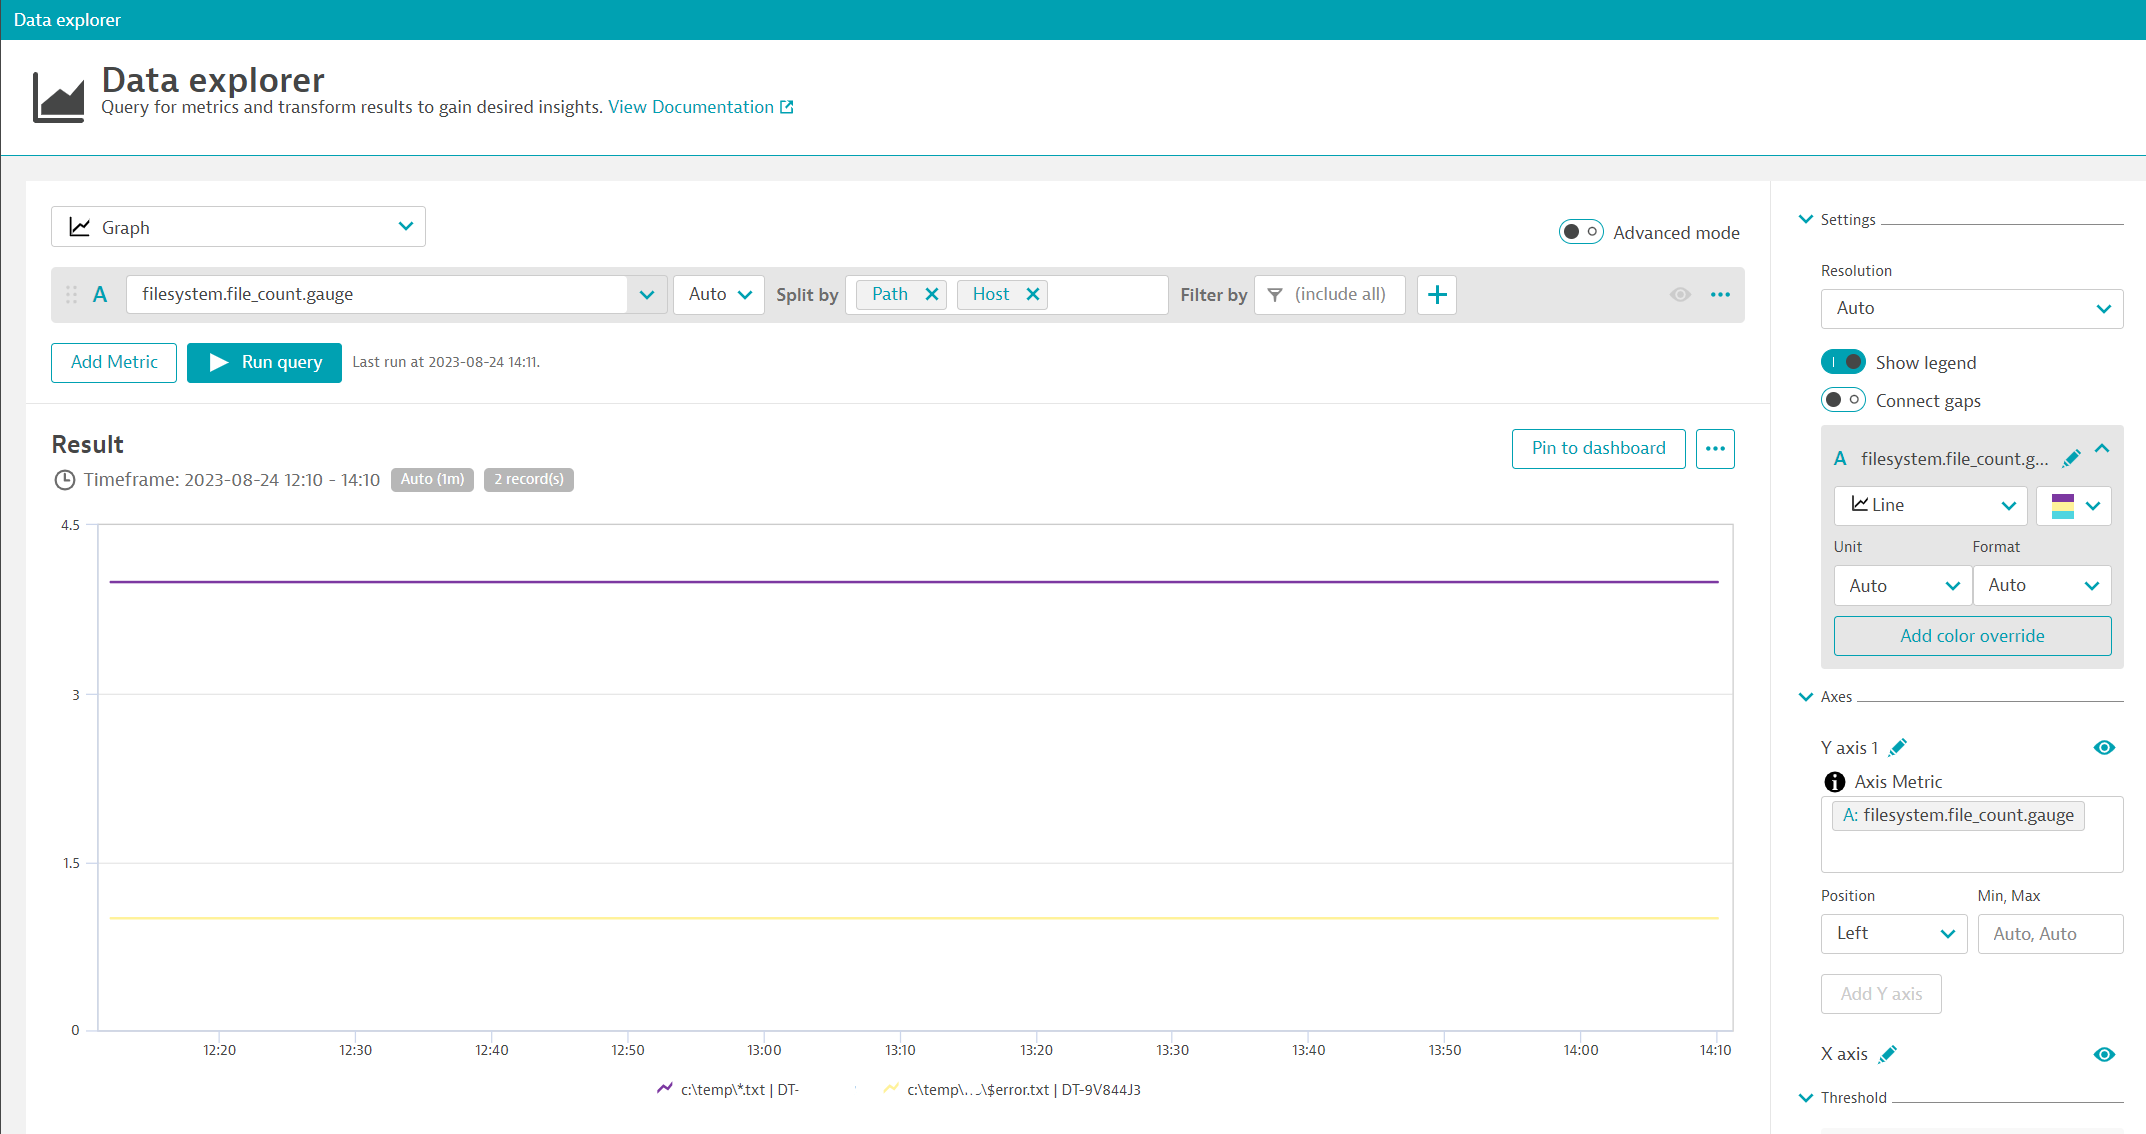 dataexplorer
 -
To drill down to the host or file check, hover on a data point and select View path or View host list.
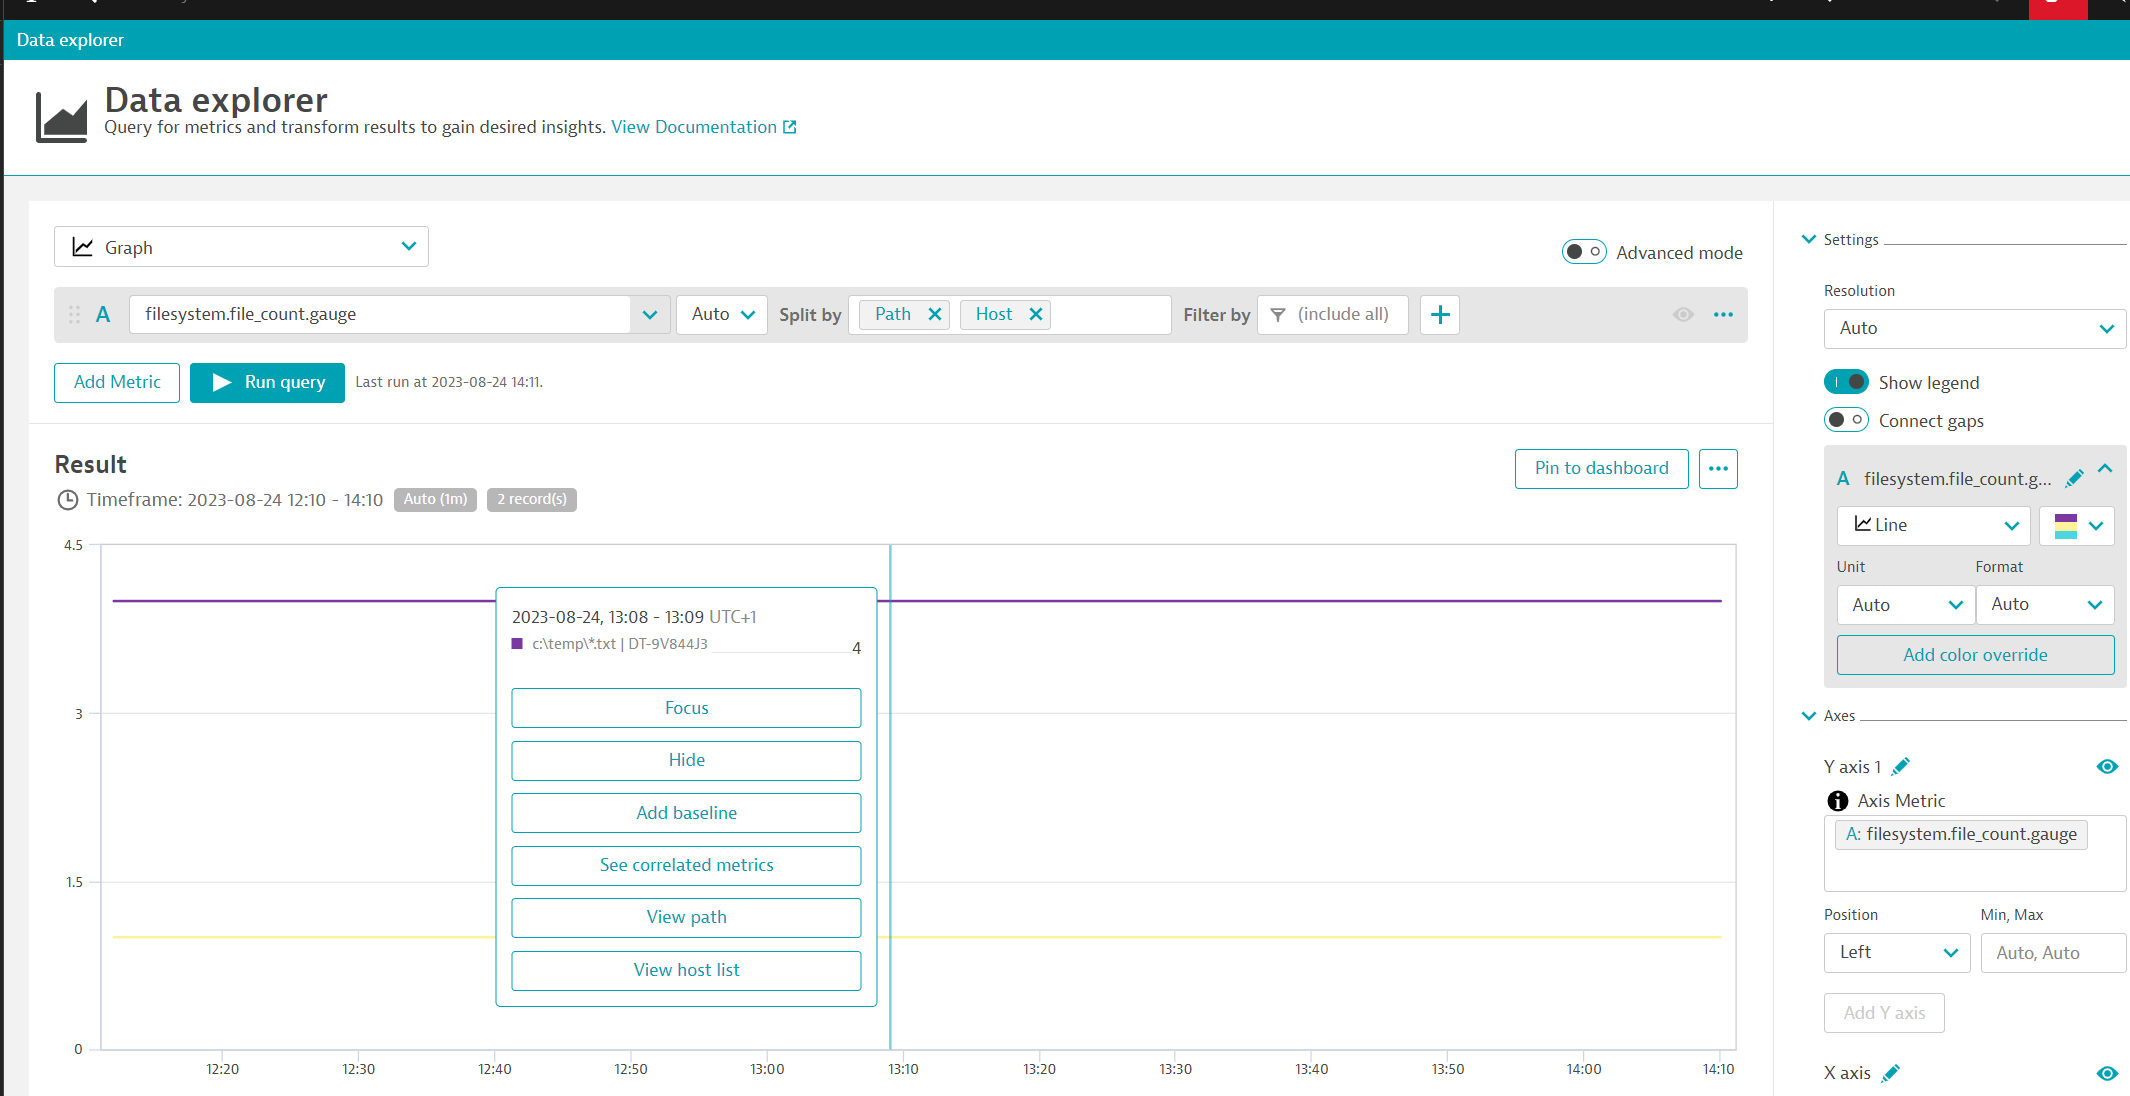 dataexplorer2
Alerts
To create alerts, see metric events for alerting.
Feature sets
When activating your extension using a monitoring configuration, you can limit monitoring to one of the feature sets. To work properly, the extension has to collect at least one metric after the activation.
In highly segmented networks, feature sets can reflect the segments of your environment. Then, when you create a monitoring configuration, you can select a feature set and a corresponding ActiveGate group that can connect to this particular segment.
All metrics that aren't categorized into any feature set are considered to be the default and are always reported.
A metric inherits the feature set of a subgroup, which in turn inherits the feature set of a group. Also, the feature set defined on the metric level overrides the feature set defined on the subgroup level, which in turn overrides the feature set defined on the group level.
FAQ
How does the extension handle traversal of junctions and symbolic links?
For security purposes, the Python runtime does not follow junctions (Windows) or symbolic links (Linux) created by non-administrative users.
How does the "Treat no matches as success" toggle work?
When this toggle is enabled, the extension inverts the success criteria for the check being used:
- If the check does not match the configured path, it is considered successful.
- If the check does match the configured path, it is considered unsuccessful.
What file check types is the "Treat no matches as success" toggle available for?
The following check types have the Treat no matches as success toggle available:
-
Count check
-
Modification age count check
Troubleshooting
If the extension doesn't have sufficient privileges to see the folder contents, it reports unexpected values: 0 for file size or count, or -1 for file age.
Grant access to all users in that location and try again, then narrow down the access to the correct account or group.
Don't use the file size metric for calculating the size of big volumes/mount points recursively such as c:\\**, as it will scan each file and time out. The same applies to the other metrics when using recursive search with a very large number of files or subdirectories.
For more information on which user runs the OneAgent, see:
