Understand and manage consumption for Browser Monitor or Clickpath (DPS)
- Latest Dynatrace
- Explanation
- 5-min read
Browser Monitors are synthetic monitoring capabilities that simulate user interactions with your web applications.
This page explains how consumption is calculated, and how you can estimate, manage, and optimize your synthetic monitoring usage in Dynatrace.
How consumption is calculated
Browser Monitors consume usage based on the number of synthetic actions executed, using the Browser Monitor or Clickpath rate-card item.
Synthetic actions are triggered by steps within a browser monitor, as described below.
Key definitions
- Browser monitor
A simulated browser test that you configure in Dynatrace. Each browser monitor is composed of one or more steps.
- Step
A discreet unit within a browser monitor, which represents a single simulated user interaction. Example steps are "navigate to homepage", "select the login button", or "submit a form".
- Synthetic action
A synthetic action is a specific step that is billable. Steps are billable only when they trigger a web request, for example, page loads, navigations, and user actions that explicitly trigger XHR or Fetch requests.
Counting rules
-
No single step is ever counted as more than one synthetic action.
-
Every time a synthetic test runs, Dynatrace counts the actions executed during that run.
-
Synthetic actions are counted for both public and private synthetic executions.
-
If a step triggers one or more web requests, it's counted as one synthetic action. A step that triggers, for example, three XHR requests is billed as a single synthetic action. Consumption is driven by the number of steps that produce at least one web request, not by the total number of web requests.
-
A synthetic action is billed as soon as the step is executed, regardless of whether the action passes or fails.
-
If a step triggers no web requests, it counts as zero synthetic actions. The following interactions don't consume synthetic actions:
-
Steps that consist only of scrolls, keystrokes, or clicks that don't trigger a web request.
-
XHR or Fetch requests automatically triggered by the browser after a page load, unless explicitly triggered by a user action.
-
Any steps that occur after a failed action, since they're never executed.
-
Consumption example
In this example, we'll have a browser monitor with four steps.
| Step | User action | What happens | Synthetic actions billed |
|---|---|---|---|
1 | Go to the homepage | Triggers a page load | 1 |
2 | Select Login | Triggers an XHR request to the authorization API, which then fires two additional XHR requests for user profile and preferences | 1 |
3 | Scroll down the page | No web request triggered | 0 |
4 | Select Submit order | Triggers a Fetch request | 1 |
In total, three synthetic actions are billed for this single browser monitor execution, even though the browser monitor has four steps and step 2 produced three web requests.
Estimate your cost
You can estimate your monthly cost by calculating the total number of billable steps (that is, a step that triggers at least one web request). Then, use the formula below.
Consumption formula
(# of billable steps per execution)× (# of executions per hour)× (# of locations)× (# of hours)= Total synthetic actions
Cost example
For simplicity, this example assumes that:
- Calculations are based on a list price of $0.0045 per synthetic actions, see Dynatrace pricing. This may differ from your rate card price.
- One month is equivalent to 30 days, or 720 hours.
If you have a browser monitor that:
- Has four steps, of which three trigger at least one request.
- Is executed every 15 minutes.
- Monitors from three locations.
Your monthly consumption can be calculated with the formula below.
3 billable steps per execution× 4 executions per hour× 3 locations× 720 hours= 25,920 synthetic actions
Multiplied by the unit cost of $0.0045 per result, the total cost for synthetic actions in this example is $116.64 per month.
Understand and manage your consumption
Dynatrace provides various options to help you understand and analyze your organization's consumption of Browser Monitor or Clickpath.
Insights via Account Management
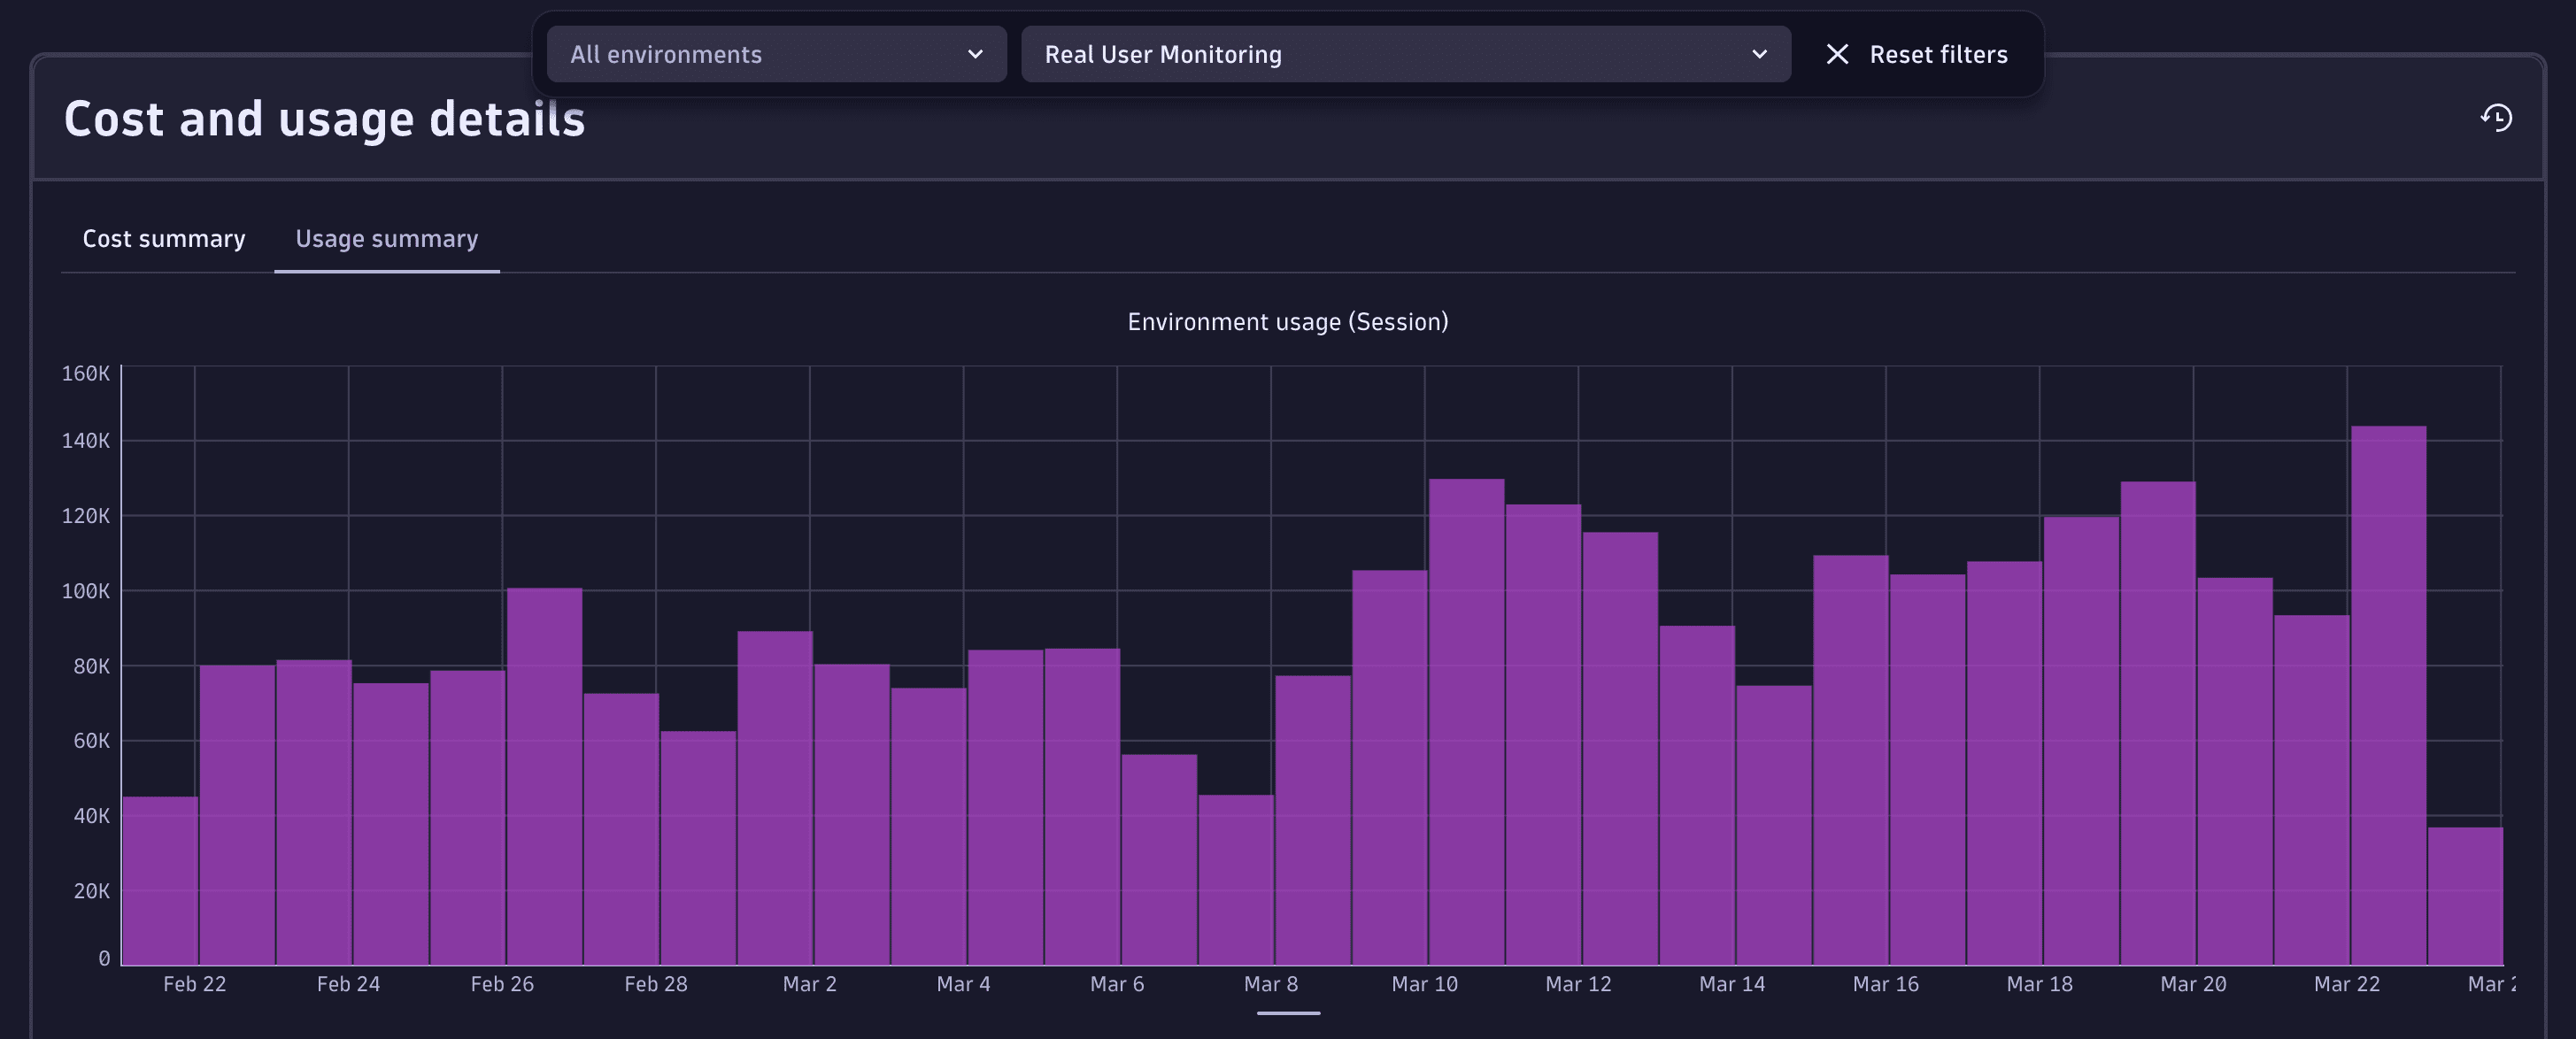
License managers can view usage and costs in Account Management. Go to Account Management > Subscription > Overview > Cost and usage details > Usage summary and select the Browser Monitor and Clickpath capability.
For more information, see Overview (Dynatrace Platform Subscription).
Insights via billing usage events
Billing usage events (BUEs, billing_usage_event) are system events emitted by Dynatrace into the dt.system.events data space.
You can use DQL to query BUEs, and analyze usage and cost for Real User Monitoring capabilities without re-applying billing rules or session-counting logic.
BUEs represent already-calculated, billable usage for DPS capabilities (not any configuration or potential usage), and are aligned with what is shown in Account Management and on invoices. Therefore, they're the recommended data source for understanding related consumption.
Billing usage events contain:
- Which DPS capability was consumed.
- The usage amount that contributes to billing.
- The time window the usage belongs to.
- The entity context the usage is attributed to (for example, an application).
Query billing usage events with DQL
You can use billing usage events as the authoritative source when building cost allocation, usage analysis, or cost transparency views.
For example, aggregate by application to understand which applications contribute most to usage and cost.
Here are some example DQL queries for various use cases. You can use these queries as-is, or modify them to meet your needs.
-
Total usage over time
fetch dt.system.events| filter event.kind == "BILLING_USAGE_EVENT" and event.type == "Browser Monitor and Clickpath"| dedup event.id| summarize totalUsage = sum(billed_sessions), by:{bin(timestamp, 1d)}
Insights via API
You can query insights via the Environment API – Grail Query. Example DQL queries are provided in Query billing usage events with DQL.
FAQs
Are synthetic actions consumed when I run tests on demand?
Yes. On-demand executions from assigned locations count the same as scheduled executions.
Do failed actions still consume actions?
Yes. Actions are counted once they start executing. However, any steps that are skipped due to failure do not consume actions.
Does Dynatrace count internal browser network calls as actions?
No. Only web requests triggered directly by synthetic user actions (such as page loads or explicit XHR triggers) are counted.
Do disabled monitors consume actions?
No. Disabled monitors stop all executions and do not generate any consumption.