Cisco ACI/APIC extension
- Latest Dynatrace
- Extension
Monitor Cisco ACI fabric, tenants, EPGs, and contracts for health, performance, and faults via the APIC REST API with topology insights.
Get started
Overview
Cisco ACI/APIC extension uses Cisco APIC REST API to collect information about the network fabric managed by Application Policy Infrastructure Controllers (APIC).
The extension provides comprehensive visibility into the ACI Fabric and Tenants.
The extension collects performance metrics, health scores, and faults from ACI Fabric components, including leaf and spine nodes, controller cluster elements, and Layer 1 physical and Management interfaces. It also gathers information about Tenants and their Application Profiles, Private Networks, Bridge Domains, Contracts, and Endpoint Groups (EPGs).
Use cases
- Comprehensive monitoring of ACI Fabric and Tenants health and performance
- Integration with broader infrastructure and application monitoring in Dynatrace
- Root cause analysis of network issues, in the light of the entire application and infrastructure landscape observed by Dynatrace.
Requirements
- Connectivity is required between the ActiveGate, where the extension is deployed, and the Application Policy Infrastructure Controller.
Create a specific APIC user
For Dynatrace integration, we recommend creating a specific user with read-only privileges. Users can be defined locally on APIC or can be remotely authenticated, based on APIC login policies.
This is an example of creating a locally authenticated user:
- Select Admin > AAA > Users (left panel) > Local (right area) > Action > Create Local User
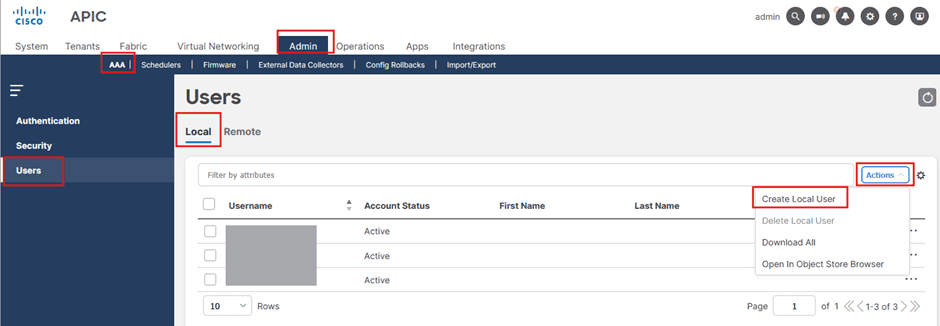
-
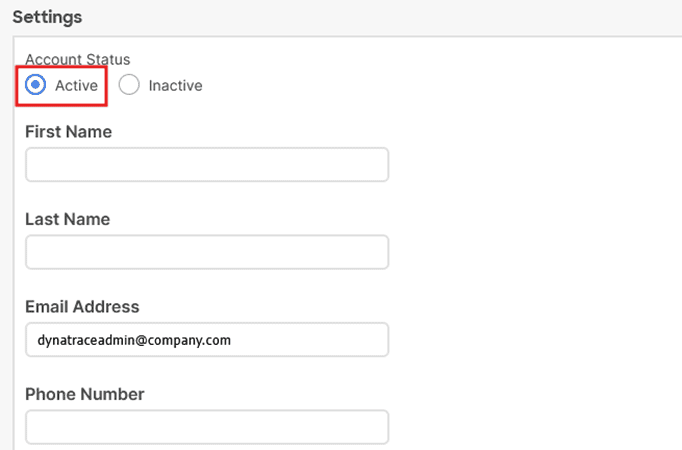
Provide required information:
- General
- Username
- Password
- Confirm password
- Setting
- Set account status as
Active - Contact information
- Set account status as
- General
-
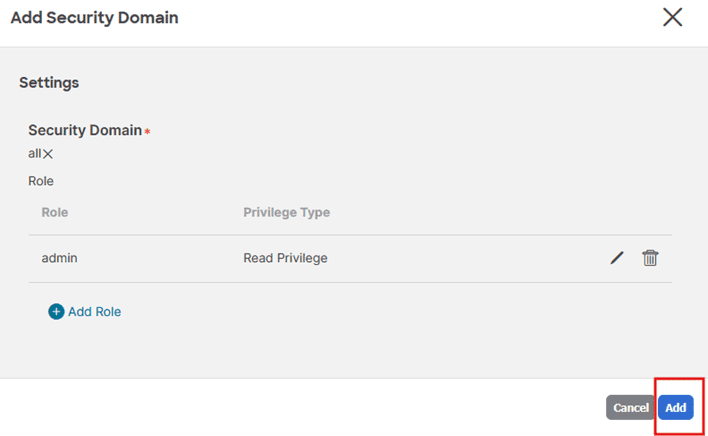
Add Security Domains
- Select Select Security Domain.
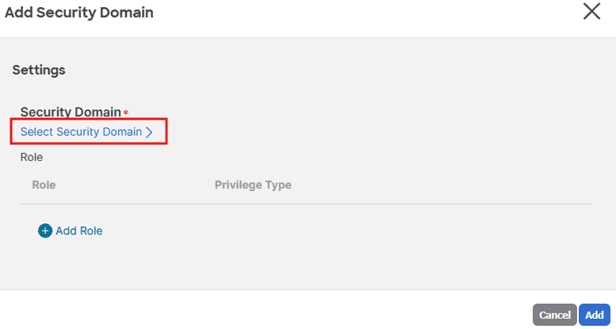 Select Security Domain
- Choose security domain:
all.
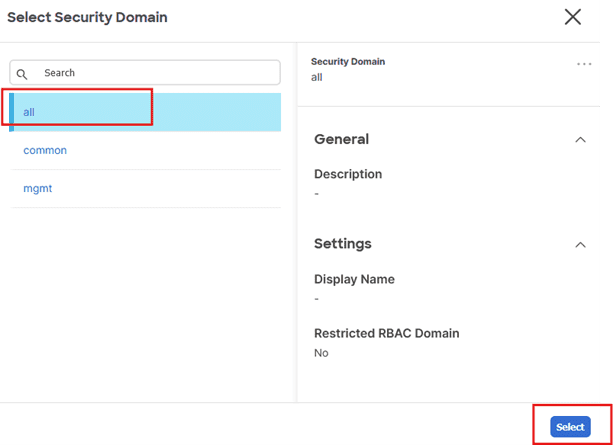
- Select Add Role.
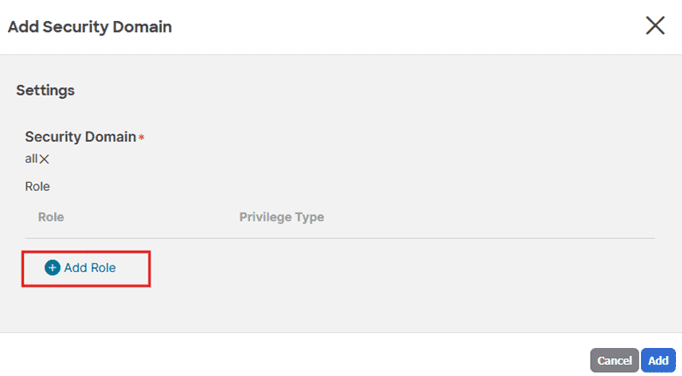
- Select Select Role.
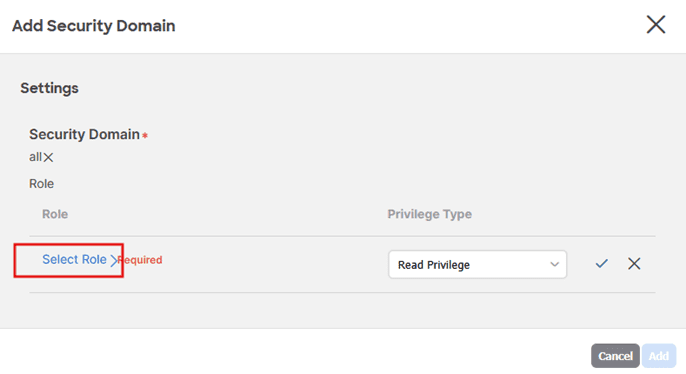
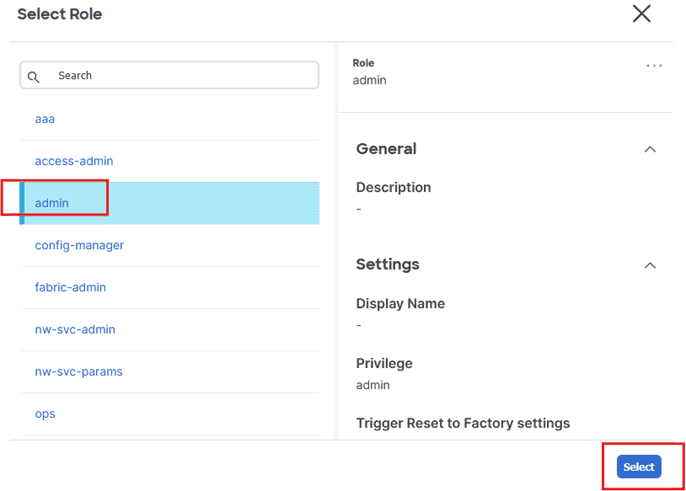
- Select
adminrole and confirm.
- Confirm selected
Read Privilege.
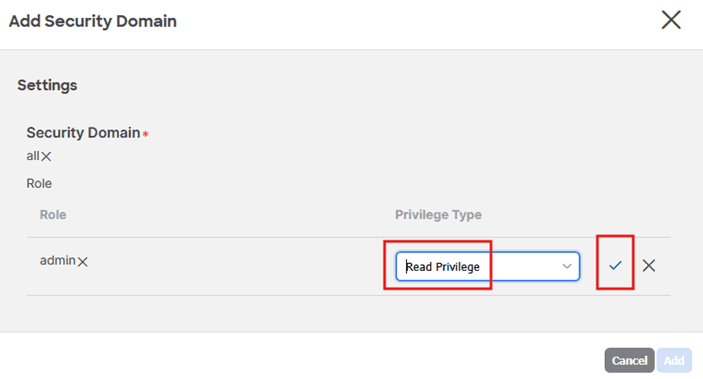
- Select Add.
-
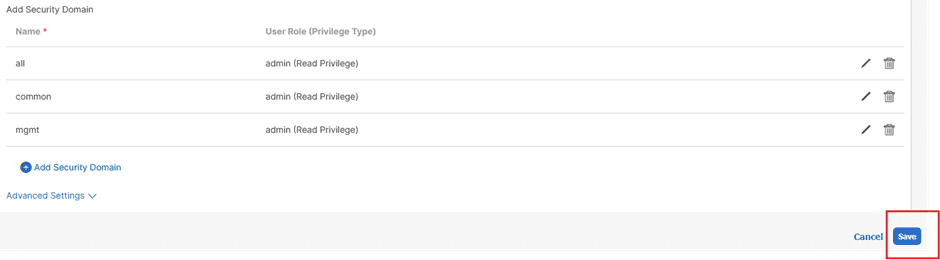
Repeat above steps for security domains
commonandmgmt -
Confirm Save to create a new user.
Compatibility information
- Cisco APIC version 6.0 and above
- API interface on Cisco ACI/APIC is available by design. Integration was implemented and tested on ACI/APIC version 6.0(7e).
Activation and setup
- Find the extension in Dynatrace Hub and add it to your environment.
- Create a new monitoring configuration.
Details
The extension package contains
- Extension code that integrates with APIC REST API endpoints to collect metrics
- Dashboards providing high-level overviews of the ACI Fabric and Tenants
- Unified Analysis pages for Fabric pods, nodes, node systems, controller nodes, and physical/management interfaces
- Unified Analysis pages for Tenants, Application Profiles, Private Networks, Bridge Domains, Contracts, EPGs, and EPG Contract Providers/Consumers
- Fault reporting available both as log records and as Dynatrace events
- Analysis screens integrated with Infrastructure and Operations app
Summary of the monitored entities
- Fabric
- Fabric Pods
- Fabric Nodes (Leafs and Spines)
- ACI Top Systems
- ACI Controller Cluster Elements
- L1 Physical Interfaces
- Management Interfaces
- Controller Physical Interfaces
- Tenants
- Application Profiles
- Private Networks
- Bridge Domains
- Contracts
- Endpoint Groups (EPGs)
- EPG Contract Providers and Consumers
- Relationships between Bridge Domains and EPGs
The ACI extension metrics grouping (featureSets)
The following featureSets categorize various metrics collected by the Cisco ACI extension from the APIC controller:
default– Provides an overview of overall Cisco ACI health, including interface and device-specific metrics used in the Infrastructure & Operations application.fabric– Covers Fabric-related metrics.fabric_if_stats– Captures Fabric interface metrics with a 5-minute aggregation.tenants– Covers Tenant-related metrics.tenants_stats– Captures ingress and egress metrics for Tenant entities with a 15-minute aggregation.self-monitoring(optional) – Metrics for fine-tuning and diagnostics of the extension itself.
Fabric interface metrics are aggregated over 5-minute intervals and reported at least once every 5 minutes. Tenant entity ingress and egress metrics are aggregated over 15-minute intervals and reported at least once every 15 minutes.
Faults reporting and event integration
The extension supports ingesting ACI Faults and reporting them as log messages and as Dynatrace events.
-
Log Message Reporting:
- Faults can be ingested and reported as log messages.
- Filtering by fault severity is supported, allowing you to report only the relevant faults.
- The extension can also report fault records as log messages. Fault records track state changes of faults, which can be useful for custom processing.
-
Dynatrace Event Generation: Faults can also be raised as Dynatrace events with the following advanced options::
-
Custom Event Type Mapping: Map fault severities, types, and domains to specific Dynatrace event types (e.g.,
ERROR_EVENT,CUSTOM_ALERT,CUSTOM_INFO). -
Default and Conditional Event Overrides: Define a default event type (e.g.,
ERROR_EVENT) and override it conditionally based on specific criteria. -
Event Suppression: Suppress selected events entirely using a dedicated suppression value.
-
Note: Event generation applies only to faults that are already enabled for log message reporting.
Licensing and costs
There is no charge to use the extension. You are only charged for the data that the extension ingests.
The Cisco ACI/APIC extension ingests custom metrics, which consume Davis Data Units (DDUs) (Dynatrace classic license) or Metrics powered by Grail (DPS), according to your license model.
The extension ingests various metrics at 5-, 15-, and 60-minute intervals as described in the following code blocks. The calculations are approximate and assume that:
- All feature sets are enabled.
- A single log record is 5000 bytes.
- The number of faults and fault records depends on your environment.
Metrics calculations:
-
5-minute intervals
10 (featureSet: fabric)+ 8 * <Number of Fabric Pods> (featureSet: fabric)+ 2 * <Number of Fabric Nodes> (featureSet: fabric)+ (6 + 37) * <Number of leaf or spine Fabric Nodes> (featureSets: default and fabric)+ 3 * <Number of controller Fabric Nodes> (featureSet: fabric)+ (3 + 8) * <Number of Layer 1 Physical Interfaces with the traffic> (spines and leaves, featureSets: default and fabric-if-stats)+ (1 + 3) * <Number of Layer 1 Physical Interfaces without the traffic> (spines and leaves, featureSets: default and fabric-if-stats)+ (3 + 8) * <Number of Management Interfaces with the traffic> (spines and leaves, featureSets: default and fabric-if-stats)+ (1 + 3) * <Number of Management Interfaces without the traffic> (spines and leaves, featureSets: default and fabric-if-stats)+ (1 + 2) * <Number of Controller Physical Interfaces> (controllers, featureSet: fabric)+ <Number of faults grouped by type, domain, severity and delegated flag> (featureSet: fabric)+ 5 * <Number of Tenants> (featureSet: tenants)+ 1 * <Number of Application Profiles> (featureSet: tenants)+ 1 * <Number of Private Networks> (featureSet: tenants)+ 1 * <Number of Bridge Domains> (featureSet: tenants)+ 3 * <Number of EPGs> (featureSet: tenants)+ 8 // Optional - Self monitoring metrics (featureSet: self-monitoring) -
15-minute interval (tenants-stats featureSet)
12 * <Number of Tenants>+ 12 * <Number of Application Profiles>+ 12 * <Number of Private Networks>+ 12 * <Number of Bridge Domains>+ 12 * <Number of EPGs> -
60-minute intervals
<Number of Fabric Pods>+ <Number of Fabric Nodes>+ <Number of leaf or spine Fabric Nodes>+ <Number of controller Fabric Nodes>+ <Number of Layer 1 Physical Interfaces>+ <Number of Management Interfaces>+ <Number of Controller Physical Interfaces>+ <Number of Tenants>+ <Number of Application Profiles>+ <Number of Private Networks>+ <Number of Bridge Domains>+ <Number of EPGs>+ <Number of EPG Contract Providers>+ <Number of EPG Contract Consumers>+ <Number of relation between Bridge Domain and EPG>+ <Number of faults> (if configured to report faults as log records)+ <Number of fault records> (if configured to report fault records as log records)
To calculate your hourly consumption, sum all metrics ingested at the various intervals:
([5-minute metrics] * 12) + ([15-minute metrics] * 4) + (60-minute metrics) = Metric data points per 60 minutes
Dynatrace Platform Subscription
In the Dynatrace Platform Subscription, metric ingestion consumes Metrics powered by Grail according to the number of ingested metric data points.
To calculate the approximate yearly consumption, apply the following calculation: <metric data points per 60 minutes> * 24 hours * 365 days.
For logs, regular consumption applies. See Log Analytics.
Dynatrace classic license
In the classic licensing model, metric ingestion consumes Davis Data Units (DDUs) at the rate of .001 DDUs per metric data point. Multiply the above formula for annual data points by .001 to estimate annual DDU usage.
Logs ingestion consumes DDUs at the rate of .0005 DDU per log line. For logs, regular DDU consumption applies. See DDU consumption for Log Management and Analytics or DDUs for Log Monitoring Classic.
The DDU cost above does not include any possible log events or custom events that are triggered by the extension. For more information, see DDU events.
FAQ
Do I need to enable all feature sets?
No, not all feature sets are required.
self-monitoringis optional and is only needed for fine-tuning and diagnostics of the extension itself.- If you want to view PLATFORM screens (generic network device and interface metrics) within Infrastructure & Operations Application, only
defaultfeature set is needed. - If you want to view both CLASSIC screens and all PLATFORM screens for Fabric (generic network device and interface metrics and Fabric metrics), enable
fabricandfabric-if-statsfeature sets. - If you want to view both CLASSIC screens and all PLATFORM screens for Tenants (Tenants metrics), enable
tenantsandtenants-statsfeature sets.
Can I increase monitoring interval to 15 minutes?
We recommend a 5-minute monitoring interval. In very large environments, increasing monitoring interval may help with scalability; this however is always occupied with data fidelity loss. We don't recommend going beyond 15 minutes.
If you need higher data fidelity for entity health metrics, you can reduce the monitoring interval to 1 minute. Please note that if the number of samples within a 1-minute interval is zero, the health metric will not be reported. This can occur due to APIC sampling behavior and the timing of the extension’s data collection.
Feature sets
When activating your extension using a monitoring configuration, you can limit monitoring to one of the feature sets. To work properly, the extension has to collect at least one metric after the activation.
In highly segmented networks, feature sets can reflect the segments of your environment. Then, when you create a monitoring configuration, you can select a feature set and a corresponding ActiveGate group that can connect to this particular segment.
All metrics that aren't categorized into any feature set are considered to be the default and are always reported.
A metric inherits the feature set of a subgroup, which in turn inherits the feature set of a group. Also, the feature set defined on the metric level overrides the feature set defined on the subgroup level, which in turn overrides the feature set defined on the group level.
self-monitoring
| Metric name | Metric key | Description |
|---|---|---|
| Overall Metrics Data Collection Time | sfm.cisco.aci.monitor.run.duration | Total duration of all queries to collect data reported as metrics and log records |
| Metrics Data Collection Error | sfm.cisco.aci.monitor.run.error | Indicates whether an error occurred during the most recent data collection. |
| Paged Data Query Duration | sfm.cisco.aci.fetch_class_page.duration | Duration of paged queries to collect data reported as metrics and log records |
| Paged Data Query Errors | sfm.cisco.aci.fetch_class_page.error | Number of errors that occurred during the most recent paged queries to collect data reported as metrics and log records |
| Paged Data Count Query Duration | sfm.cisco.aci.fetch_class_count.duration | Duration of queries to get object counts for paged queries |
| Paged Data Count Query Errors | sfm.cisco.aci.fetch_class_count.error | Number of errors that occurred during the most recent queries to get object counts for paged queries |
| Object Count Query Duration | sfm.cisco.aci.fetch_count_query.duration | Duration of queries to get object counts reported as metrics |
| Object Count Query Errors | sfm.cisco.aci.fetch_count_query.error | Number of errors that occurred during the most recent queries to get object counts reported as metrics |
default
| Metric name | Metric key | Description |
|---|---|---|
| — | com.dynatrace.extension.network_device.sysuptime | — |
| — | com.dynatrace.extension.network_device.memory_usage | — |
| — | com.dynatrace.extension.network_device.memory_free | — |
| — | com.dynatrace.extension.network_device.memory_total | — |
| — | com.dynatrace.extension.network_device.memory_used | — |
| — | com.dynatrace.extension.network_device.cpu_usage | — |
| — | com.dynatrace.extension.network_device.if.status | — |
| — | com.dynatrace.extension.network_device.if.bytes_in.count | — |
| — | com.dynatrace.extension.network_device.if.bytes_out.count | — |
tenants-stats
| Metric name | Metric key | Description |
|---|---|---|
| — | cisco.aci.app_profile.l2_egr_bytes_ag_hist.multicast_cum | — |
| Application Profile Multicast Egress Bytes Rate | cisco.aci.app_profile.l2_egr_bytes_ag_hist.multicast_rate | Application Profile - Multicast Egress Bytes Rate in a 15 minute sampling interval |
| — | cisco.aci.app_profile.l2_egr_bytes_ag_hist.unicast_cum | — |
| Application Profile Unicast Egress Bytes Rate | cisco.aci.app_profile.l2_egr_bytes_ag_hist.unicast_rate | Application Profile - Unicast Egress Bytes Rate in a 15 minute sampling interval |
| — | cisco.aci.app_profile.l2_ingr_bytes_ag_hist.drop_cum | — |
| Application Profile Ingress Drop Rate | cisco.aci.app_profile.l2_ingr_bytes_ag_hist.drop_rate | Application Profile - Ingress Drop Rate in a 15 minute sampling interval |
| — | cisco.aci.app_profile.l2_ingr_bytes_ag_hist.flood_cum | — |
| Application Profile Ingress Flood Rate | cisco.aci.app_profile.l2_ingr_bytes_ag_hist.flood_rate | Application Profile - Ingress Flood Rate in a 15 minute sampling interval |
| — | cisco.aci.app_profile.l2_ingr_bytes_ag_hist.multicast_cum | — |
| Application Profile Multicast Ingress Bytes Rate | cisco.aci.app_profile.l2_ingr_bytes_ag_hist.multicast_rate | Application Profile - Multicast Ingress Bytes Rate in a 15 minute sampling interval |
| — | cisco.aci.app_profile.l2_ingr_bytes_ag_hist.unicast_cum | — |
| Application Profile Unicast Ingress Bytes Rate | cisco.aci.app_profile.l2_ingr_bytes_ag_hist.unicast_rate | Application Profile - Unicast Ingress Bytes Rate in a 15 minute sampling interval |
| — | cisco.aci.bridge_domain.l2_egr_bytes_ag_hist.multicast_cum | — |
| Bridge Domain Multicast Egress Bytes Rate | cisco.aci.bridge_domain.l2_egr_bytes_ag_hist.multicast_rate | Bridge Domain - Multicast Egress Bytes Rate in a 15 minute sampling interval |
| — | cisco.aci.bridge_domain.l2_egr_bytes_ag_hist.unicast_cum | — |
| Bridge Domain Unicast Egress Bytes Rate | cisco.aci.bridge_domain.l2_egr_bytes_ag_hist.unicast_rate | Bridge Domain - Unicast Egress Bytes Rate in a 15 minute sampling interval |
| — | cisco.aci.bridge_domain.l2_ingr_bytes_ag_hist.drop_cum | — |
| Bridge Domain Ingress Drop Rate | cisco.aci.bridge_domain.l2_ingr_bytes_ag_hist.drop_rate | Bridge Domain - Ingress Drop Rate in a 15 minute sampling interval |
| — | cisco.aci.bridge_domain.l2_ingr_bytes_ag_hist.flood_cum | — |
| Bridge Domain Ingress Flood Rate | cisco.aci.bridge_domain.l2_ingr_bytes_ag_hist.flood_rate | Bridge Domain - Ingress Flood Rate in a 15 minute sampling interval |
| — | cisco.aci.bridge_domain.l2_ingr_bytes_ag_hist.multicast_cum | — |
| Bridge Domain Multicast Ingress Bytes Rate | cisco.aci.bridge_domain.l2_ingr_bytes_ag_hist.multicast_rate | Bridge Domain - Multicast Ingress Bytes Rate in a 15 minute sampling interval |
| — | cisco.aci.bridge_domain.l2_ingr_bytes_ag_hist.unicast_cum | — |
| Bridge Domain Unicast Ingress Bytes Rate | cisco.aci.bridge_domain.l2_ingr_bytes_ag_hist.unicast_rate | Bridge Domain - Unicast Ingress Bytes Rate in a 15 minute sampling interval |
| — | cisco.aci.endpoint_group.l2_egr_bytes_ag_hist.multicast_cum | — |
| Endpoint Group Multicast Egress Bytes Rate | cisco.aci.endpoint_group.l2_egr_bytes_ag_hist.multicast_rate | Endpoint Group - Multicast Egress Bytes Rate in a 15 minute sampling interval |
| — | cisco.aci.endpoint_group.l2_egr_bytes_ag_hist.unicast_cum | — |
| Endpoint Group Unicast Egress Bytes Rate | cisco.aci.endpoint_group.l2_egr_bytes_ag_hist.unicast_rate | Endpoint Group - Unicast Egress Bytes Rate in a 15 minute sampling interval |
| — | cisco.aci.endpoint_group.l2_ingr_bytes_ag_hist.drop_cum | — |
| Endpoint Group Ingress Drop Rate | cisco.aci.endpoint_group.l2_ingr_bytes_ag_hist.drop_rate | Endpoint Group - Ingress Drop Rate in a 15 minute sampling interval |
| — | cisco.aci.endpoint_group.l2_ingr_bytes_ag_hist.flood_cum | — |
| Endpoint Group Ingress Flood Rate | cisco.aci.endpoint_group.l2_ingr_bytes_ag_hist.flood_rate | Endpoint Group - Ingress Flood Rate in a 15 minute sampling interval |
| — | cisco.aci.endpoint_group.l2_ingr_bytes_ag_hist.multicast_cum | — |
| Endpoint Group Multicast Ingress Bytes Rate | cisco.aci.endpoint_group.l2_ingr_bytes_ag_hist.multicast_rate | Endpoint Group - Multicast Ingress Bytes Rate in a 15 minute sampling interval |
| — | cisco.aci.endpoint_group.l2_ingr_bytes_ag_hist.unicast_cum | — |
| Endpoint Group Unicast Ingress Bytes Rate | cisco.aci.endpoint_group.l2_ingr_bytes_ag_hist.unicast_rate | Endpoint Group - Unicast Ingress Bytes Rate in a 15 minute sampling interval |
| — | cisco.aci.private_network.l2_egr_bytes_ag_hist.multicast_cum | — |
| Private Network Multicast Egress Bytes Rate | cisco.aci.private_network.l2_egr_bytes_ag_hist.multicast_rate | Private Network - Multicast Egress Bytes Rate in a 15 minute sampling interval |
| — | cisco.aci.private_network.l2_egr_bytes_ag_hist.unicast_cum | — |
| Private Network Unicast Egress Bytes Rate | cisco.aci.private_network.l2_egr_bytes_ag_hist.unicast_rate | Private Network - Unicast Egress Bytes Rate in a 15 minute sampling interval |
| — | cisco.aci.private_network.l2_ingr_bytes_ag_hist.drop_cum | — |
| Private Network Ingress Drop Rate | cisco.aci.private_network.l2_ingr_bytes_ag_hist.drop_rate | Private Network - Ingress Drop Rate in a 15 minute sampling interval |
| — | cisco.aci.private_network.l2_ingr_bytes_ag_hist.flood_cum | — |
| Private Network Ingress Flood Rate | cisco.aci.private_network.l2_ingr_bytes_ag_hist.flood_rate | Private Network - Ingress Flood Rate in a 15 minute sampling interval |
| — | cisco.aci.private_network.l2_ingr_bytes_ag_hist.multicast_cum | — |
| Private Network Multicast Ingress Bytes Rate | cisco.aci.private_network.l2_ingr_bytes_ag_hist.multicast_rate | Private Network - Multicast Ingress Bytes Rate in a 15 minute sampling interval |
| — | cisco.aci.private_network.l2_ingr_bytes_ag_hist.unicast_cum | — |
| Private Network Unicast Ingress Bytes Rate | cisco.aci.private_network.l2_ingr_bytes_ag_hist.unicast_rate | Private Network - Unicast Ingress Bytes Rate in a 15 minute sampling interval |
| — | cisco.aci.tenant.l2_egr_bytes_ag_hist.multicast_cum | — |
| Tenant Multicast Egress Bytes Rate | cisco.aci.tenant.l2_egr_bytes_ag_hist.multicast_rate | Tenant - Multicast Egress Bytes Rate in a 15 minute sampling interval |
| — | cisco.aci.tenant.l2_egr_bytes_ag_hist.unicast_cum | — |
| Tenant Unicast Egress Bytes Rate | cisco.aci.tenant.l2_egr_bytes_ag_hist.unicast_rate | Tenant - Unicast Egress Bytes Rate in a 15 minute sampling interval |
| — | cisco.aci.tenant.l2_ingr_bytes_ag_hist.drop_cum | — |
| Tenant Ingress Drop Rate | cisco.aci.tenant.l2_ingr_bytes_ag_hist.drop_rate | Tenant - Ingress Drop Rate in a 15 minute sampling interval |
| — | cisco.aci.tenant.l2_ingr_bytes_ag_hist.flood_cum | — |
| Tenant Ingress Flood Rate | cisco.aci.tenant.l2_ingr_bytes_ag_hist.flood_rate | Tenant - Ingress Flood Rate in a 15 minute sampling interval |
| — | cisco.aci.tenant.l2_ingr_bytes_ag_hist.multicast_cum | — |
| Tenant Multicast Ingress Bytes Rate | cisco.aci.tenant.l2_ingr_bytes_ag_hist.multicast_rate | Tenant - Multicast Ingress Bytes Rate in a 15 minute sampling interval |
| — | cisco.aci.tenant.l2_ingr_bytes_ag_hist.unicast_cum | — |
| Tenant Unicast Ingress Bytes Rate | cisco.aci.tenant.l2_ingr_bytes_ag_hist.unicast_rate | Tenant - Unicast Ingress Bytes Rate in a 15 minute sampling interval |
tenants
| Metric name | Metric key | Description |
|---|---|---|
| Application Profile Health | cisco.aci.app_profile.health | Application Profile - Health |
| Bridge Domain Health | cisco.aci.bridge_domain.health | Bridge Domain - Health |
| Endpoint Group Contract Consumers | cisco.aci.endpoint_group.contract_consumers | Endpoint Group - Contract Consumers |
| Endpoint Group Contract Providers | cisco.aci.endpoint_group.contract_providers | Endpoint Group - Contract Providers |
| Endpoint Group Health | cisco.aci.endpoint_group.health | Endpoint Group - Health |
| Private Network Health | cisco.aci.private_network.health | Private Network - Health |
| Application Profiles | cisco.aci.tenant.app_profiles | Application Profiles |
| Bridge Domains | cisco.aci.tenant.bridge_domains | Bridge Domains |
| Contracts | cisco.aci.tenant.contracts | Contracts |
| Tenant health | cisco.aci.tenant.health | Tenant - Health |
| Private Networks | cisco.aci.tenant.private_networks | Private Networks |
fabric
| Metric name | Metric key | Description |
|---|---|---|
| Global pcTag | cisco.aci.apic.global_pc_tags | Fabric Capacity - Global pcTag |
| MAC Endpoints | cisco.aci.apic.global_mac_endpoints | Fabric Capacity - MAC Endpoints |
| IPv6 Endpoints | cisco.aci.apic.global_ipv6_endpoints | Fabric Capacity - IPv6 Endpoints |
| IPv4 Endpoints | cisco.aci.apic.global_ipv4_endpoints | Fabric Capacity - IPv4 Endpoints |
| Proxy Database Entries | cisco.aci.apic.global_proxy_db_entries | Fabric Capacity - MAC + IP Endpoints |
| Fabric Health AVG | cisco.aci.apic.health_avg | Fabric Health AVG in a 5 minute sampling interval |
| Fabric Health MAX | cisco.aci.apic.health_max | Fabric Health MAX in a 5 minute sampling interval |
| Fabric Health MIN | cisco.aci.apic.health_min | Fabric Health MIN in a 5 minute sampling interval |
| Fabric Total Health Score | cisco.aci.apic.health_total | Fabric Total Health Score |
| Fabric Monitoring Endpoint Status | cisco.aci.apic.status | Fabric - Extension Monitoring Endpoint Status. A state metric representing a monitored Fabric endpoint, whose value is always 1 and its dimensions indicate its endpoint configuration details. |
| Administrative state (in-service) | cisco.aci.cluster_element.admin_state_in_service | Custer Element - Administrative state of the cluster is: in-service |
| Appliance's health (fully-fit) | cisco.aci.cluster_element.health_fully_fit | Controller - Appliance's health is: fully-fit |
| Runtime State (available) | cisco.aci.cluster_element.oper_state_available | Controller - Runtime State is available |
| Admin Status | cisco.aci.cnw_phys_if.admin_status | Controller Physical Interface - Administrative status |
| Operational Status | cisco.aci.cnw_phys_if.oper_status | Controller Physical Interface - Operational status |
| Administrative State (on) | cisco.aci.fabric_node.admin_state_on | Fabric Node - Administrative State is: on |
| Fabric State (active) | cisco.aci.fabric_node.fabric_state_active | Fabric Node - Fabric State is: active |
| Fabric Pod Controllers | cisco.aci.fabric_pod.controllers | Fabric Pod - Controllers |
| Fabric Pod Nodes | cisco.aci.fabric_pod.fabric_nodes | Fabric Pod - Nodes |
| Fabric Health AVG | cisco.aci.fabric_pod.health_avg | Fabric Pod - Fabric Health AVG in a 5 minute sampling interval |
| Fabric Health MAX | cisco.aci.fabric_pod.health_max | Fabric Pod - Fabric Health MAX in a 5 minute sampling interval |
| Fabric Health MIN | cisco.aci.fabric_pod.health_min | Fabric Pod - Fabric Health MIN in a 5 minute sampling interval |
| Fabric Total Health Score | cisco.aci.fabric_pod.health_total | Fabric Pod - Fabric Total Health Score |
| Fabric Pod Leaves | cisco.aci.fabric_pod.leaves | Fabric Pod - Leaves |
| Fabric Pod Leaves | cisco.aci.fabric_pod.spines | Fabric Pod - Leaves |
| Faults by Domain | cisco.aci.fault_count.domain | Faults by Domain |
| Faults by Type | cisco.aci.fault_count.type | Faults by Type |
| Admin Status | cisco.aci.l1_phys_if.admin_status | Physical Interface - Admin status |
| Interface Health | cisco.aci.l1_phys_if.health | Physical Interface - Health |
| Operational Status | cisco.aci.l1_phys_if.oper_status | Physical Interface - Operational status |
| Operational Status | cisco.aci.mgmt_if.admin_status | Management Interface - Operational status |
| Interface Health | cisco.aci.mgmt_if.health | Management Interface - Health |
| Operational Status | cisco.aci.mgmt_if.oper_status | Management Interface - Operational status |
| System Health Score | cisco.aci.system.health | System - Health Score |
| System Health AVG | cisco.aci.system.health_avg | System - System Node Health AVG in a 5 minute sampling interval |
| System Health MAX | cisco.aci.system.health_max | System - System Node Health MAX in a 5 minute sampling interval |
| System Health MIN | cisco.aci.system.health_min | System - System Node Health MIN in a 5 minute sampling interval |
| Total L2 Endpoints | cisco.aci.system.l2_total_ep_last | Leaf Layer2 usage statistics - Total L2 Endpoints in a 5 minute sampling interval |
| L2 Endpoints Capacity | cisco.aci.system.l2_total_ep_max | Leaf Layer2 usage statistics - L2 Endpoints capacity in a 5 minute sampling interval |
| L2 Endpoints Usage | cisco.aci.system.l2_total_ep_perc | Leaf Layer2 usage statistics - Total L2 Endpoints divided by L2 Endpoints capacity |
| TCAMs | cisco.aci.system.pol_tcams | Leaf Policy entries usage statistics - TCAMs = (Cumulative - Baseline) |
| Policy Usage Capacity | cisco.aci.system.pol_tcams_max | Leaf Policy entries usage statistics - Policy Usage Capacity |
| TCAMs Usage | cisco.aci.system.pol_tcams_perc | Leaf Policy entries usage statistics - TCAMs Usage = (Cumulative - Baseline) / Capacity |
| Policy Usage Baseline | cisco.aci.system.pol_usage_base | Leaf Policy entries usage statistics - Policy Usage Baseline |
| Policy Usage Cumulative | cisco.aci.system.pol_usage_cum | Leaf Policy entries usage statistics - Policy Usage Cumulative |
| System Kernel CPU Utilization AVG | cisco.aci.system.proc_sys_cpu_kernel_avg | System - Kernel CPU Utilization AVG |
| System Kernel CPU Utilization AVG Last | cisco.aci.system.proc_sys_cpu_kernel_avg_last | System - Kernel CPU Utilization AVG Last |
| System User CPU Utilization AVG | cisco.aci.system.proc_sys_cpu_user_avg | System - User CPU Utilization AVG |
| System User CPU Utilization AVG Last | cisco.aci.system.proc_sys_cpu_user_avg_last | System - User CPU Utilization AVG Last |
| System System CPU Utilization AVG | cisco.aci.system.proc_sys_load_avg | System - System CPU Utilization AVG |
| System System CPU Utilization AVG Last | cisco.aci.system.proc_sys_load_avg_last | System - System CPU Utilization AVG Last |
| System Memory Free Last | cisco.aci.system.proc_sys_mem_free_last | System - Memory Free Last |
| System Memory Total Last | cisco.aci.system.proc_sys_mem_total_last | System - Memory Total Last |
| System Memory Used Last | cisco.aci.system.proc_sys_mem_used_last | System - Memory Used Last |
| System Memory Used % Last | cisco.aci.system.proc_sys_mem_used_perc_last | System - Memory Used % Last |
| System Uptime | cisco.aci.system.system_uptime | System - Uptime |
| IPv4 Addresses | cisco.aci.system.v4_addresses | Leaf Layer3 v4/32 total entries usage statistics - IPv4 Addresses = (Cumulative - Baseline) |
| Total v4 Endpoints Capacity | cisco.aci.system.v4_addresses_max | Leaf Layer3 total entries usage capacity - Total v4 Endpoints capacity current value |
| IPv4 Addresses Usage | cisco.aci.system.v4_addresses_perc | Leaf Layer3 v4/32 total entries usage statistics, Leaf Layer3 total entries usage capacity - IPv4 Addresses Usage = (Cumulative - Baseline) / Capacity |
| Total v4 32 Endpoints Baseline | cisco.aci.system.v4_ep_base | Leaf Layer3 v4/32 total entries usage statistics - Total v4 32 Endpoints Baseline |
| Total v4 32 Endpoints Cumulative | cisco.aci.system.v4_ep_cum | Leaf Layer3 v4/32 total entries usage statistics - Total v4 32 Endpoints Cumulative |
| Total Vlan Entries Baseline | cisco.aci.system.vlan_usage_total_base | Leaf Vlan entries usage statistics - Total vlan entries Baseline |
| Total Vlan Entries Cumulative | cisco.aci.system.vlan_usage_total_cum | Leaf Vlan entries usage statistics - Total Vlan Entries Cumulative |
| Vlans | cisco.aci.system.vlan_vlans | Leaf Vlan entries usage statistics - Vlans = (Cumulative - Baseline) |
| Vlan Entries Capacity | cisco.aci.system.vlan_vlans_max | Leaf Vlan entries usage statistics - Vlan Entries Capacity |
| Vlans Usage | cisco.aci.system.vlan_vlans_perc | Leaf Vlan entries usage statistics - Vlans Usage = (Cumulative - Baseline) / Capacity |
fabric-if-stats
| Metric name | Metric key | Description |
|---|---|---|
| Egress Bytes Cumulative | cisco.aci.l1_phys_if.eqpt_egr_total_hist_5min.bytes_cum.count | Physical Interface - Egress Bytes Cumulative |
| Egress Bytes Rate | cisco.aci.l1_phys_if.eqpt_egr_total_hist_5min.bytes_rate | Physical Interface - Egress Bytes Rate |
| Egress Packets rate | cisco.aci.l1_phys_if.eqpt_egr_total_hist_5min.pkts_rate | Physical Interface - Egress Packets rate |
| Egress Link Utilization | cisco.aci.l1_phys_if.eqpt_egr_total_hist_5min.util_avg | Physical Interface - Egress Link Utilization |
| Ingress Bytes Cumulative | cisco.aci.l1_phys_if.eqpt_ingr_total_hist_5min.bytes_cum.count | Physical Interface - Ingress Bytes Cumulative |
| Ingress Bytes rate | cisco.aci.l1_phys_if.eqpt_ingr_total_hist_5min.bytes_rate | Physical Interface - Ingress Bytes Rate |
| Ingress Packets rate | cisco.aci.l1_phys_if.eqpt_ingr_total_hist_5min.pkts_rate | Physical Interface - Ingress Packets rate |
| Ingress Link Utilization | cisco.aci.l1_phys_if.eqpt_ingr_total_hist_5min.util_avg | Physical Interface - Ingress Link Utilization |
| Egress Bytes Cumulative | cisco.aci.mgmt_if.eqpt_egr_total_hist_5min.bytes_cum.count | Management Interface - Egress Bytes Cumulative |
| Egress Bytes Rate | cisco.aci.mgmt_if.eqpt_egr_total_hist_5min.bytes_rate | Management Interface - Egress Bytes Rate |
| Egress Packets rate | cisco.aci.mgmt_if.eqpt_egr_total_hist_5min.pkts_rate | Management Interface - Egress Packets rate |
| Egress Link Utilization | cisco.aci.mgmt_if.eqpt_egr_total_hist_5min.util_avg | Management Interface - Egress Link Utilization |
| Ingress Bytes Cumulative | cisco.aci.mgmt_if.eqpt_ingr_total_hist_5min.bytes_cum.count | Management Interface - Ingress Bytes Cumulative |
| Ingress Bytes Rate | cisco.aci.mgmt_if.eqpt_ingr_total_hist_5min.bytes_rate | Management Interface - Ingress Bytes Rate |
| Ingress Packets rate | cisco.aci.mgmt_if.eqpt_ingr_total_hist_5min.pkts_rate | Management Interface - Ingress Packets rate |
| Ingress Link Utilization | cisco.aci.mgmt_if.eqpt_ingr_total_hist_5min.util_avg | Management Interface - Ingress Link Utilization |