Trace Google Cloud Functions with OpenTelemetry JavaScript
- Latest Dynatrace
- How-to guide
- 8-min read
This guide shows how to instrument Google Cloud Functions with OpenTelemetry JS and export the traces to Dynatrace. To learn more about how Dynatrace works with OpenTelemetry, see OpenTelemetry and Dynatrace.
Prerequisites
The following prerequisites and limitations apply:
- Dynatrace version 1.222+
- W3C Trace Context is enabled
- Go to Settings > Preferences > OneAgent features.
- Turn on Send W3C Trace Context HTTP headers.
Instrument Google Cloud Functions
Dynatrace uses OpenTelemetry Trace Ingest to provide end-to-end visibility to your Google Cloud Functions.
To instrument your Google Cloud Functions

Add OpenTelemetry dependencies

Set up OpenTelemetry

Instrument the function entry point

Instrument outgoing requests
Add OpenTelemetry dependencies
Add the following required OpenTelemetry dependencies to package.json file (your version numbers may vary):
"dependencies": {"@opentelemetry/api": "^1.0.4","@opentelemetry/core": "^1.0.1","@opentelemetry/exporter-trace-otlp-proto": "^0.27.0","@opentelemetry/instrumentation": "^0.27.0","@opentelemetry/instrumentation-http": "^0.27.0","@opentelemetry/sdk-trace-node": "^1.0.1","@opentelemetry/semantic-conventions": "^1.0.1"}
Set up OpenTelemetry
To make sure traces are collected, linked, and exported to Dynatrace, you need to set up and configure OpenTelemetry accordingly. For this, the Dynatrace endpoint and an authentication token are required.
To determine the endpoint
- Open Dynatrace.
- Check the address line of your browser. The URL will match one of the following patterns:
- Dynatrace SaaS:
https://{your-environment-id}.live.dynatrace.com/... - Dynatrace Managed:
https://{your-domain}/e/{your-environment-id}/...
- Dynatrace SaaS:
- Replace the
...part withapi/v2/otlpto get the URL you will need to configure the OpenTelemetry exporter.- Dynatrace SaaS:
https://{your-environment-id}.live.dynatrace.com/api/v2/otlp - Dynatrace Managed:
https://{your-domain}/e/{your-environment-id}/api/v2/otlp
- Dynatrace SaaS:
To create an authentication token
- Go to Access Tokens and select Generate new token.
- Provide a Token name.
- In the Search scopes box, search for
Ingest OpenTelemetry tracesand select the checkbox. - Select Generate token.
- Select Copy to copy the token to your clipboard.
- Save the token in a safe place; you can't display it again, and you will need it to configure the OpenTelemetry exporter.
Here is how to setup the OpenTelemetry tracing pipeline:
const { NodeTracerProvider } = require('@opentelemetry/sdk-trace-node');const { W3CTraceContextPropagator, AlwaysOnSampler } = require('@opentelemetry/core');const { registerInstrumentations } = require('@opentelemetry/instrumentation');const { HttpInstrumentation } = require('@opentelemetry/instrumentation-http');const { SemanticResourceAttributes } = require('@opentelemetry/semantic-conventions');const { OTLPTraceExporter } = require("@opentelemetry/exporter-trace-otlp-proto");const { BatchSpanProcessor } = require("@opentelemetry/sdk-trace-base");const { Resource } = require("@opentelemetry/resources");const { diag, DiagConsoleLogger, DiagLogLevel } = require("@opentelemetry/api");diag.setLogger(new DiagConsoleLogger(), DiagLogLevel.ALL);function setupOtel(functionName) {// create tracer providerconst provider = new NodeTracerProvider({resource: new Resource({[SemanticResourceAttributes.SERVICE_NAME]: functionName,}),sampler: new AlwaysOnSampler()});// add proto exporterconst exporter = new OTLPTraceExporter();provider.addSpanProcessor(new BatchSpanProcessor(exporter));// register globallyprovider.register({propagator: new W3CTraceContextPropagator()});// add http automatic instrumentationregisterInstrumentations({instrumentations: [new HttpInstrumentation()],});return provider;}
To configure the exporter to your tenant add, the following environment variables when deploying your Google Cloud function:
OTEL_EXPORTER_OTLP_ENDPOINT: set it to the previously determined endpointOTEL_EXPORTER_OTLP_HEADERS: set it toAuthorization=Api-Token <TOKEN>, where<TOKEN>is the previously created authentication token.
Instrument the function entry point
To instrument invocations to a Google Cloud Function with OpenTelemetry, there are basically two things to do:
- Create a span around the entry point of the function to trace invocations.
- Extract and link the parent span from the propagated context (learn more about W3C Trace Context).
For certain libraries OpenTelemetry JS already provides instrumentations that you can use to take care of these things.
The following section shows how to instrument an HTTP (Trigger: HTTP) Google Cloud Function.
Instrument an HTTP Google Cloud Function
The entry point of a newly created HTTP Google Cloud Function looks like this:
/*** Responds to any HTTP request.** @param {!express:Request} req HTTP request context.* @param {!express:Response} res HTTP response context.*/exports.helloWorld = (req, res) => {let message = req.query.message || req.body.message || 'Hello World!';res.status(200).send(message);};
OpenTelemetry JS already provides an instrumentation for this. In order to make sure that an incoming HTTP request is instrumented and spans are captured, a few code code snippets must be added to the function's code.
Add this as your first require statement:
const { trace, context } = require("@opentelemetry/api");
Then add this helper function, which calls the setupOtel function we defined above and applies a user-defined name (funcName) to the automatically created span.
function instrumentHandler(handler, funcName) {setupOtel(funcName);return (req, res) => {const span = trace.getSpan(context.active());if (span != null) {span.updateName(funcName);}handler(req, res);};}
Next, we move the function's actual "business" logic into the myHandler function.
async function myHandler(req, res) {let message = req.query.message || req.body.message || 'Hello World!';res.status(200).send(message);};
Finally, we make sure to set the now instrumented myHandler function as the entry point and require the http(s) modules.
Without requiring the http(s) modules, no spans will be created and the function's trace will not show up in Dynatrace.
exports.helloWorld = instrumentHandler(myHandler, "helloWorld");// make sure the http(s) library is patched before the first callrequire("http");require("https");
Instrument outgoing requests
To achieve end-to-end tracing, it is important that outgoing requests are also instrumented.
The following section shows how to instrument outgoing HTTP(S) requests.
Instrument outgoing HTTP requests
OpenTelemetry JS provides an instrumentation for tracing outgoing HTTP calls (which we already used in the code snippets above for tracing the incoming HTTP call).
The following helper function httpGet wraps outgoing HTTP(S) calls in a Promise object so that the result of the call can be awaited in the main function.
async function httpGet(url) {return new Promise((resolve, reject) => {const isHttps = url.startsWith("https://");const httpLib = isHttps ? https : http;const request = httpLib.get(url, (res) => {console.log(`${url} status code - ${res.statusCode}`);const responseData = [];res.on("error", (error) => {console.error(`${url} reponse error - ${error}`);reject(error);});res.on("data", (chunk) => {responseData.push(chunk);});res.on("end", () => {resolve({ statusCode: res.statusCode, data: responseData });});});request.on("error", error => {console.error(`${url} request error - ${error}`);reject(error);});request.end();});}
The main function can then perform outgoing HTTP(S) calls, making use of this helper function httpGet, which is automatically instrumented by OpenTelemetry.
async function myHandler(req, res) {await httpGet('https://example.com');await httpGet('http://example.net');let message = req.query.message || req.body.message || 'Hello World!';res.status(200).send(message);};
Putting everything together, here is the full sample code for tracing a Node.js Google Cloud Function that is invoked via HTTP and that performs outgoing HTTP(S) calls.
const { trace, context } = require("@opentelemetry/api");const { NodeTracerProvider } = require('@opentelemetry/sdk-trace-node');const { W3CTraceContextPropagator, AlwaysOnSampler } = require('@opentelemetry/core');const { registerInstrumentations } = require('@opentelemetry/instrumentation');const { HttpInstrumentation } = require('@opentelemetry/instrumentation-http');const { SemanticResourceAttributes } = require('@opentelemetry/semantic-conventions');const { OTLPTraceExporter } = require("@opentelemetry/exporter-trace-otlp-proto");const { BatchSpanProcessor } = require("@opentelemetry/sdk-trace-base");const { Resource } = require("@opentelemetry/resources");const { diag, DiagConsoleLogger, DiagLogLevel } = require("@opentelemetry/api");const http = require("http");const https = require("https");diag.setLogger(new DiagConsoleLogger(), DiagLogLevel.ALL);function setupOtel(functionName) {// create tracer providerconst provider = new NodeTracerProvider({resource: new Resource({[SemanticResourceAttributes.SERVICE_NAME]: functionName,}),sampler: new AlwaysOnSampler()});// add proto exporterconst exporter = new OTLPTraceExporter();provider.addSpanProcessor(new BatchSpanProcessor(exporter));// register globallyprovider.register({propagator: new W3CTraceContextPropagator()});// add http automatic instrumentationregisterInstrumentations({instrumentations: [new HttpInstrumentation()],});return provider;}async function httpGet(url) {return new Promise((resolve, reject) => {const isHttps = url.startsWith("https://");const httpLib = isHttps ? https : http;const request = httpLib.get(url, (res) => {console.log(`${url} status code - ${res.statusCode}`);const responseData = [];res.on("error", (error) => {console.error(`${url} reponse error - ${error}`);reject(error);});res.on("data", (chunk) => {responseData.push(chunk);});res.on("end", () => {resolve({ statusCode: res.statusCode, data: responseData });});});request.on("error", error => {console.error(`${url} request error - ${error}`);reject(error);});request.end();});}// The function's custom logic goes in here.async function myHandler(req, res) {// Perform 2 outgoing HTTP calls.await httpGet('https://example.com');await httpGet('http://example.net');let message = req.query.message || req.body.message || 'Hello World!';res.status(200).send(message);};function instrumentHandler(handler, funcName) {setupOtel(funcName);return (req, res) => {const span = trace.getSpan(context.active());if (span != null) {span.updateName(funcName);}handler(req, res);};}// This is the function'S entrypoint.exports.helloWorld = instrumentHandler(myHandler, "helloWorld");// make sure the http(s) library is patched before the first callrequire("http");require("https");
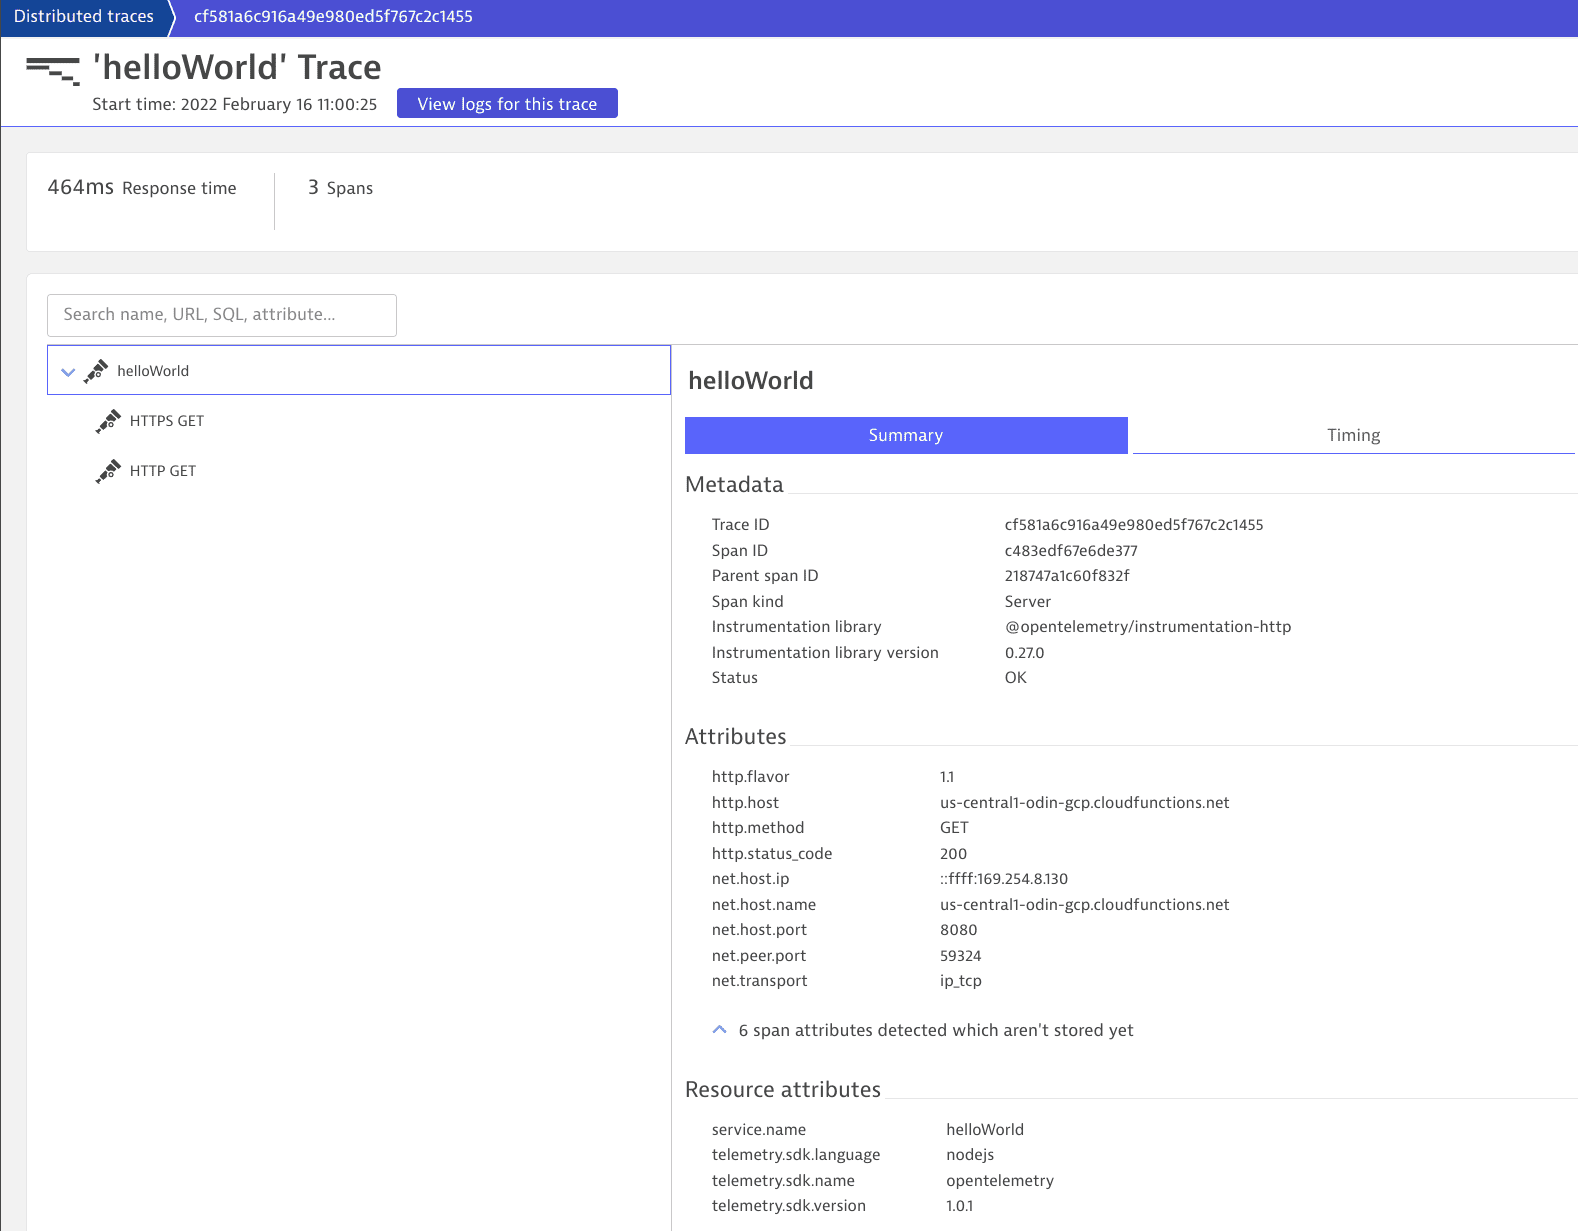
These are the resulting Distributed traces as they show up in Dynatrace.
Verify that the traces are ingested into Dynatrace
A few minutes after invoking your Google Cloud Functions, look for your spans:
- Go to Distributed Tracing (previous Dynatrace) or
 Distributed Traces Classic and select the Ingested traces tab.
 - Your spans will be part of an existing PurePath distributed trace if the root of your call is already being monitored by the OneAgent. If your Google Cloud Function is not getting any traffic, there will be no traces.
(Optional) Configure data capture to meet privacy requirements
While Dynatrace automatically captures all OpenTelemetry attributes, only attribute values specified in the allowlist are stored and displayed in the Dynatrace web UI. This prevents accidental storage of personal data, so you can meet your privacy requirements and control the amount of monitoring data stored.
To view your custom attributes, you need to allow them in the Dynatrace web UI first. To learn how to configure attribute storage and masking, see Attribute redaction.