OpenTelemetry interoperability in Python
- Latest Dynatrace
- How-to guide
- 10-min read
OpenTelemetry interoperability connects the Dynatrace AWS Lambda extension to the OpenTelemetry Python instrumentation to use the instrumentation packages and extensions. You can then monitor technologies like databases or messaging frameworks that aren't supported by Dynatrace AWS Lambda extension out of the box.
Before you start
-
Ensure that OpenTelemetry interoperability is enabled.
-
Verify that the installed OpenTelemetry Python API version is compatible with the Dynatrace AWS Lambda extension. The following tables list the compatible versions:
OneAgent version Maximum OpenTelemetry API version 1.323+ 1.36.x 1.321+ 1.35.x 1.319+ 1.34.x
Older versions
| OneAgent version | Maximum OpenTelemetry API version |
|---|---|
| 1.315+ | 1.32.x |
| 1.313+ | 1.31.x |
| 1.311+ | 1.30.x |
| 1.307+ | 1.29.x |
| 1.303+ | 1.27.x |
| 1.299+ | 1.26.x |
| 1.295+ | 1.25.x |
| 1.291+ | 1.24.x |
| 1.285+ | 1.22.x |
| 1.281+ | 1.21.x |
| 1.277+ | 1.20.x |
| 1.273+ | 1.19.x |
| 1.269+ | 1.18.x |
| 1.265+ | 1.17.x |
| 1.259+ | 1.15.x |
| 1.257+ | 1.14.x |
| 1.253+ | 1.13.x |
| 1.249+ | 1.12.x |
| 1.243+ | 1.11.x |
| 1.239+ | 1.9.x |
| 1.235+ | 1.8.x |
| 1.233+ | 1.7.x |
Use OpenTelemetry Python instrumentation
OpenTelemetry for Python provides several instrumentation packages in their OpenTelemetry Python contributions repository.
Example: Instrument package in a Python Lambda function via instrumentation package
The following code example shows how to instrument PostgreSQL queries in a Python Lambda function by using the aiopg instrumentation package.
import jsonimport aiopgfrom opentelemetry.instrumentation.aiopg import AiopgInstrumentorAiopgInstrumentor().instrument()def lambda_handler(event, context):return {'statusCode': 200,'body': json.dumps(execute_query())}def execute_query():result = []with aiopg.connect(database='my_db') as conn:with conn.cursor() as cur:cur.execute("SELECT 'hello db';")for row in cur:result.append(row)return result
To instrument boto3, the AWS SDK for Python, OpenTelemetry provides the botocore instrumentation package.
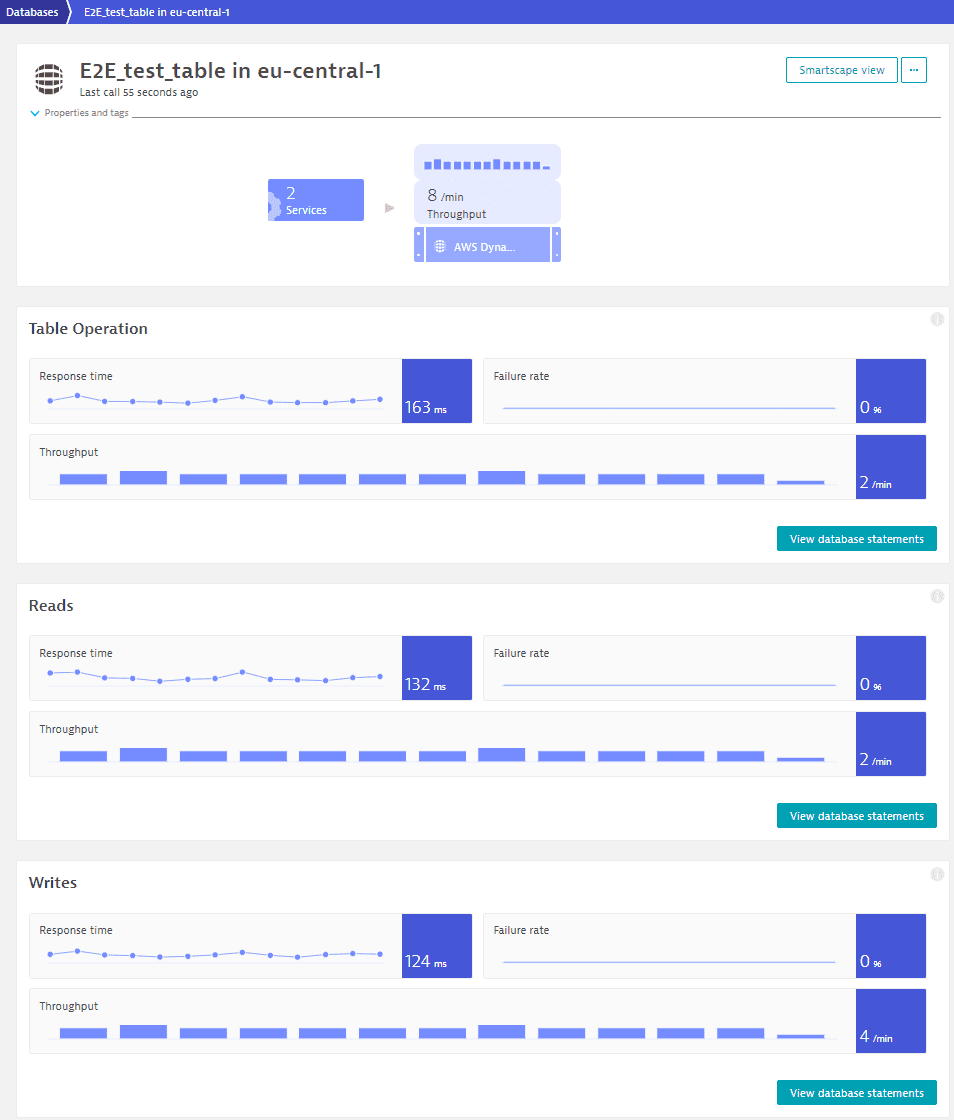
Example: Instrument AWS SDK for Python to monitor a DynamoDB database
The code example below shows how the botocore instrumentation can be used to add observability for calls to a DynamoDB database (Dynatrace version 1.244+).
import boto3import jsonfrom opentelemetry.instrumentation.botocore import BotocoreInstrumentorBotocoreInstrumentor().instrument()dynamodb = boto3.resource('dynamodb')table = dynamodb.Table('MyTable')def lambda_handler(event, handler):result = table.get_item(Key={'mykey': 42})return {"statusCode": 200,"answer": json.dumps(result.get("Item"))}
Use OpenTelemetry Python API
OpenTelemetry Python can be used in an SDK-like approach to trace additional operations that aren't covered by an instrumentation package.
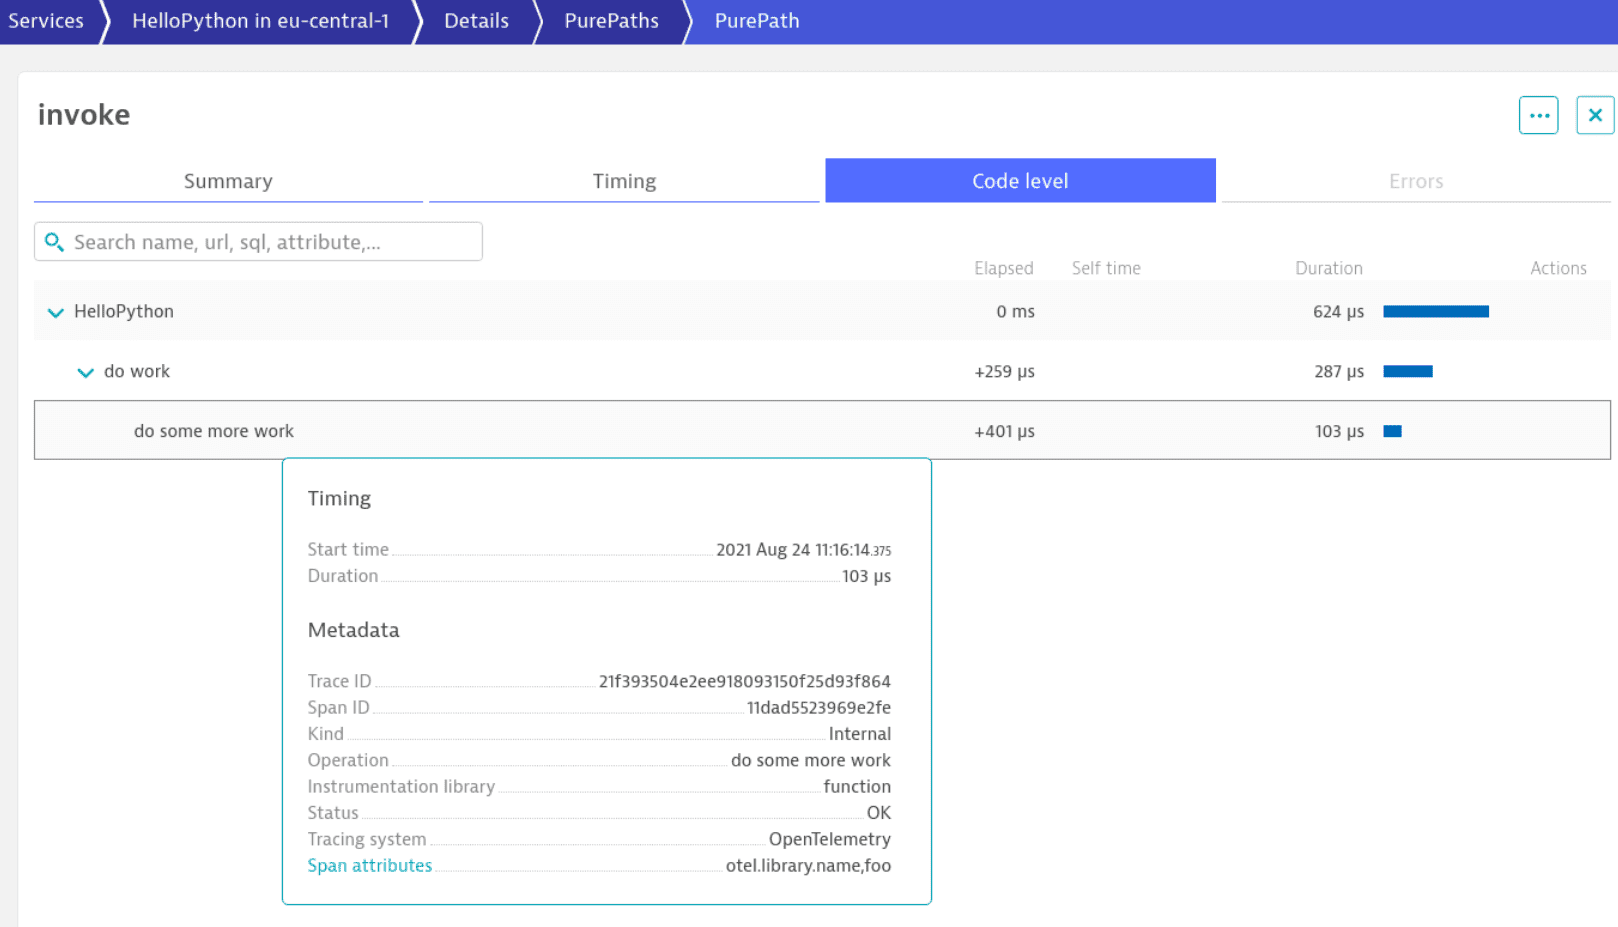
import jsonfrom opentelemetry import tracedef lambda_handler(event, context):tracer = trace.get_tracer(__name__)with tracer.start_as_current_span("do work"):# do workwith tracer.start_as_current_span("do some more work") as span:span.set_attribute("foo", "bar")# do some more workreturn {'statusCode': 200,'body': json.dumps('Hello from Hello world from OpenTelemetry Python!')}
These spans are displayed on the Code level tab.
Trace AWS SQS and SNS messages with Python
OneAgent version 1.253+ for SQS OneAgent version 1.257+ for SNS
You can use open-source instrumentation packages to trace AWS SQS and SNS messages and collect them via the Dynatrace AWS Lambda extension.
 Install the required dependencies
pip install -U "opentelemetry-api>=1.12" "opentelemetry-instrumentation-boto3sqs>=0.34b0"
At this point, opentelemetry-instrumentation-boto3sqs is a separate package from opentelemetry-instrumentation-botocore. The latter instruments all AWS SDK calls, but lacks enhanced support for SQS.
If you install the dependencies into a Lambda function or layer, you can use the -t option to specify a target directory where the installed packages should be copied.
 Send an SQS/SNS message
The boto3 package is available out of the box if the code runs in AWS Lambda, but you can also install it using pip install -U boto3.
This code defining a function named lambda_handler can be used
-
Inside AWS Lambda (we recommend monitoring it with our AWS Lambda layer)
-
Outside AWS Lambda (monitoring is performed with OpenTelemetry and exported to Dynatrace via OTLP/HTTP ingest)
You might want to remove the function parameters and return value.
from opentelemetry.instrumentation.boto3sqs import Boto3SQSInstrumentorBoto3SQSInstrumentor().instrument()import jsonimport boto3from datetime import datetimeQUEUE_URL = "<Your SQS Queue URL>"sqs = boto3.client("sqs")def lambda_handler(event, context):sent = []for i in range(5):res = sqs.send_message(QueueUrl=QUEUE_URL, MessageBody=f"hello #{i} at {datetime.now()}")sent.append(res["MessageId"])return {"statusCode": 200,"body": json.dumps({"produced_messages": sent})}
 Receive an SQS/SNS message
You can trace SQS messages forwarded from
-
An SQS topic
Receiving messages works out of the box when you use an AWS Lambda with an SQS trigger monitored with the Dynatrace AWS Lambda extension. Because a span can have only a single parent, if your Lambda function receives a batch of multiple messages, you need to manually create spans to process every single message if you want to track them separately and have them linked to the sender.
To configure the Dynatrace AWS Lambda extension to allow setting parent spans manually:
-
For the environment variables configuration method, set the
DT_OPEN_TELEMETRY_ALLOW_EXPLICIT_PARENTenvironment variable totrue:DT_OPEN_TELEMETRY_ALLOW_EXPLICIT_PARENT=true -
For the JSON file configuration method, in
dtconfig.json, set the following field totrue:{...other configuration properties..."OpenTelemetry": {"AllowExplicitParent": "true"}}
Then new spans can be created with the parent span extracted from each received SQS message.
Example: Receive messages with AWS Lambda SQS trigger
If you invoke the sender and have deployed the example, it will be invoked automatically by SQS.
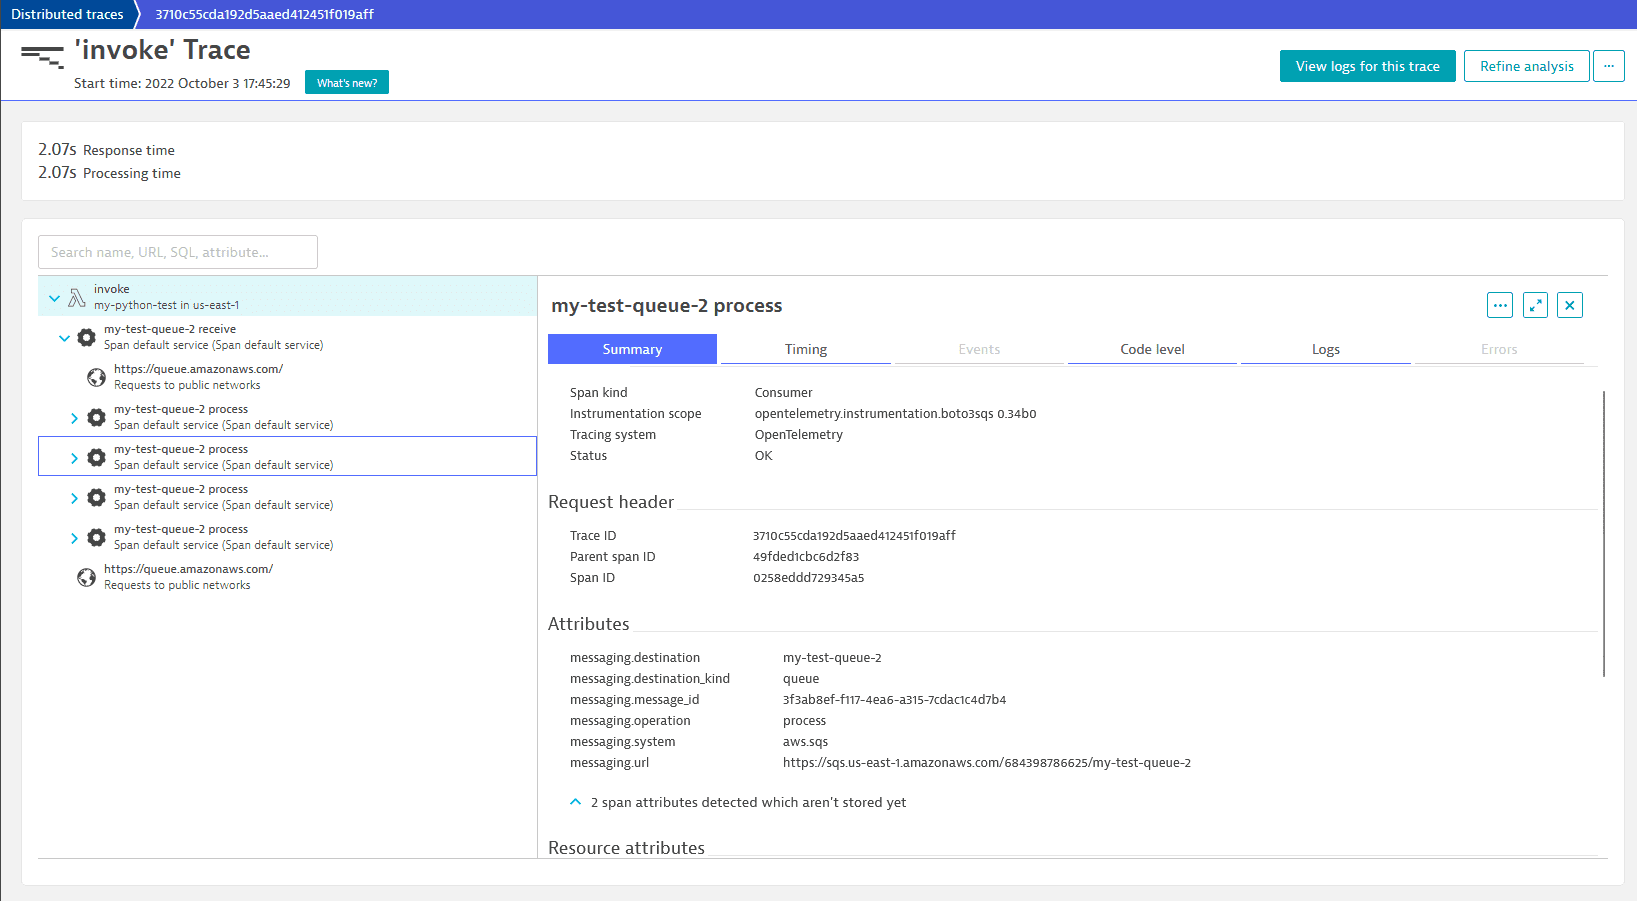
from pprint import pformatimport boto3import jsonfrom opentelemetry import trace, propagatefrom opentelemetry.semconv.trace import SpanAttributes, MessagingOperationValuestracer = trace.get_tracer("lambda-sqs-triggered")def lambda_handler(event, context):recvcount = 0print("Trigger", pformat(event))messages = event.get("Records") or ()# Lambda SQS event uses lowerCamelCase in its attribute namesfor msg in messages:recvcount += 1print("Processing", msg["messageId"])parent = _extract_parent(msg, from_sns_payload=False)with tracer.start_as_current_span("manual-trigger-process", context=parent, kind=trace.SpanKind.CONSUMER, attributes={SpanAttributes.MESSAGING_MESSAGE_ID : msg["messageId"],SpanAttributes.MESSAGING_URL : msg["eventSourceARN"],SpanAttributes.MESSAGING_SYSTEM : msg["eventSource"],SpanAttributes.MESSAGING_OPERATION : MessagingOperationValues.PROCESS.value,}):# ... Here your actual processing would go...passprint("Processed", recvcount, "messages")def _extract_parent(msg, from_sns_payload=False):if from_sns_payload:try:body = json.loads(msg.get("body", "{}"))except json.JSONDecodeError:body = {}carrier = {key: value["Value"] for key, value in body.get("MessageAttributes", {}).items() if "Value" in value}else:carrier = {key: value["stringValue"] for key, value in msg.get("messageAttributes", {}).items() if "stringValue" in value}return propagate.extract(carrier)The resulting path looks as follows:
The invoked Lambda function is a child of one of the messages by which it's triggered. Since there can only be one parent, the other manual-trigger–process spans aren't linked directly to the Lambda invocation in which they are handled. Often, there's more than one Lambda invocation node for a batch of messages. In those cases, AWS distributed the batch over multiple Lambda invocations. This can happen even if the messages are delivered within your configured batch window time and number less than your configured batch size.
Example: Call the SQS receive APIs manually
If you have deployed the example that uses the
receiveAPI in code, you need to invoke it manually and it will attempt to read all messages from the queue.This example uses the boto3sqs instrumentation. If you don't want to use it, you need to uncomment the
MessageAttributeNamesargument in thereceive_messagefunction, otherwise, SQS will omit data required to link the message to its sender from the retrieved data.This code can also be used outside a Lambda function and monitored with OpenTelemetry without the Dynatrace AWS Lambda extension.
from opentelemetry.instrumentation.boto3sqs import Boto3SQSInstrumentorBoto3SQSInstrumentor().instrument()from pprint import pformatimport boto3import jsonfrom opentelemetry import trace, propagatefrom opentelemetry.semconv.trace import SpanAttributes, MessagingOperationValuesQUEUE_URL = '<Your SQS Queue URL>'sqs = boto3.client("sqs")tracer = trace.get_tracer("lambda-receive-function")def lambda_handler(event, context):recvcount = 0while True:msg_receive_result = sqs.receive_message(MaxNumberOfMessages=10,QueueUrl=QUEUE_URL,WaitTimeSeconds=1, # WaitTime of zero would use sampled receive, may return empty even if there is a message# This argument is only required if you do not use the boto3sqs instrumentation:#MessageAttributeNames=list(propagate.get_global_textmap().fields))print("Received", pformat(msg_receive_result))if not msg_receive_result.get('Messages'):breakmessages = msg_receive_result.get("Messages")# receive result uses PascalCase in its attribute namesfor msg in messages:recvcount += 1print("Processing", msg["MessageId"])parent = _extract_parent(msg, from_sns_payload=False)with tracer.start_as_current_span("manual-receive-process", context=parent, kind=trace.SpanKind.CONSUMER, attributes={SpanAttributes.MESSAGING_MESSAGE_ID: msg["MessageId"],SpanAttributes.MESSAGING_URL: QUEUE_URL,SpanAttributes.MESSAGING_SYSTEM: "aws.sqs",SpanAttributes.MESSAGING_OPERATION: MessagingOperationValues.PROCESS.value,}):# ... Here your actual processing would go...print("Delete result", sqs.delete_message(QueueUrl=QUEUE_URL,ReceiptHandle=msg['ReceiptHandle'],))print("Processed", recvcount, "messages")def _extract_parent(msg, from_sns_payload=False):if from_sns_payload:try:body = json.loads(msg.get("Body", "{}"))except json.JSONDecodeError:body = {}carrier = {key: value["Value"] for key, value in body.get("MessageAttributes", {}).items() if "Value" in value}else:carrier = {key: value["StringValue"] for key, value in msg.get("MessageAttributes", {}).items() if "StringValue" in value}return propagate.extract(carrier)Creating the
manual-receive-processspan manually is necessary because the boto3sqs instrumentation doesn't set the sender as a parent for the processing span, but uses OpenTelemetry links, which are currently not supported by Dynatrace. For themanual-receive-processspan linking to work correctly, you need to configure the Dynatrace AWS Lambda extension to allow setting parent spans manually. See the previous example for guidance.Invoking first the code that sends SQS messages, then the manual receive code, deployed as Lambda functions, results in two traces:
-
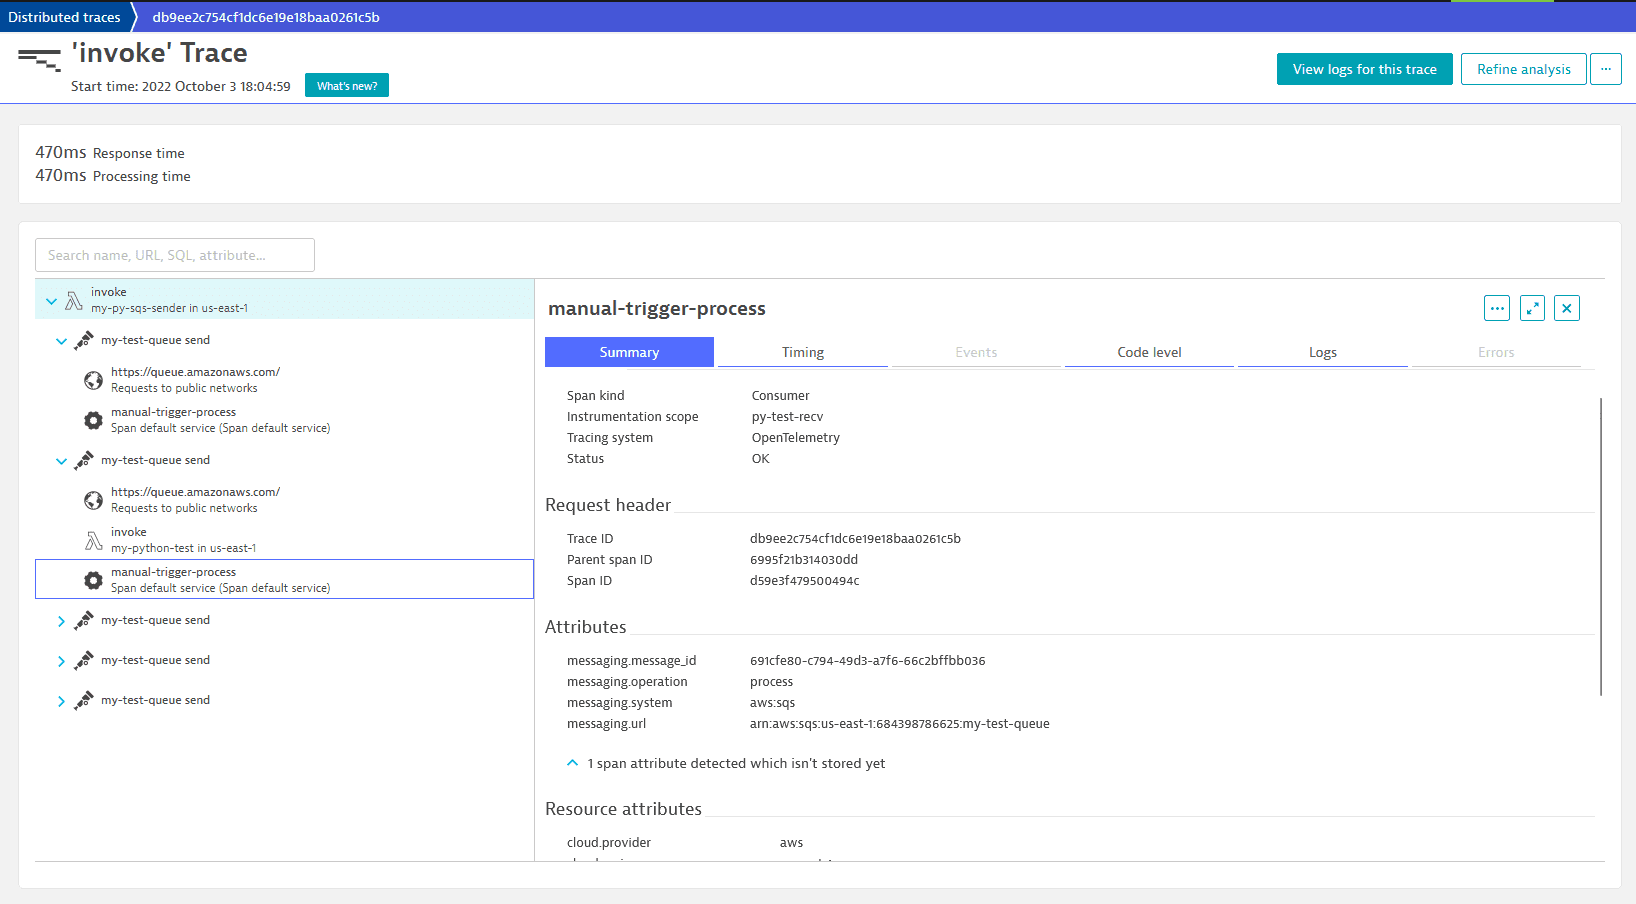
The first trace shows the flow of the message from the sender to the processor:
There are additional
Requests to public networksnodes because the boto3 package uses HTTP requests to send SQS messages, which are captured by Dynatrace HTTP instrumentation.You'll notice that the invocation and receive node of the second Lambda invocation are missing from this trace, even though the
manual-receive-processnodes are there. This is because the Lambda function was triggered independently of the message flow, and just happened to receive the message as part of its handler code. -
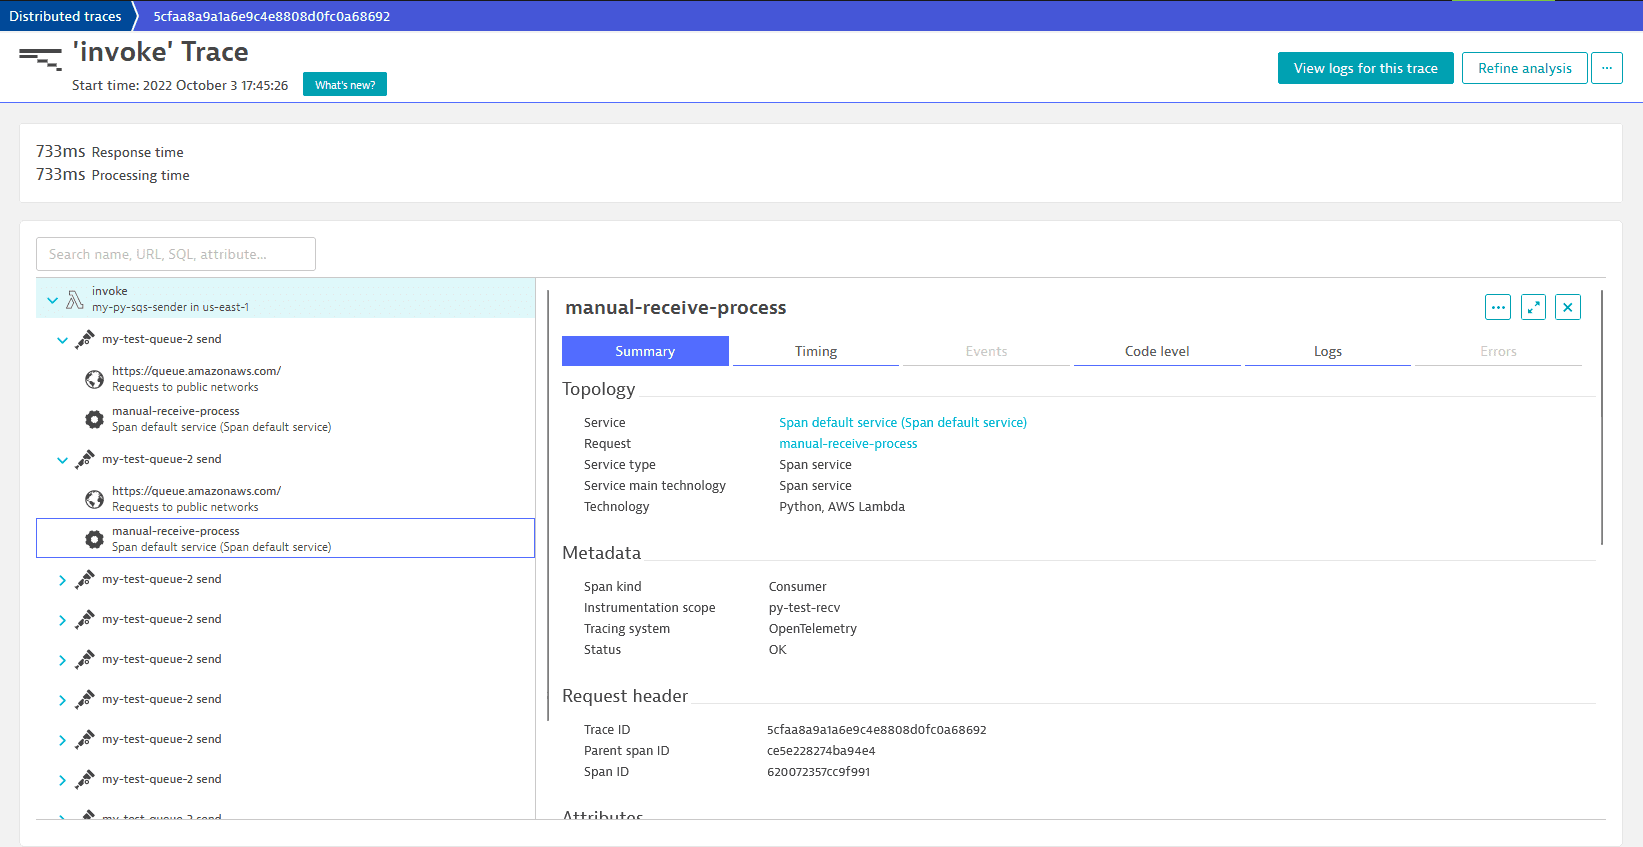
The second trace in Dynatrace shows the Lambda invocation until it's cut in two by setting the explicit parent:
-
-
An SNS topic
For SNS messages that are forwarded to SQS, the message format depends on the raw message delivery configuration on the SNS subscription.
Raw message delivery
Message format
Example
Enabled
The SNS message attributes are converted to SQS message attributes and the parent can be directly extracted from the
MessageAttributesof the SQS message.Disabled
The SNS message and its
MessageAttributesare delivered as a serialized JSON string in the body of the received SQS message. To correctly link the receive span, the parent needs to be extracted from theMessageAttributesof the serialized SNS message.Additional configuration is required for both examples; when calling the
_extract_parentmethod, set the value of thefrom_sns_payloadparameter toTrue.