OneAgent diagnostics
- Latest Dynatrace
- 7-min read
- Published Oct 22, 2020
You can run fully automated OneAgent troubleshooting for Dynatrace SaaS and Managed environments starting with Dynatrace version 1.208.
The workflow enables you to:
- Automatically pinpoint a OneAgent-related issue in highly dynamic environments, at a specific point in time
- Easily collect the diagnostic data for a specific entity, and automatically get potential solutions for detected anomalies
- Quickly resolve common issues on your own, reducing the amount of time spent on diagnosing
- Directly provide Dynatrace Support all the details they need to diagnose the issue
If you don't have access to Dynatrace or you would like to script diagnostic data collection, you can use the oneagentctl command to collect a subset of full diagnostics data right on the host where OneAgent is installed. For more information, see Create support archive.
Requirements
- Dynatrace SaaS environment: Dynatrace version 1.202+
- Dynatrace Managed environment: Dynatrace version 1.208+
- View sensitive request data environment permission
Analyze automatically
This procedure describes the default procedure: Dynatrace collects diagnostics data for a host or process and immediately analyzes it.
If you prefer to collect and review the data before manually submitting it to Dynatrace for analysis, see Collect and review locally.
-
Go to
 Hosts Classic.
 -
Select the host you want to troubleshoot.
-
Run diagnostics on the host or process level.
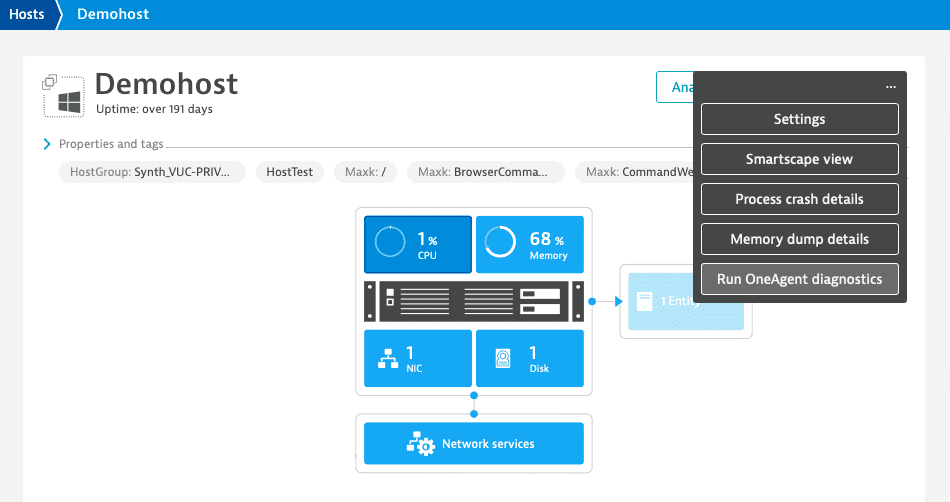
- Host level: on the host page, open the browse menu (…) and select Run OneAgent diagnostics.
- Process level: on the host page, open a process page, and then select Run OneAgent diagnostics from the browse menu (…) on the process page.
- Host level: on the host page, open the browse menu (…) and select Run OneAgent diagnostics.
-
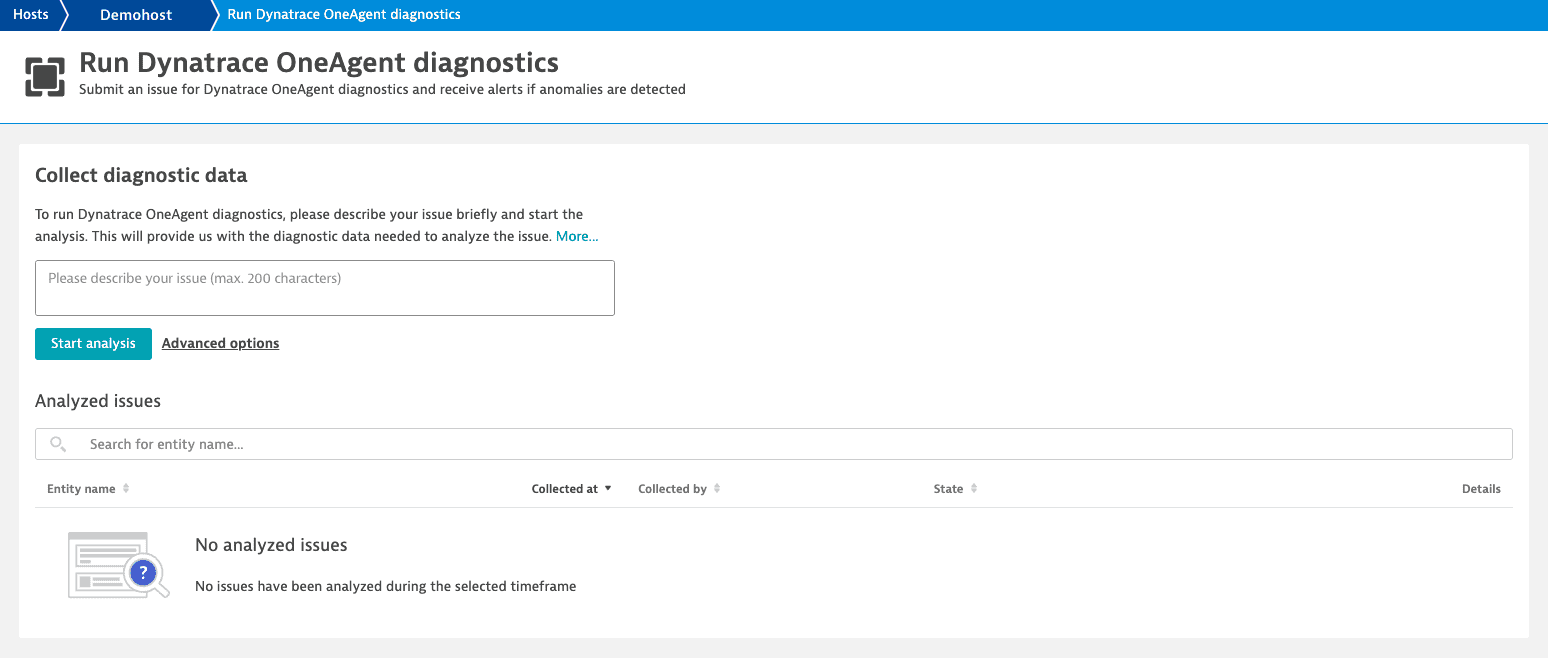
On the Run Dynatrace OneAgent diagnostics page, briefly describe what isn’t working as expected from your point of view.
Example OneAgent diagnostics page
 OneAgent diagnostics: run
 -
Optional By default, 24 hours (1 day) of data is collected for analysis. If you need more data, select the Advanced options link, change the number of days, and select Apply.
-
Select Start analysis.
What happens next
Dynatrace does the following:
- Collects diagnostic data for the last 24 hours (if you didn't change the default) of the affected host or process
- Stores the collected diagnostic data
- Uploads the diagnostic data to an S3 bucket in the AWS region of your environment for further analysis
The State column describes the current phase of the process.
State does not automatically refresh. Select Refresh to check for a state change.
Collecting
Data collection is in progress. While collecting data, you can:
- Refresh the page to update the progress.
- Cancel diagnostic data collection.
Collected
Dynatrace has finished collecting diagnostic data. After collecting data, you can:
- Analyze to submit the collected data to Dynatrace for analysis.
- Download the collected data locally for your inspection.
- Delete the issue, including the collected diagnostic data.
Sending in progress
Diagnostic data is being transferred to Dynatrace for analysis. While sending data, you can:
- Refresh the page to update the progress.
- Download the collected diagnostic data.
- Delete the issue, including the collected diagnostic data.
Sent to Dynatrace cloud
Diagnostic data has been transferred to Dynatrace for analysis.
Analyzing
Dynatrace is now analyzing the diagnostic data.
While analyzing data, you can:
- Refresh the page to update the progress.
- Download the collected diagnostic data.
- Delete the issue, including the collected diagnostic data.
Analyzed
The analysis is done. The number of associated alerts is shown in parentheses.
After an analysis, you can:
- Download the collected diagnostic data.
- Delete the issue, including the collected diagnostic data.
Delete in progress
The diagnostic data is being deleted. While deleting data, you can:
- Refresh the page to update the progress.
Deleted
The diagnostic data has been deleted. Dynatrace keeps only a small set of information about who, when, where, and why the diagnostic data was collected.
Canceled
The diagnostics process was canceled manually before it was finished.
Review the Dynatrace analysis
When the analysis is complete, Dynatrace sends the results back to your environment. If a potential solution is identified, Dynatrace lists it in the Alerts section.
Example
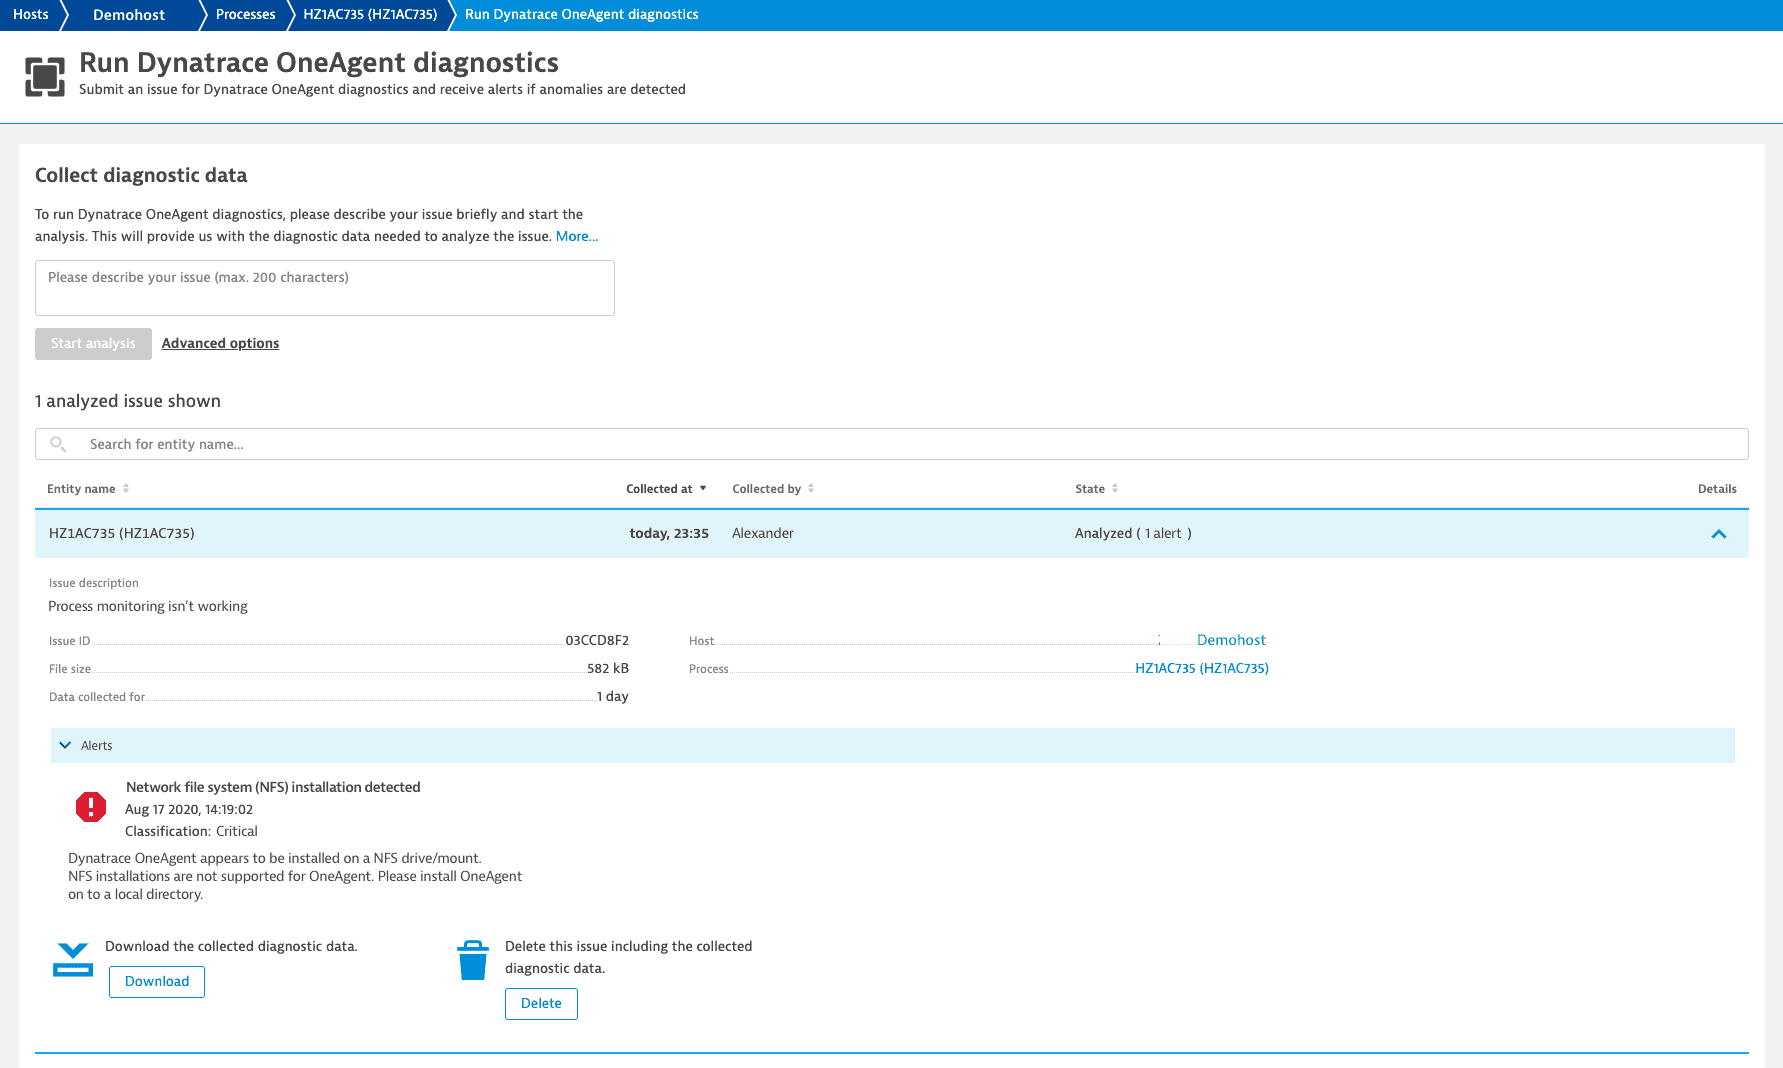
In this example, you can see that the fully automated OneAgent troubleshooting workflow has detected that this OneAgent was mounted on a network file system (NFS), which isn’t supported. Instructions for resolving the issue are included.
Collect and review locally
This procedure describes how to collect diagnostics data for a host or process locally. Use this option if you prefer to collect and review the data before manually submitting it to Dynatrace for analysis.
If you instead want to collect data and submit it to Dynatrace automatically for analysis, see Analyze automatically.
-
Go to
 Hosts Classic.
 -
Select the host you want to troubleshoot.
-
Run diagnostics on the host or process level.
- Host level: on the host page, open the browse menu (…) and select Run OneAgent diagnostics.
Example
- Process level: on the host page, open a process page, and then select Run OneAgent diagnostics from the browse menu (…) on the process page.
- Host level: on the host page, open the browse menu (…) and select Run OneAgent diagnostics.
-
On the Run Dynatrace OneAgent diagnostics page, briefly describe what isn’t working as expected from your point of view.
Example OneAgent diagnostics page
 OneAgent diagnostics: run
 -
Select the Advanced options link.
-
Select and store locally.
- While you are here, you can also change the number of days of data to collect (default =
1 day).
- While you are here, you can also change the number of days of data to collect (default =
-
Select Apply.
-
Select Start collection to collect diagnostic data and store it locally.
What happens next
Dynatrace now:
- Collects diagnostic data for the last 24 hours (if you didn't change the default) of the affected host or process
- Stores the collected diagnostic data
The State column describes the current phase of the process.
State does not automatically refresh. Select Refresh to check for a state change.
Collecting
Data collection is in progress. While collecting data, you can:
- Refresh the page to update the progress.
- Cancel diagnostic data collection.
Collected
Dynatrace has finished collecting diagnostic data. After collecting data, you can:
- Analyze to submit the collected data to Dynatrace for analysis.
- Download the collected data locally for your inspection.
- Delete the issue, including the collected diagnostic data.
What to do with the collected data
Now that the data is collected, you can:
- Download the collected data.
- You can review the data. See Contents of diagnostic data for an overview of what's in the download.
- You can add the data to your support ticket.
- Analyze the data.
- Delete the issue, including the collected diagnostic data.
OneAgent troubleshooting in Dynatrace Managed air-gapped environments
In a Dynatrace Managed air-gapped environment:
- Use the Store locally option under Advanced options as described above.
- After diagnostic data is collected, you can add the data to your support ticket.
- Dynatrace can then fetch the diagnostic data from your support ticket, analyze it, and provide automated feedback to Dynatrace Support about detected anomalies.
Stringent data privacy protections are enforced and logged throughout this process.
OneAgent diagnostics overview
For an overview of all OneAgent troubleshooting runs in your environment
- Go to
 Hosts Classic.
 - Open the browse (…) menu and select OneAgent diagnostics overview.
The Dynatrace OneAgent diagnostics overview page lists all OneAgent diagnostics activity in your environment. Expand any entry to see details. If the data has not been deleted (all diagnostic data is deleted automatically after 30 days), you can download it or delete it.
Contents of diagnostic data
All the collected diagnostic data is compressed into a SupportArchive<ID number> ZIP file that includes the following folders and files:
| Folder or file | Description |
|---|---|
| Contains a snapshot of the topology information of the host entity including any relationships to other hosts. |
| Contains a snapshot of the topology information of all involved process groups, process group instances, services, and service instances. |
| Contains information about which OneAgent code modules are connected to Dynatrace. |
| Contains information about who, when, where, and why the diagnostic data was collected. |
| Contains information about the monitoring state of processes and related problems. |
| Contains the local configuration of the OneAgent installed on the host or process where you’ve run the troubleshooting, as well as the OneAgent-related log files. |
| Contains information about the process group detection, auto-injection problems, and extension configuration. |
Data privacy
To comply with regional data protection and privacy regulations, Dynatrace does the following:
-
Masks some personal data before storing a support archive in Cassandra and uploading it to an AWS S3 bucket. For example, IBANs and URI credentials are replaced with
<masked>. However, some personal data may not be masked. -
Writes audit log messages when support archives are created, analyzed, accessed, and deleted to ensure transparency in the use of support archives.
-
Provides access to OneAgent support archives only to users that have the View sensitive request data environment permission.
-
Automatically deletes all diagnostic data 30 days after its collection.
This applies to the data in your Dynatrace environment. You can also choose to delete collected diagnostic data earlier.
For related details on OneAgent diagnostics, check the following pages:
Troubleshooting
Status: Collecting of the diagnostic data wasn’t possible within 20 minutes.
- If Dynatrace cannot collect diagnostic data within 20 minutes, it automatically tries again.
- If the retry fails as well, we suggest that you contact a Dynatrace product expert via live chat.
State appears to be frozen.
State does not automatically refresh. Select Refresh to check for a state change.
FAQ
Can I access the S3 directly or use my own S3?
No, you cannot access the S3 directly or use your own.
OneAgent diagnostics uploads the diagnostic data to the Dynatrace S3 bucket that is configured for the environment/cluster by Dynatrace. The S3 bucket used depends on the location of the environment/cluster.
