Info events
This page provides information about supported informational events and the logic behind raising them.
Annotation
CUSTOM_ANNOTATION
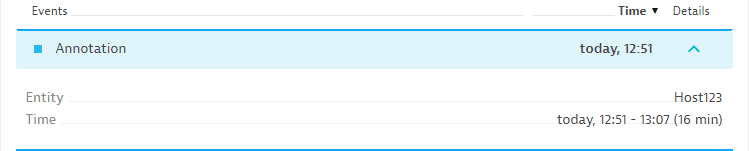
Annotation events can be sent to Dynatrace by third-party tools to highlight interesting periods in time. There are multiple channels that can be used to automatically report annotations into Dynatrace, including the Events API v2 and monitoring plugins.
An example of a custom annotation event is shown below.
Applicable Dynatrace entities
All Dynatrace entities apply to this event.
Deployment
CUSTOM_DEPLOYMENT
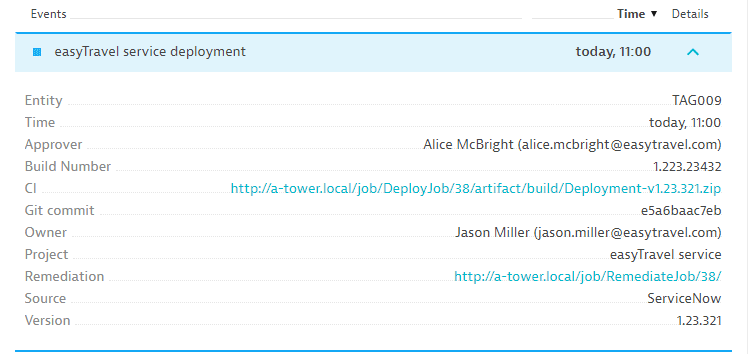
Deployment events can be sent to Dynatrace by third-party tools to report software deployments along with important business-process related metadata, such as the authorizer, product owner, and version details. There are multiple channels that can be used to automatically report deployment events into Dynatrace, including the Dynatrace REST API and monitoring plugins.
An example of a custom deployment event is shown below.
Applicable Dynatrace entities
All Dynatrace entities apply to this event.
Info
CUSTOM_INFO
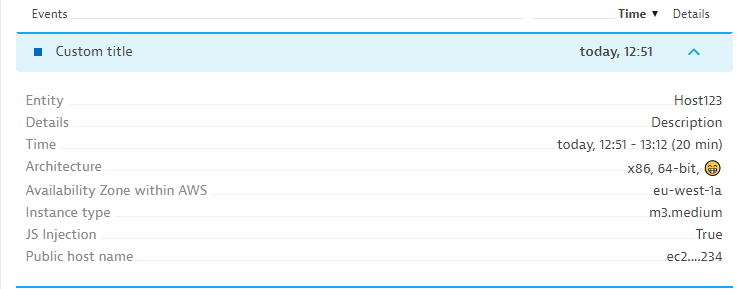
Info events can be sent to Dynatrace by third-party tools to report general information about important events. There are multiple channels that can be used to automatically report information events into Dynatrace, including the Dynatrace REST API and monitoring plugins.
An example of a custom info event is shown below.
Applicable Dynatrace entities
All Dynatrace entities apply to this event.
Log pattern matched on host or process
LOG_MATCHED
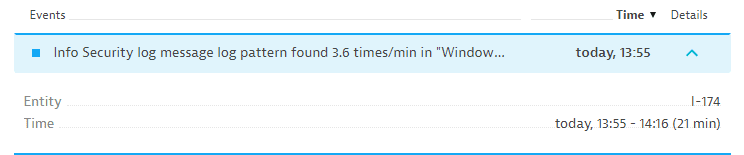
You can define custom log pattern matching rules that apply to log files on both the host level and the process level. If a user-defined threshold of matching patterns per minute is breached, a log info event will be raised and displayed either on the host or the process level.
An example of a log pattern matched on host or process event is shown below.
Applicable Dynatrace entities
All Dynatrace entities apply to this event.
Elastic load balancer has a failure rate
ELASTIC_LOAD_BALANCER_HIGH_FAILURE_RATE
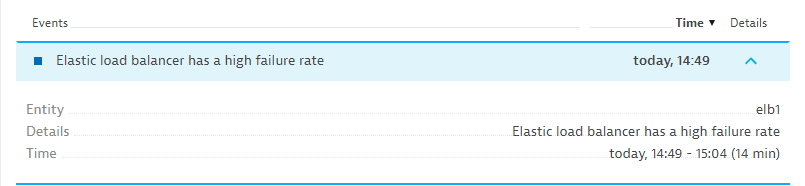
Dynatrace automatically reports the number of failed connection attempts to an AWS load balancer. By default, Dynatrace opens an alert if the number of failed connection attempts is higher than 10 per minute in at least 3 of 5 one-minute observation intervals.
An example of an Elastic load balancer has a failure rate event is shown below.
Applicable Dynatrace entities
The following Dynatrace entities apply to this event:
- Elastic load balancer
Elastic load balancer has a high unhealthy host rate
ELASTIC_LOAD_BALANCER_HIGH_UNHEALTHY_HOST_RATE
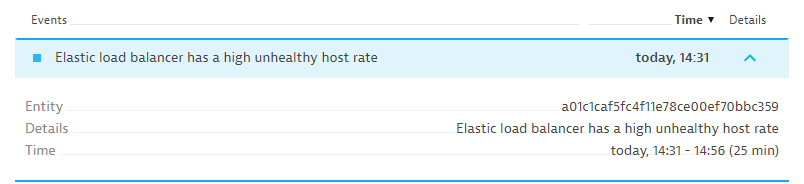
Dynatrace automatically opens an info event when a high rate of unhealthy hosts is detected within an AWS load balancer.
See how the event is shown within the events section of the affected AWS load balancer:
Applicable Dynatrace entities
The following Dynatrace entities apply to this event:
- Elastic load balancer
JavaScript framework changes
APPLICATION_JS_FRAMEWORK_DETECTED
Real User Monitoring keeps track of all JavaScript frameworks that are used in your applications. A JavaScript framework change event is opened if either a new JavaScript framework is detected or a JavaScript framework is removed.
An example of a JavaScript framework changes event is shown below.

Applicable Dynatrace entities
The following Dynatrace entities apply to this event:
- Application
Marked for termination
MARKED_FOR_TERMINATION
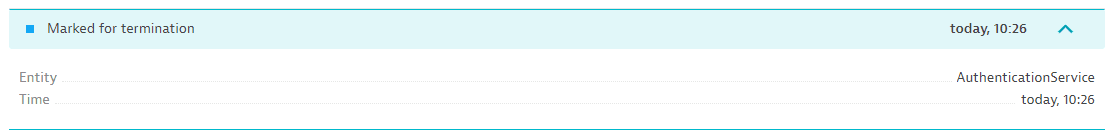
By default, Dynatrace raises a problem when a monitored entity becomes unavailable. However, in some instances, you may need to bring an entity down purposely (for example, disabling monitoring of a host during a maintenance window). To avoid unnecessary notifications and problem alerts, assign this event to any entity you're about to shut down. For the next 60 minutes, it will prevent Dynatrace from raising a problem when the entity becomes unavailable.
The Alert on graceful host shutdown option overrules the MARKED_FOR_TERMINATION event and raises an alert nevertheless.
Applicable Dynatrace entities
The following Dynatrace entities apply to this event:
- Hosts
Out of memory kill
An "Out of memory kill" event indicates that OOM Killer was triggered to kill the container because it exceeded the container's memory limit.
- It may indicate that you need to change the memory limit on the container, or that an unexpected amount of memory was being used on the container.
- This event does not raise an alert, but you can configure a custom event for alerting based on the
Out of memory killsmetric.
Applicable Dynatrace entities
The following Dynatrace entities apply to this event:
- Container