Create log alerts for a log event or summary of log data
One of the uses of anomaly detection is to alert users of abnormal behavior. For example, using the makeTimeseries DQL command, you can set up an anomaly detector to analyze or alert on various data such as business events or logs. In this case, the anomaly detector queries the raw data every minute. However, if you have infrequent log entries, or if you're interested in a specific log event, you can use alternative solutions that are more cost- and time-effective.
In this tutorial, you will learn how to
- Create a log alert for a specific log event.
- Create a log alert for a specific time period.
Prerequisites
- Access to a Dynatrace SaaS environment
- Installed Davis Anomaly Detection
- Configured Anomaly Detection app permissions
Raise a log alert based on a specific log event
If you want to monitor a specific log event and be notified when it occurs, you can create an alert based on a filtered query to avoid processing the entire raw log.
Let's assume you want to set an alert that notifies you every time NGINX logs containing the Connection refused error is captured. In addition, you want to extract the following information from the log content to get a quick overview of the event:
- Error number
- Client IP address
http_requestline that results in an error.
To save time and effort, you can set a log alert instead of an anomaly detection alert. In this case, you don't have to make a timeseries. Instead, you just need to create a filtered query that will show only the specific event, for example:
fetch logs| filter matchesValue(process.technology, "nginx")| filter matchesValue(loglevel, "ERROR")| filter matchesPhrase(content, "Connection refused")| fields timestamp,content, process.technology| parse content, "LD '[error] ' INT:error_number '#' INT LD 'Connection refused' LD 'client:' SPACE? IPADDR:client_ip LD 'request:' SPACE? DQS:http_request"| sort timestamp desc
Creating a log alert doesn't require you to have access to Davis Anomaly Detection  . You only need Logs
  . To learn more about creating alerts through Logs
  , see Set up a log alert.
Raise a log alert on a summary of log data over a time period
If you want to get an overview of the log data over a specific period, for example, if the data has infrequent log entries, you can use one of the approaches:
- Create a dedicated log metric.
- Use DQL to create a log alert on a summary of log data.
Create a dedicated log metric
Creating a dedicated log metric allows you to reuse the log metric across apps like Dashboards  and Notebooks
  and create alerts without incurring additional costs.
To learn how to create log metrics, see Log metrics.
Suppose you created a log metric, log.conn_refused_count, which collects every log entry with a Connection refused error.

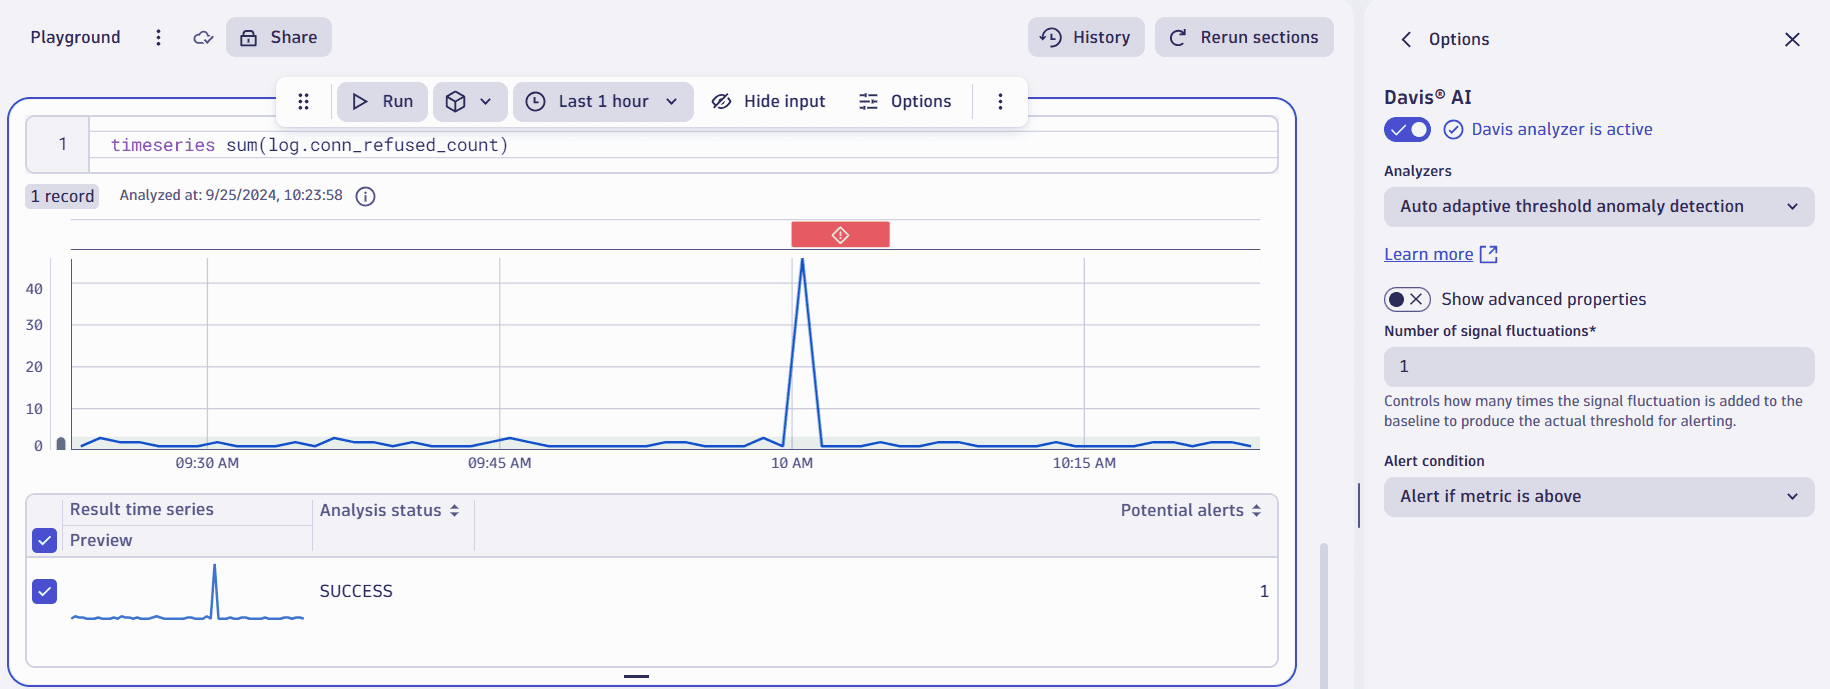
Since the data in the log metric contains only the necessary logs, you can create the alert using the regular timeseries DQL command and the name of your log metric as a parameter.
Create a log alert on a summary of log data using DQL
Using DQL allows you to create complex queries and apply multiple filters and sorting conditions. This approach gives you more control on what data you want to capture and what kind of information you want to see in your alerts.
To create a log alert on a summary of log data
- Open Notebooks
 .
. - Select Notebook > New section > DQL to create a new section.
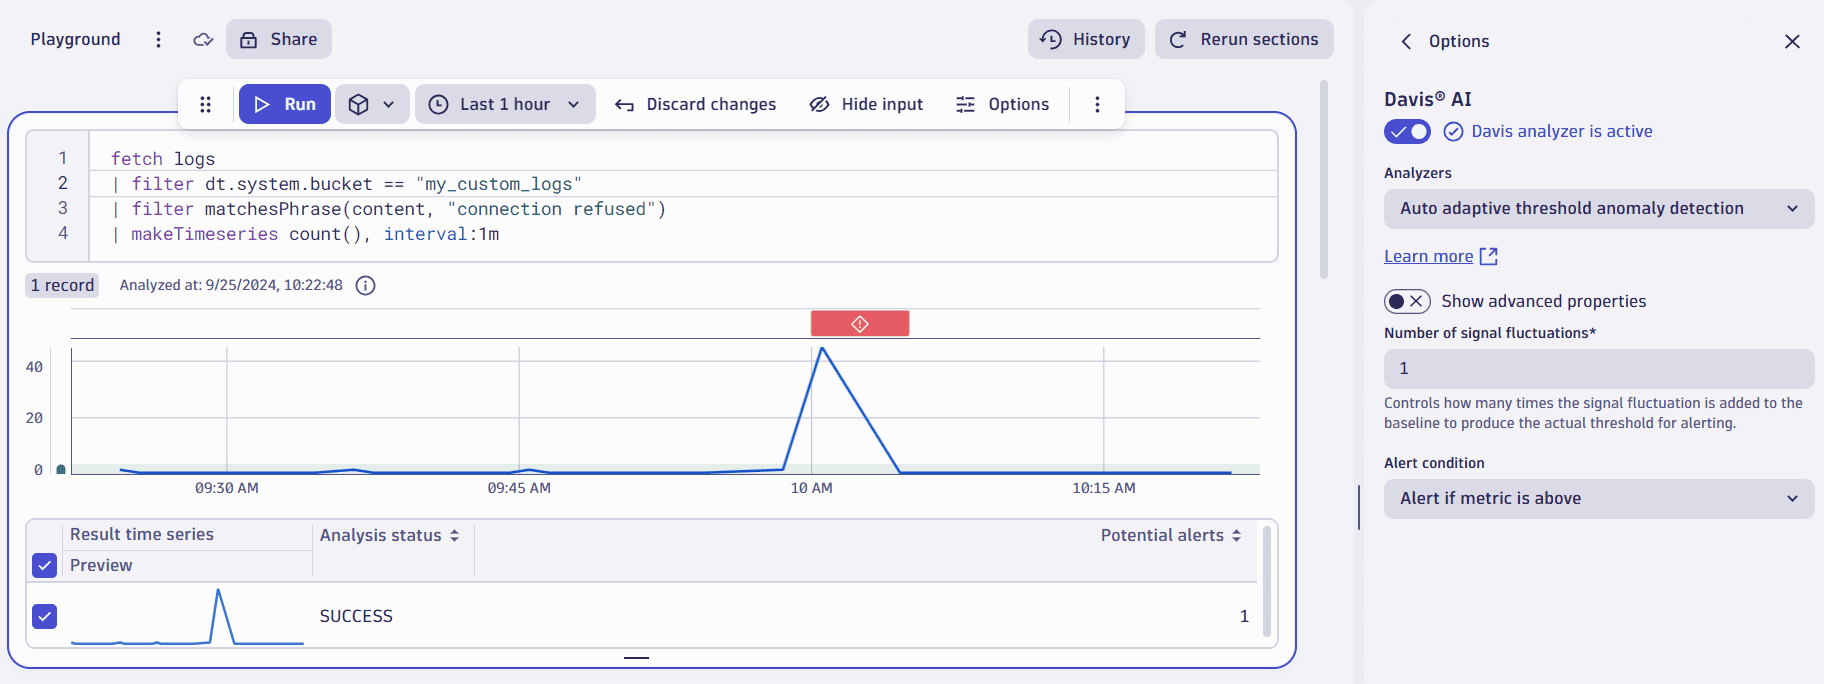
- Fill out the field similar to the example below:
fetch logs| filter dt.system.bucket == "{your bucket name}"| filter matchesPhrase(content, "Connection refused")| makeTimeseries count(), interval:1m
- optional Select Run to test and ensure that your command works properly.
- Select Options and select Davis® AI.
- Turn on the Davis analyzer if it's not active.
- Select the required analyzer and configure it. For details, see Anomaly detection configuration.
- Select Run analysis.
- Once you're satisfied with the result, select
>
Open with and select Davis Anomaly Detection.
This action takes you to Davis Anomaly Detection. - Expand Create an event template and configure the event triggered by the configuration. For details, see Event template.
- Select Create.

Extracting data from the default_logs bucket might induce additional costs. If your logs are available in a specific bucket, we recommend using filter dt.system.bucket == "{your bucket}" to increase efficiency.
If you don't have access to your team's or department's bucket, you can create a private one following the bucket assignment documentation.
Conclusion
Apart from standard Anomaly Detection alerts, Dynatrace offers other solutions, such as:
- Creating a log alert for a specific event.
- Creating an alert of log data over a period of time.
If you followed these steps, now you know how to create log alerts for specific events and a summary of the log data over a period of time.