View virtualization monitoring data
- Reference
- Published Jan 03, 2019
With Dynatrace you can explore the health of your virtualization infrastructure, from high-level metrics on your dashboards to performance metrics related to specific processes on individual virtual machine and ESXi host overview pages.
Your dashboards
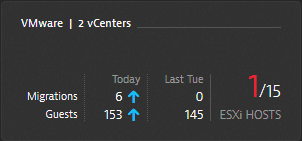
You can easily add the VMware tile to your dashboards. The VMware tile displays general VMware details about any standalone ESXi hosts and vCenter servers in your environment, including daily and past-week usage statistics. You can also set up multiple VMware tiles, each displaying the status of one or more vCenter servers.

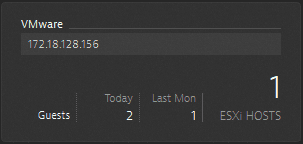
You can also configure a VMware tile to display the status of a standalone ESXi host.

If you click the VMware tile, you can navigate to the VMware page, where you can view a list of virtual hosts in your environment.
VMware page
If you have more than one vCenter or standalone ESXi host, you'll find your servers listed on the VMware page. The vCenters page can be filtered to display only vCenters, only ESXi hosts, or both.
Select a vCenter card to drill down into the details of that specific server.
vCenter overview page
Each vCenter overview page displays a range of useful vCenter information including the number of clusters, number of hosts, and environment metrics. You can compare current metrics with metrics gathered over the past seven days. The most important measurements include CPU and memory consumption, network activity, migrations (vMotion), and storage delay.
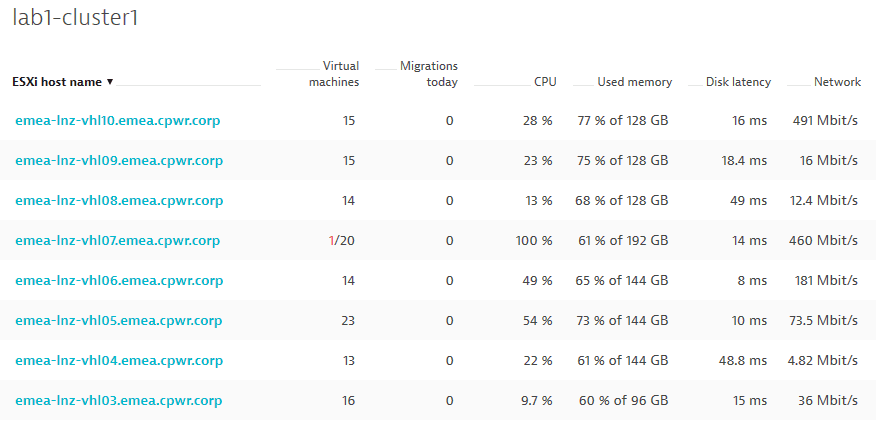
If the vCenter server you're analyzing includes ESXi hosts, you'll see a list of the ESXi hosts in the Virtual machines panel. Select an ESXi host to navigate to the overview page of that host, where you can view full health statistics for that host.

ESXi host details page
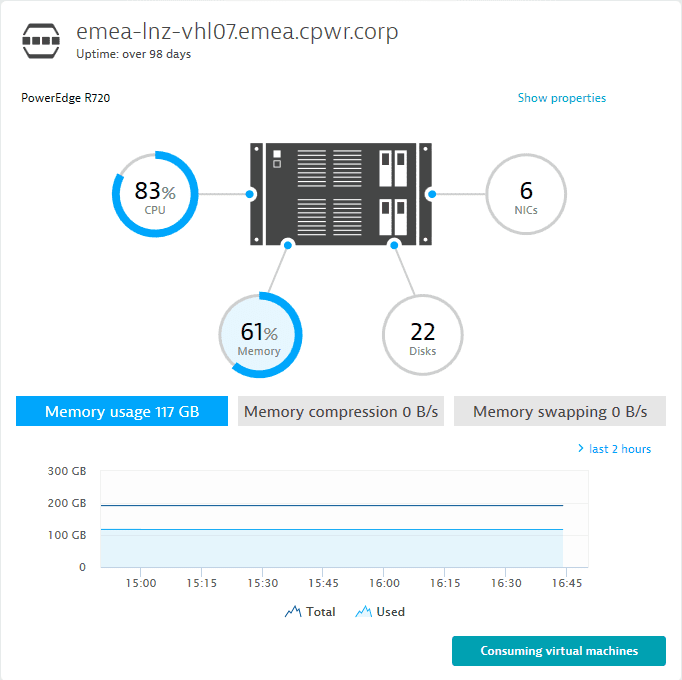
ESXi host pages provide details about the top consumers of hypervisor memory and CPU. Here you can quickly check storage usage across all datastores and locate the most active network interfaces in your environment.
