Alert on common Kubernetes misconfigurations and detect anomalies with Kubernetes metrics
Kubernetes is an integral part of many organizations' infrastructure. With the vast number of nodes and pods in a typical Kubernetes infrastructure, it's important to have a scalable alerting solution.
Real-world scenario
One of the primary applications of Kubernetes alerts is to detect anomalies in your infrastructure immediately.
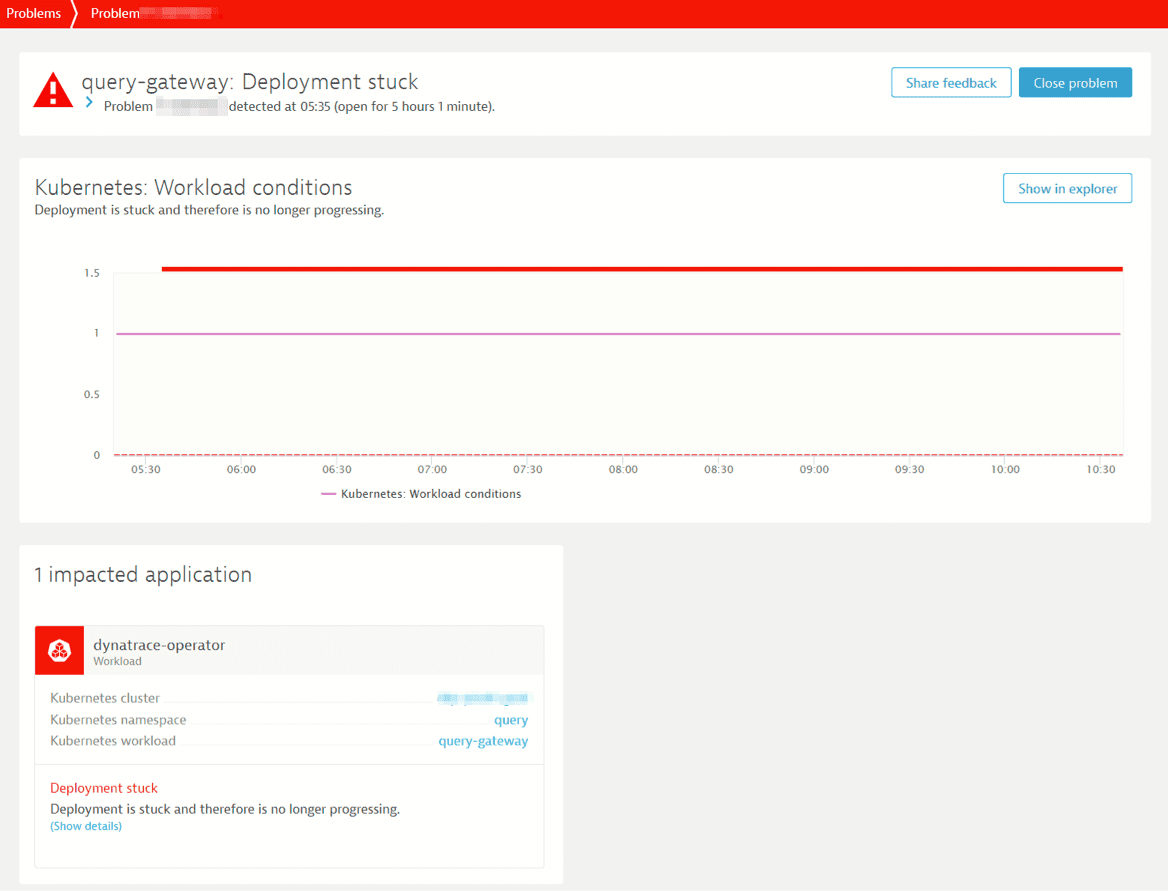
For instance, consider a scenario where pods failed to start up in a production environment, but everything worked seamlessly in staging. While there was no immediate impact on production (no traffic routed to unready pods), Dynatrace alerted on a deployment that couldn't progress (deployment stuck), meaning the latest version couldn’t be rolled out.
Using a combination of Kubernetes events and application logs in Dynatrace, it was determined that a DNS issue was the root cause. By adjusting the Kubernetes network policies, the problem was resolved.
Benefits
Kubernetes out-of-the-box (OOTB) alerts can be easily configured within the global anomaly-detection settings. With this feature, you can achieve:
-
Quick setup: OOTB alerts, including those for Kubernetes, come preconfigured, which ensures that monitoring setups often take less than 5 minutes.
-
Streamlined monitoring: OOTB alerts automate the oversight of multiple metrics, centralizing the monitoring process and reducing the need for frequent manual checks.
-
Responsive adaptability: The feature adjusts alerting thresholds based on real-time cluster loads, ensuring relevant monitoring and minimizing potential human errors.
-
Direct navigation: Navigate to the settings related to your namespace directly from Dynatrace and adapt everything to your needs without the need for external configurations.
-
Default configurations: Set up default alert configurations for all active and future Kubernetes clusters, namespaces, and workloads, ensuring consistent monitoring as your infrastructure grows.
-
Granular customization: Customize alert settings at various levels, allowing you to handle alerts differently for production and development clusters and adjust node alerts within each.
-
Automation with Dynatrace API: Leverage the Dynatrace API to automate configurations, ensuring that your alerting system evolves smoothly with your infrastructure changes. Moreover, with the Dynatrace API, you can adopt the Configuration as Code approach to configure alerts, integrating them into a GitOps workflow.
Getting started
Alerts for common Kubernetes issues can be configured on three levels:
- Environment: Settings apply to all clusters, nodes, namespaces, or workloads in the Kubernetes environment.
- Cluster: Settings specific to individual clusters.
- Namespace: Settings specific to individual namespaces.
To configure these settings
- Go to Settings > Anomaly detection.
- Under Kubernetes, select any option.
For complete details on this feature, see Alert on common Kubernetes/OpenShift issues.