Monitor Kubernetes/OpenShift cluster utilization
- Dynatrace Classic
- 2-min read
Dynatrace version 1.232+
Prerequisites
- In Dynatrace, go to your Kubernetes cluster settings page and make sure that Monitor Kubernetes namespaces, services, workloads, and pods is turned on.
Kubernetes page
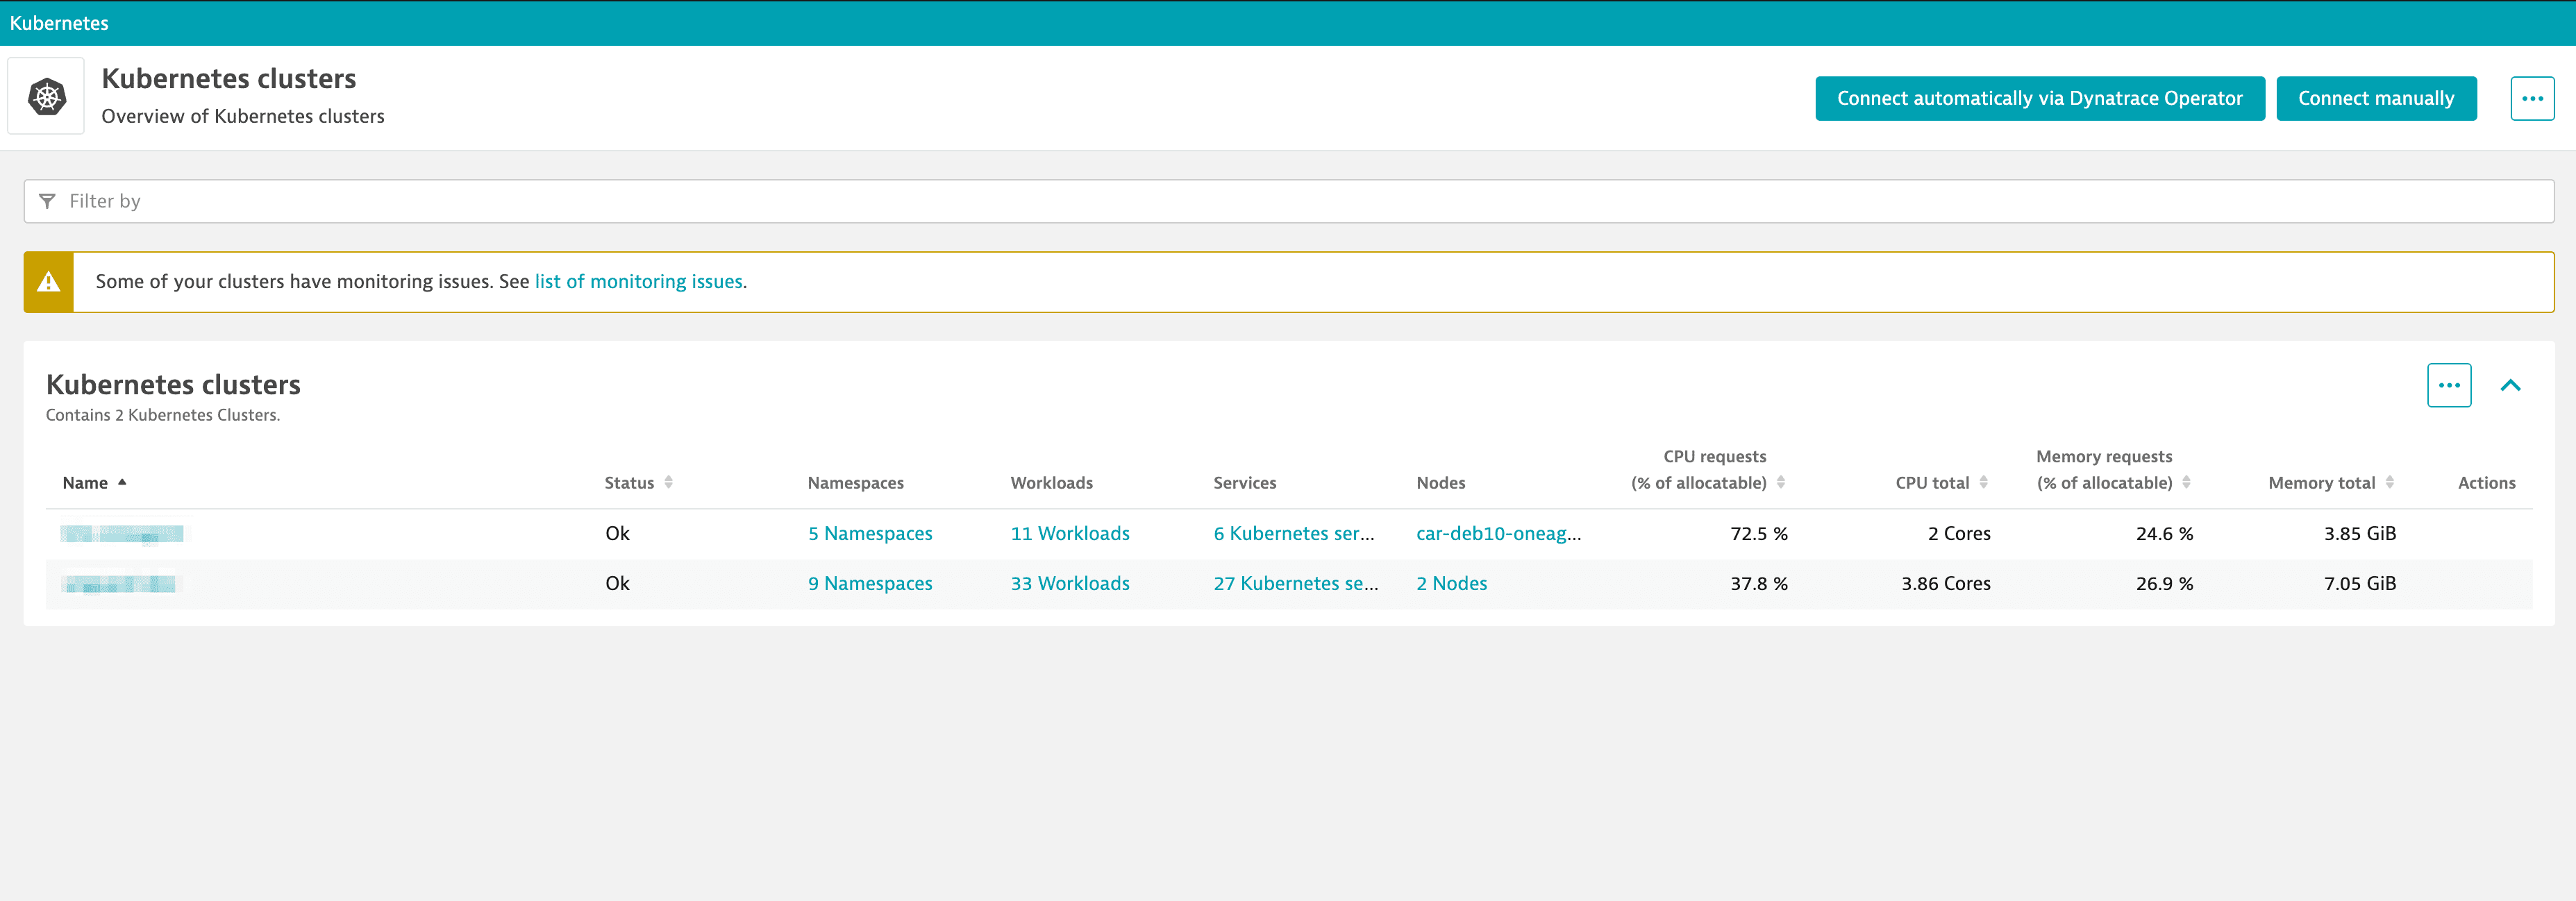
After enabling access to the Kubernetes overview page for a specific Kubernetes cluster, the specific cluster will appear on the Kubernetes page. The Kubernetes page provides an overview of all Kubernetes clusters showing monitoring data like the clusters’ sizing and utilization.
To access this page, go to  Kubernetes Classic.
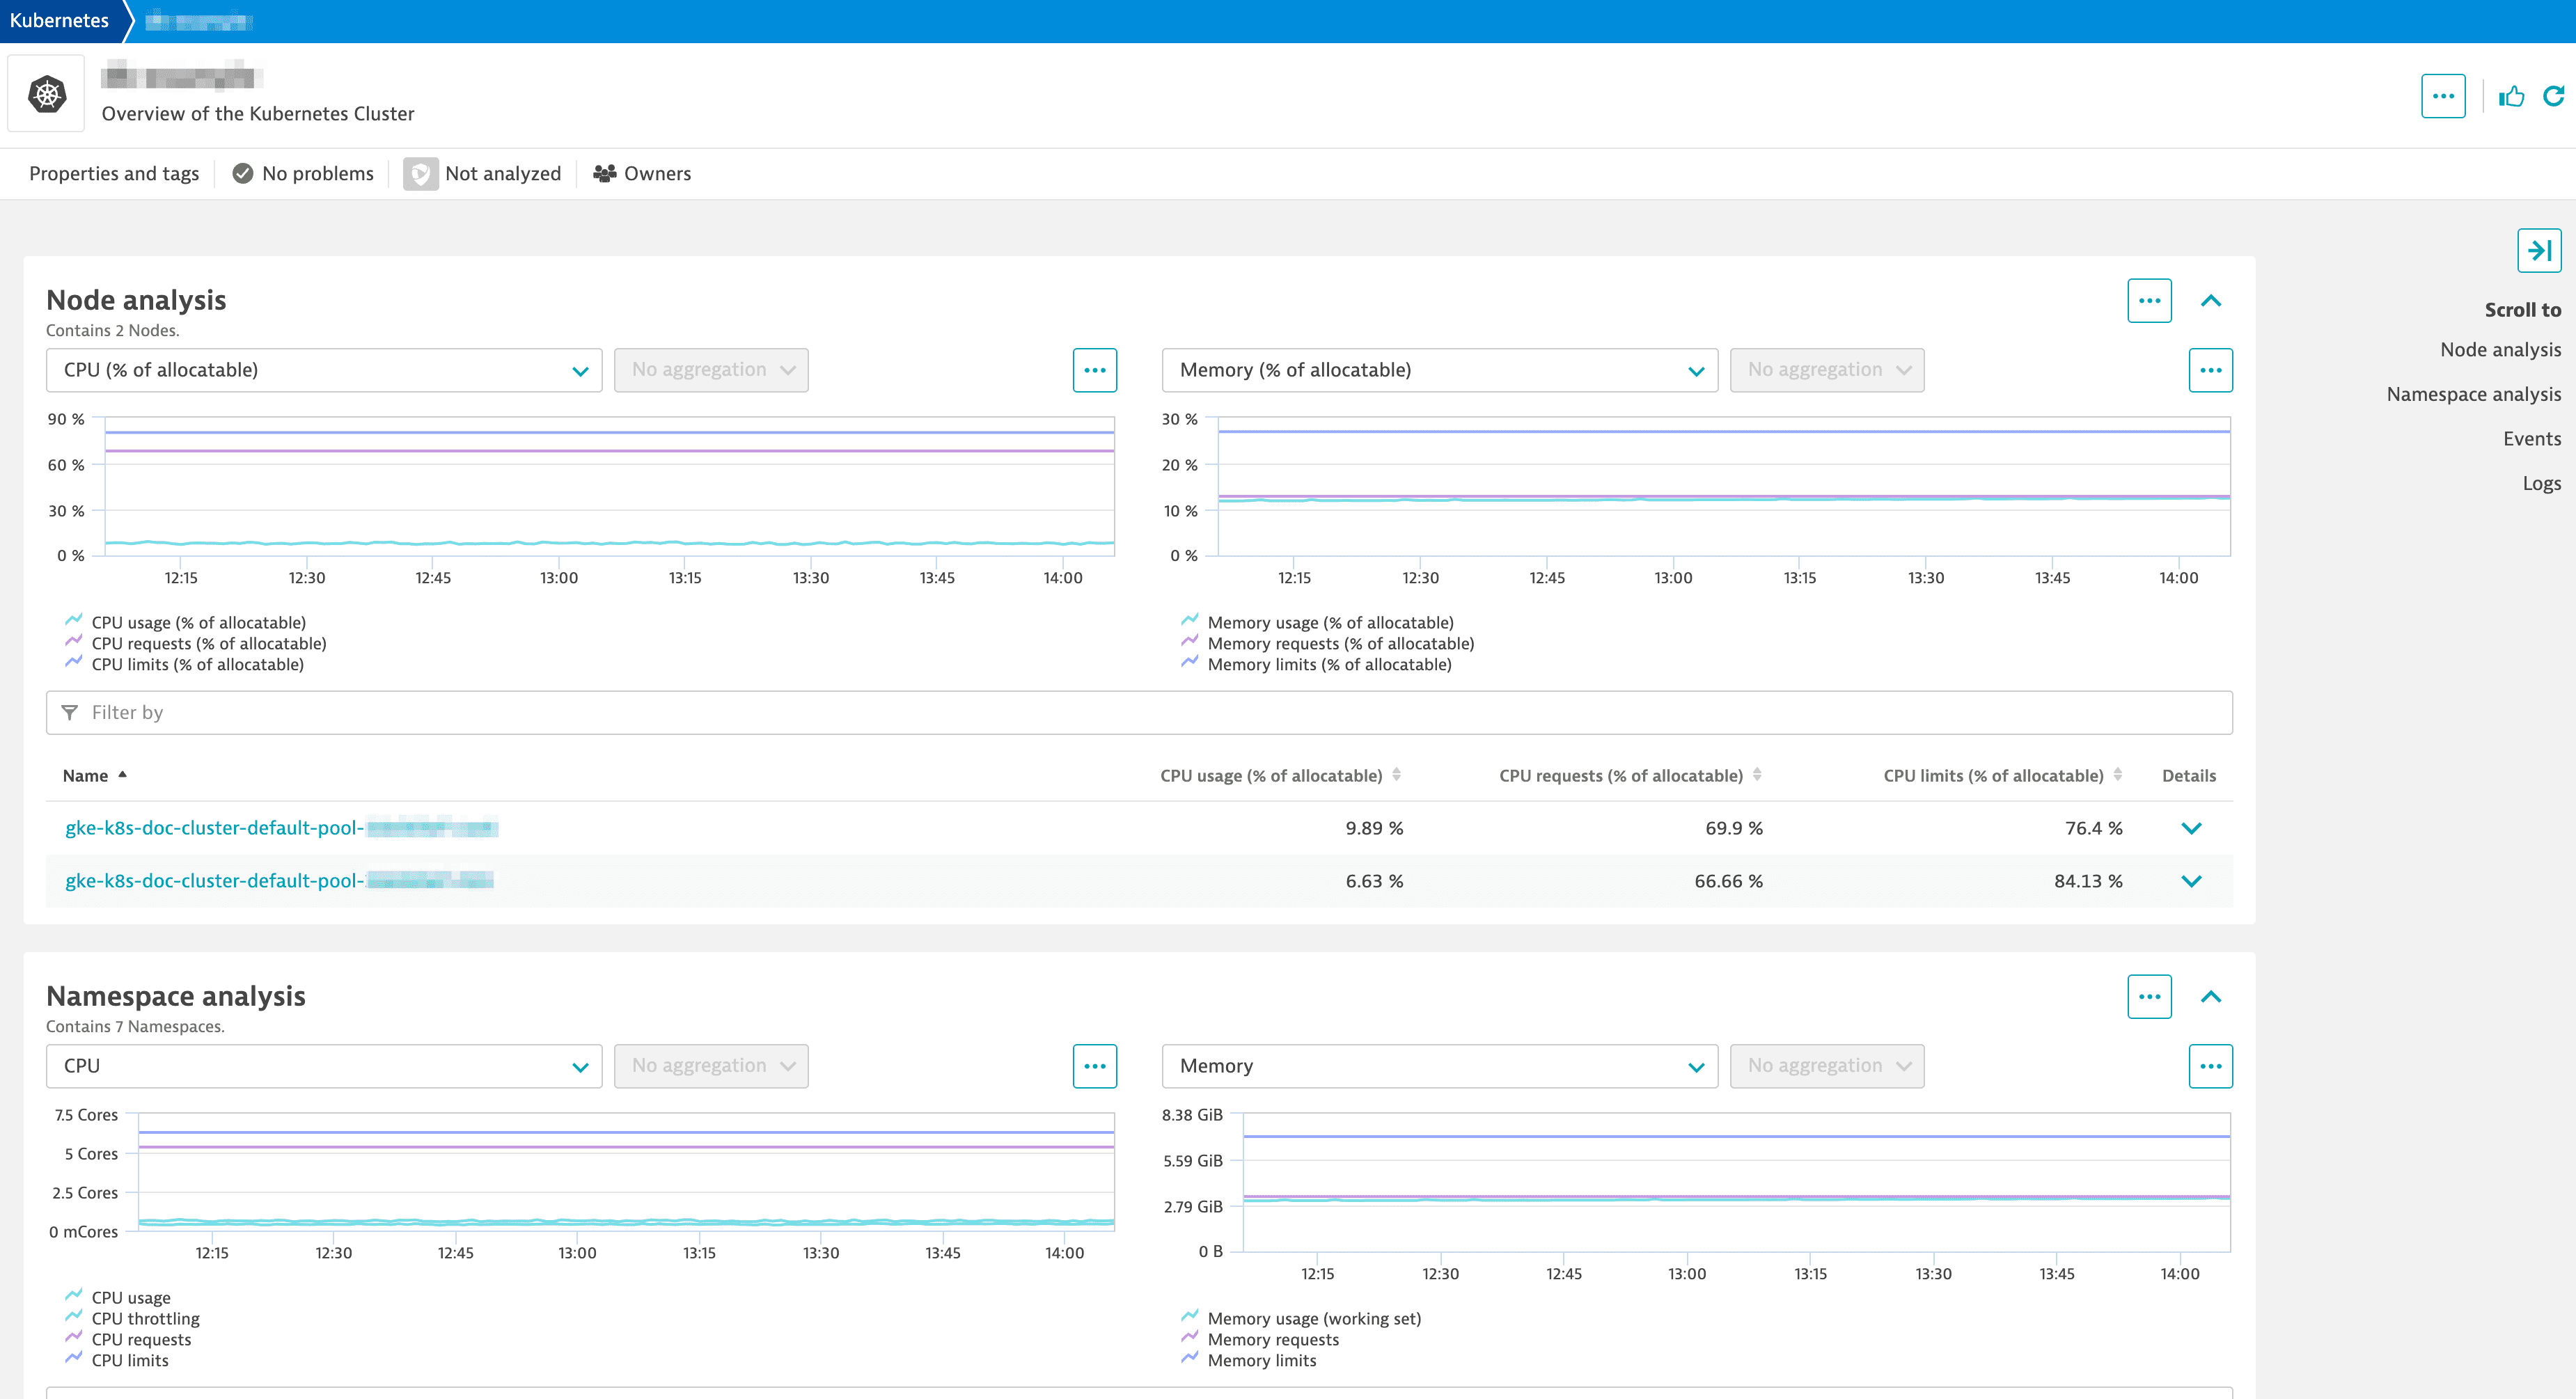
Utilization of cluster resources over time
As Kubernetes can run any containerized workloads and allow for horizontal pod autoscaling, the actual utilization of cluster resources will likely be very volatile. That is why Dynatrace offers a single pane of glass for the most important utilization and performance metrics on a cluster level. These metrics are:
- Percentage of CPU resources used out of the total allocatable CPU resources.
- Percentage of CPU resources requested/limited out of the total allocatable CPU resources.
- Percentage of memory resources requested/used out of the total allocatable memory resources.
- Percentage of memory resources limited out of the total allocatable memory resources.
- Total CPU/Memory usage.
- CPU/Memory resources requested/limited.
- CPU/Memory resources allocatable to pods.
- Total number of pods running/allocatable on cluster nodes.
- Number of times containers have been restarted.
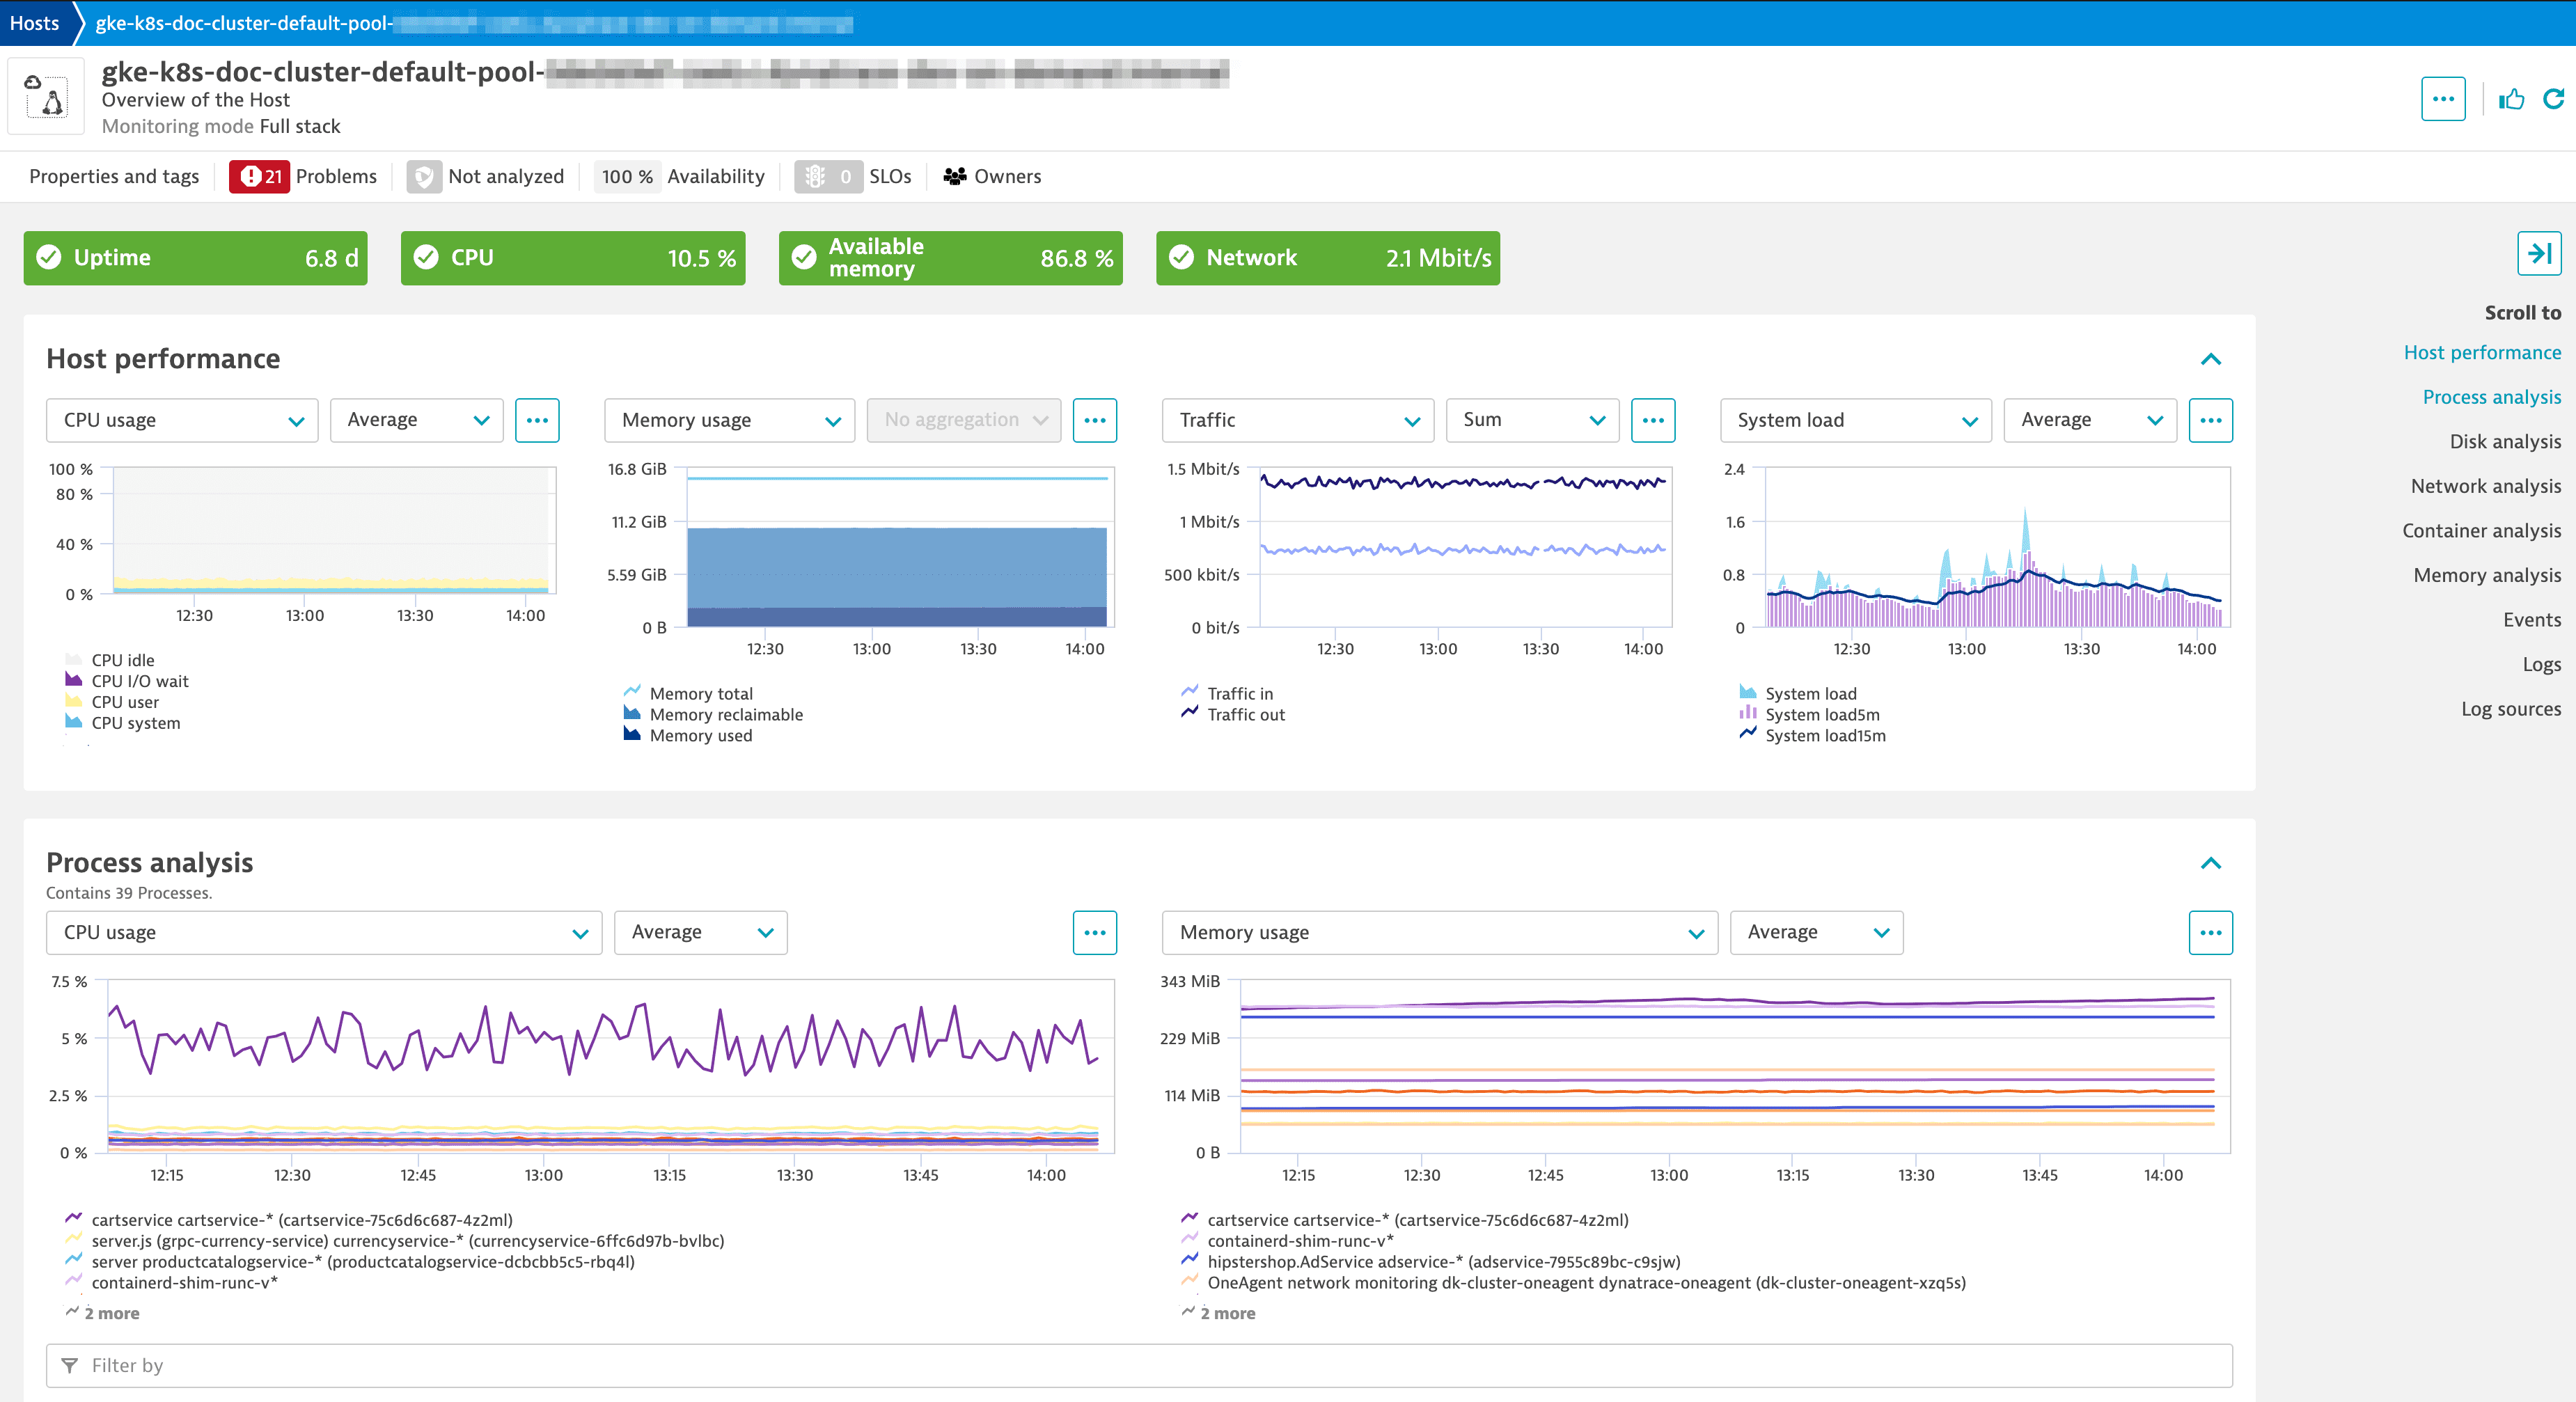
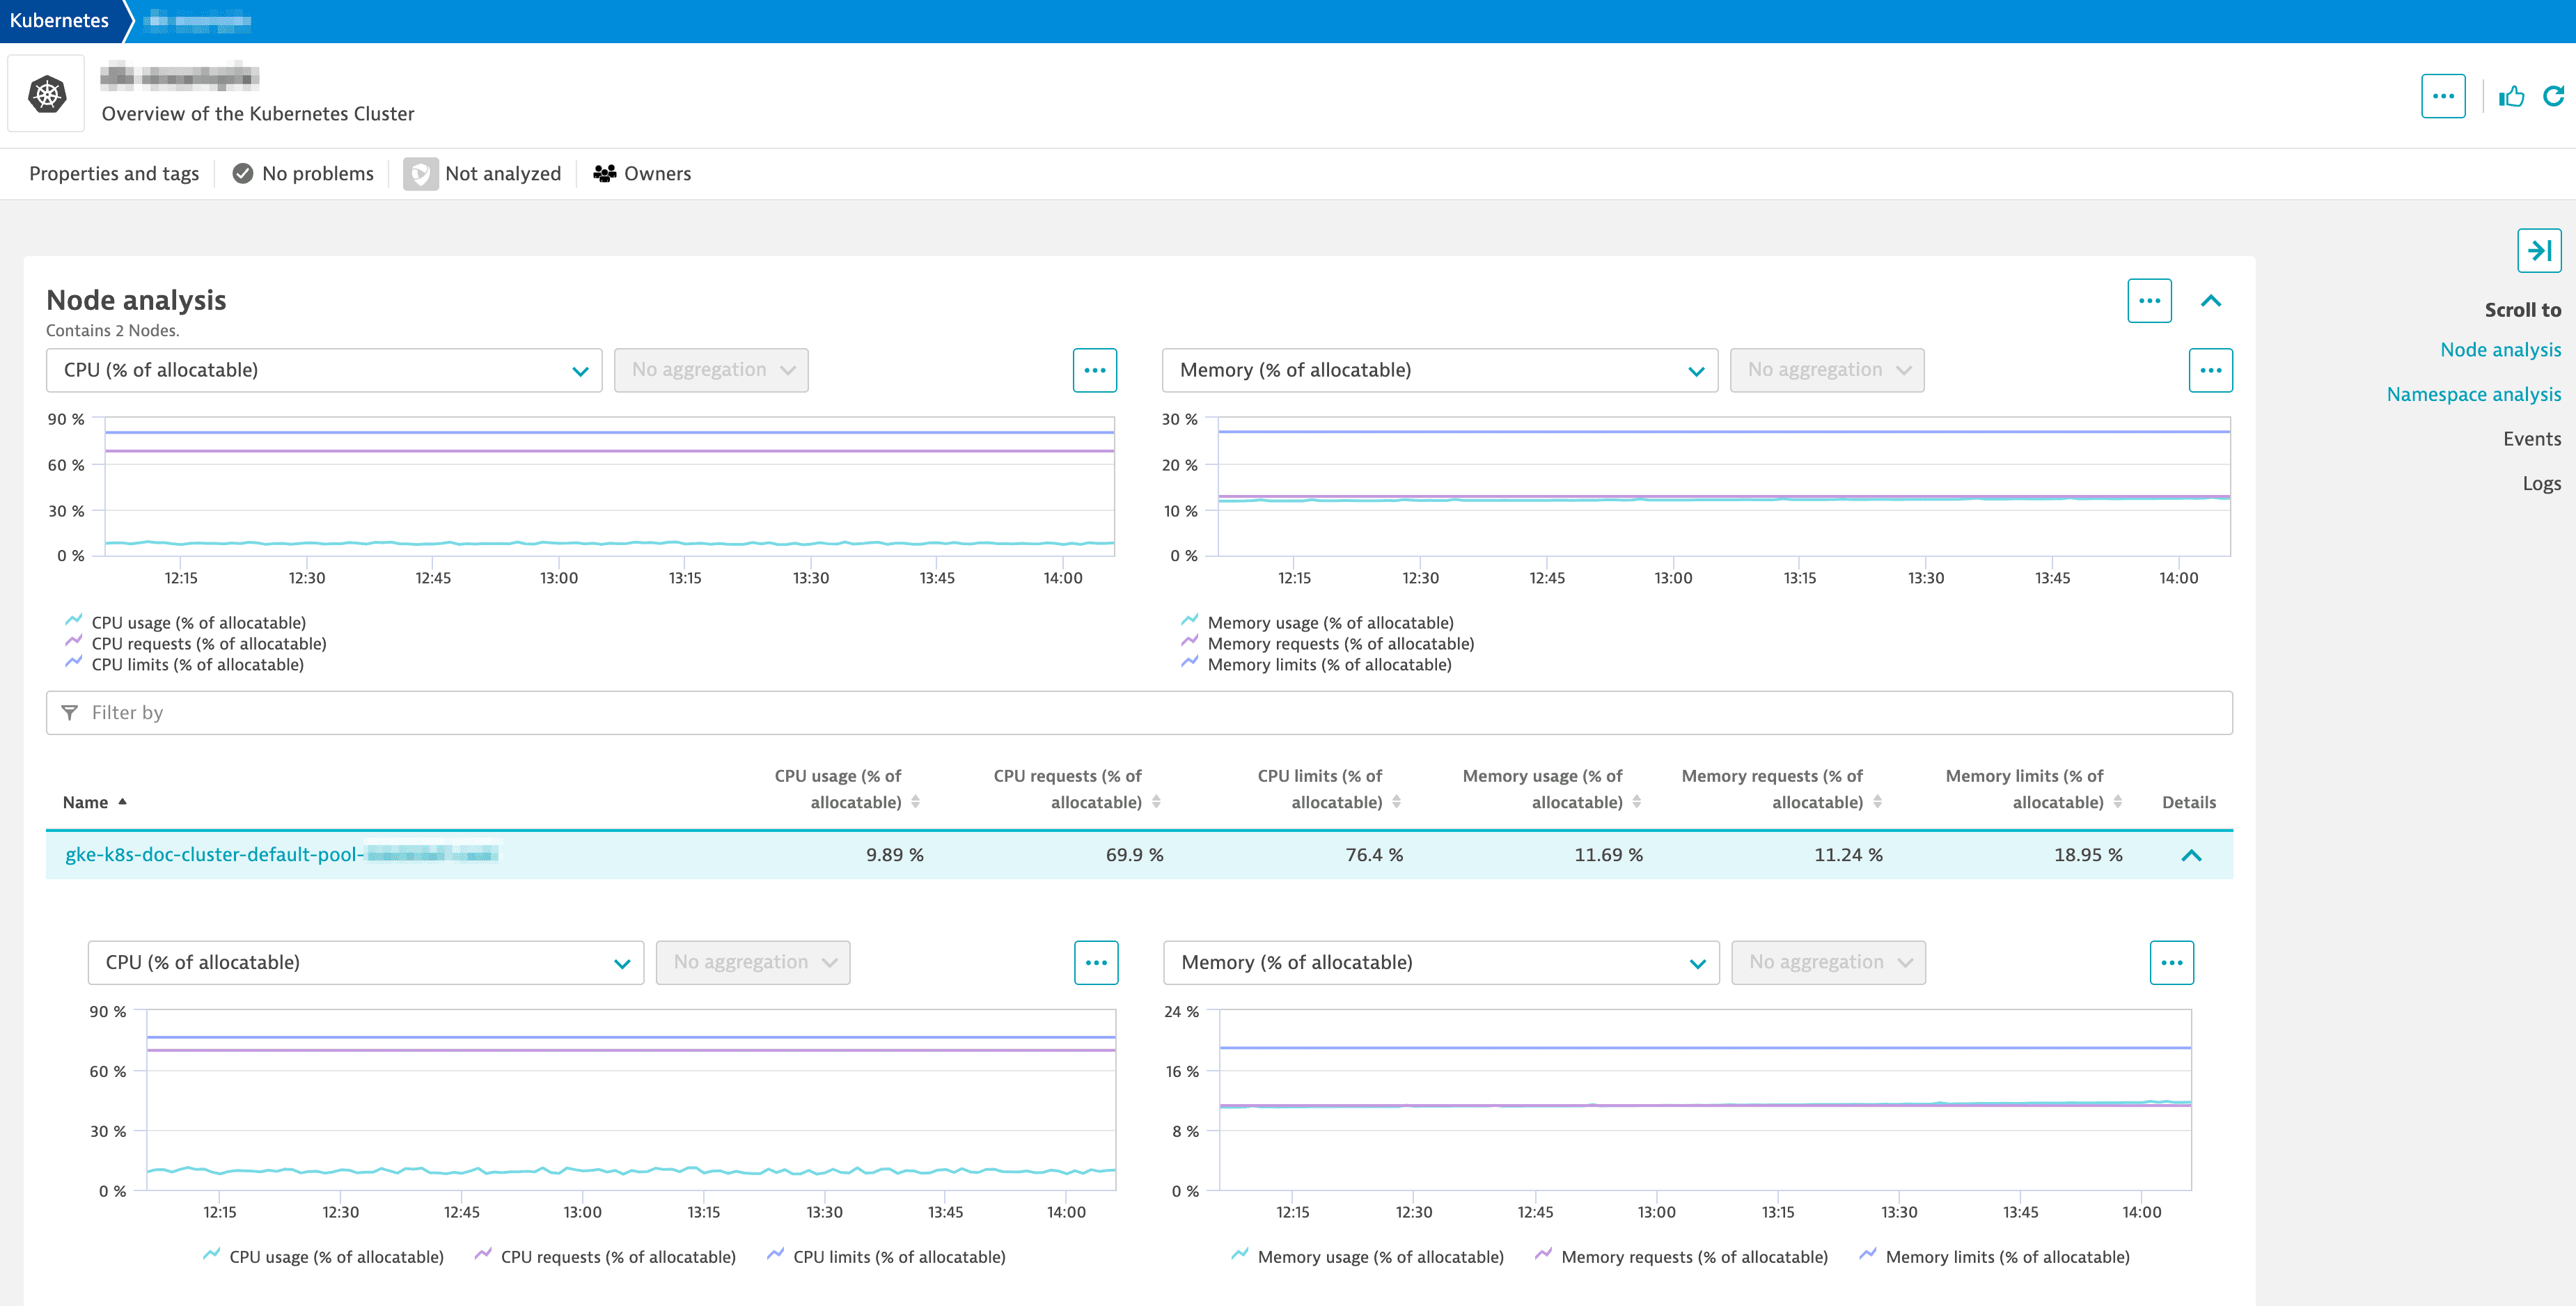
View available resources on your Kubernetes nodes
You can get detailed insights of the Kubernetes node metrics on a per-node level to understand how individual nodes are utilized. The Node analysis page also provides information about how much workload can still be deployed on nodes.
By selecting a specific node, you can access the host details at the top of the node overview page. From there, you can delve into code-level insights on currently deployed containers, along with relevant cloud-specific host properties and Kubernetes node labels.