Heroku monitoring
With Dynatrace cloud-native monitoring enabled for your Heroku applications, you get
-
Deep application monitoring and code-level details for Java, PHP, Node.js and more – with just a single, language-independent buildpack
-
Automatic root cause analysis of your Heroku web applications
-
Insights into how your Heroku applications use databases—including detailed metrics for each database statement
-
Real User Monitoring data on customers’ web browser and mobile device behavior
-
Automated external and third-party service monitoring (for example, calls to external REST APIs)
Prerequisites
Set up and configure Dynatrace integration on Heroku.
View monitoring results
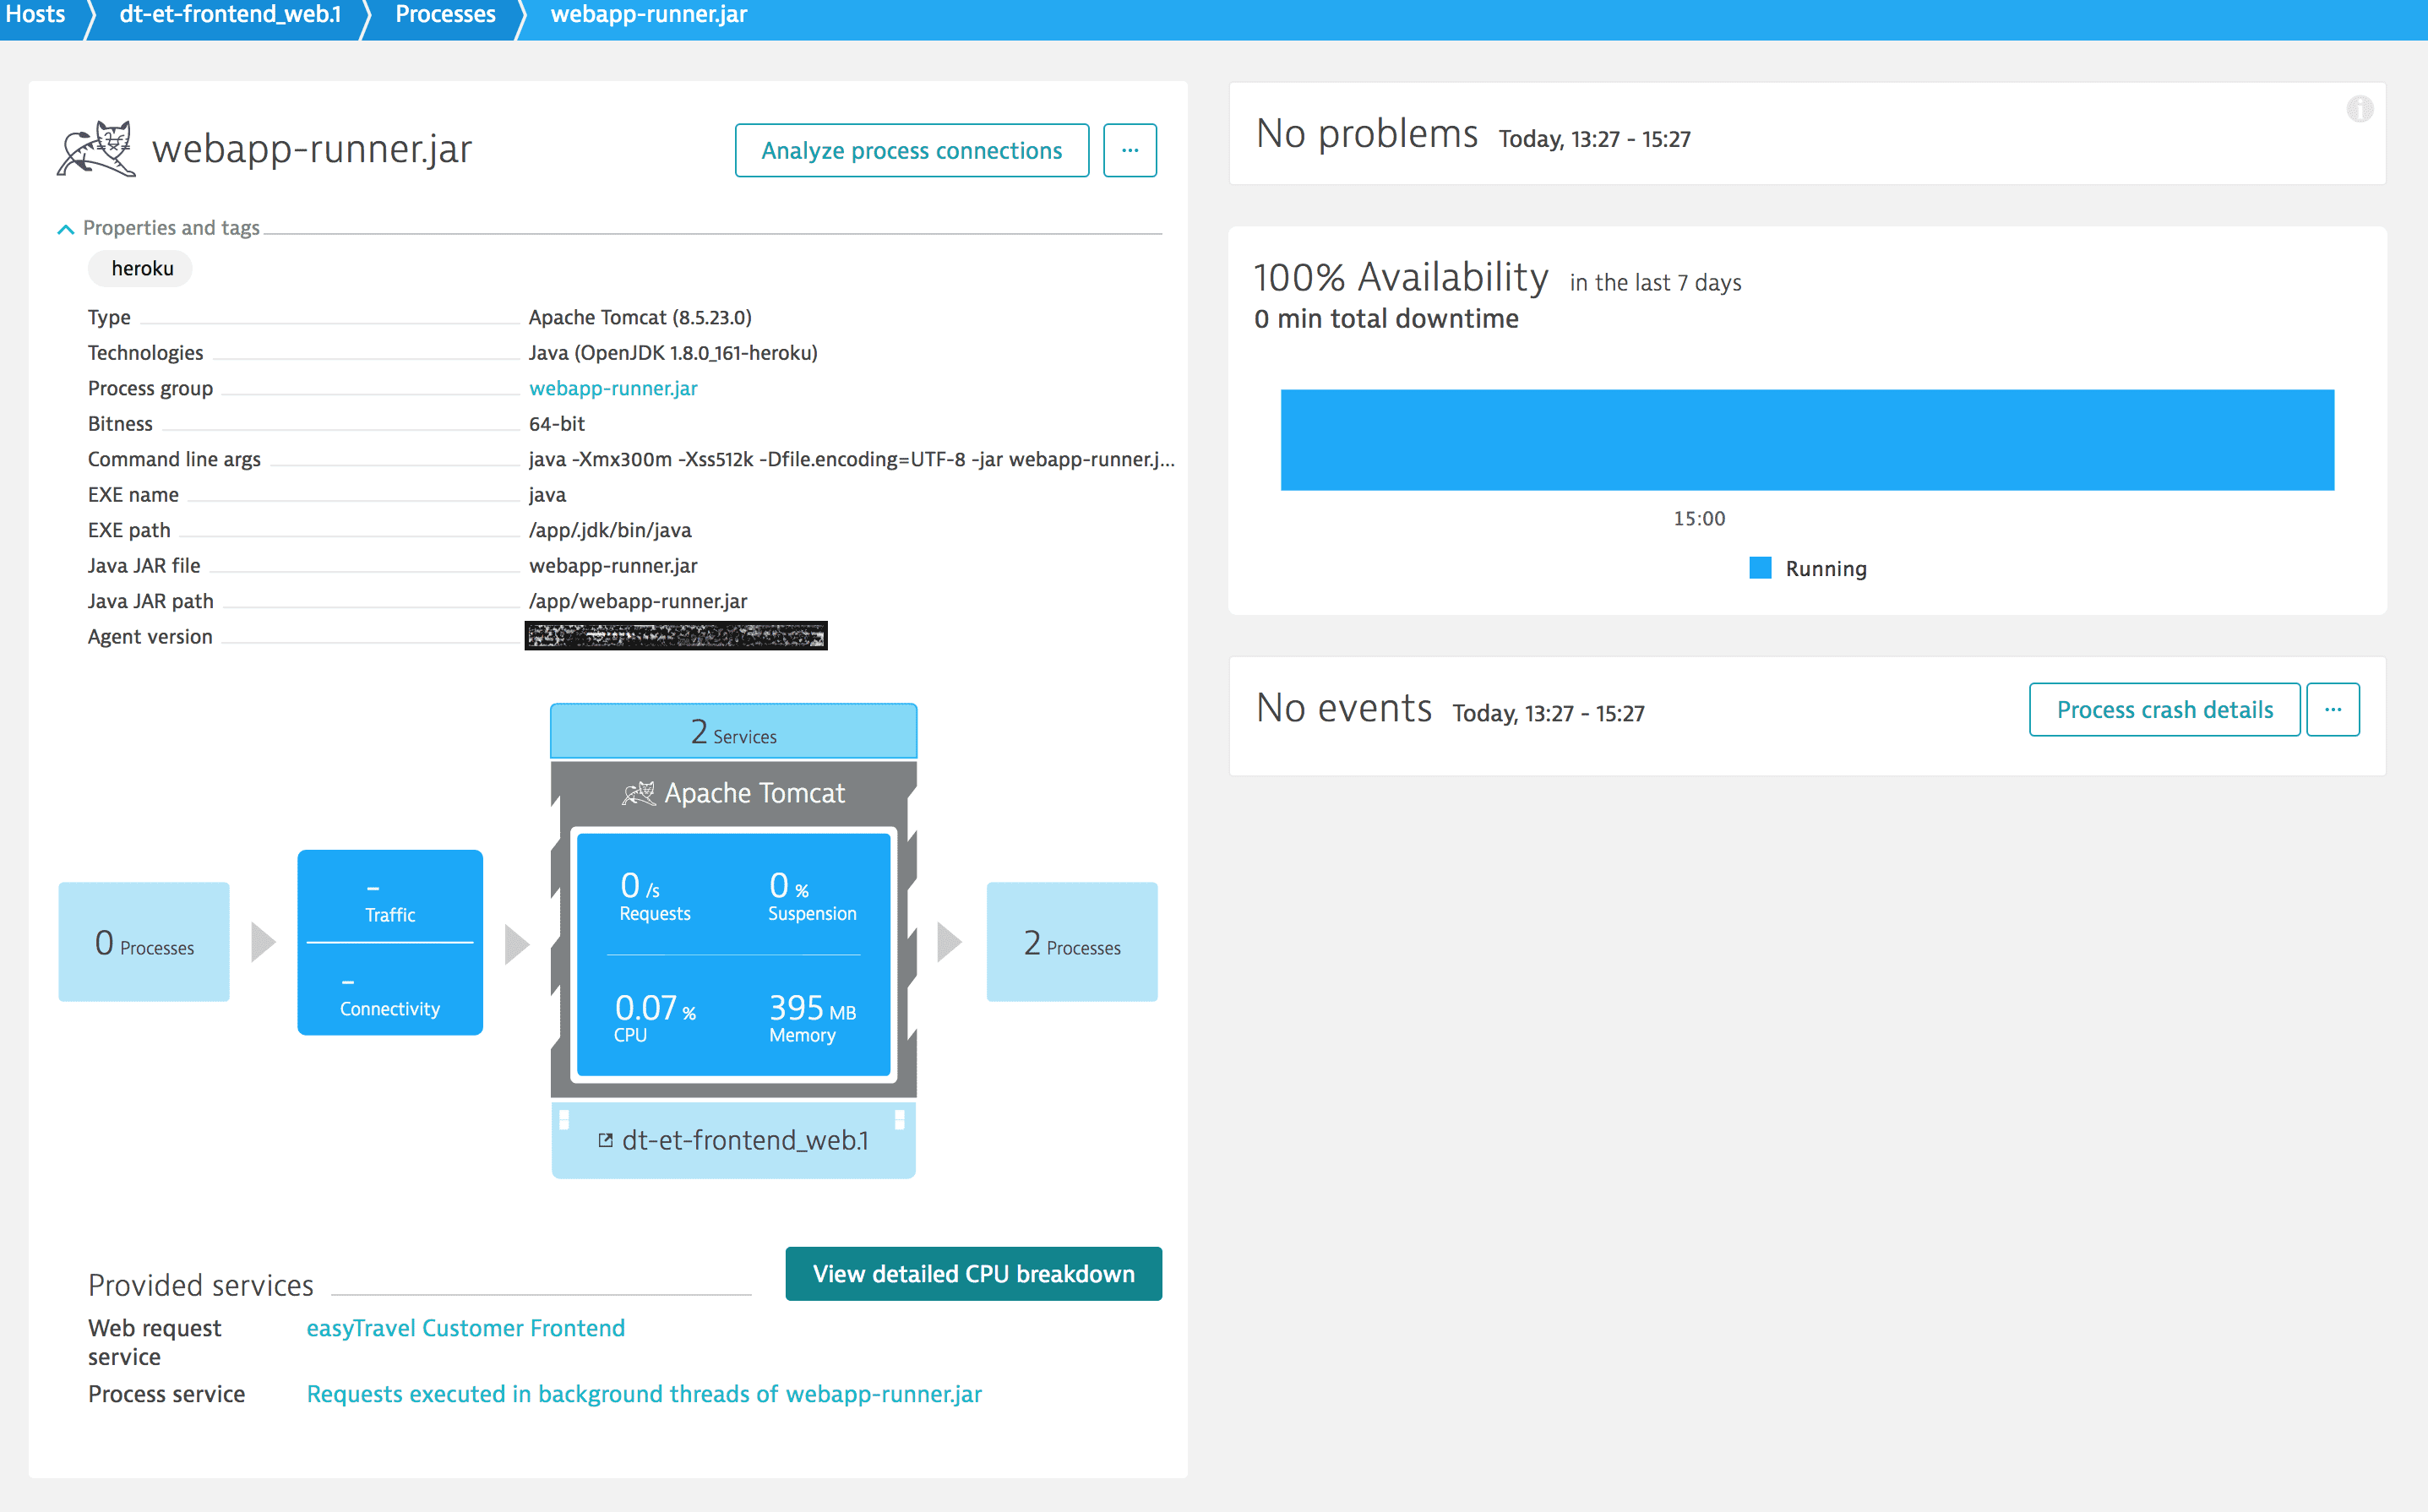
After linking your Dynatrace account with your Heroku application, you’ll receive the full range of application and service monitoring visibility that Dynatrace provides (for example, Smartscape and service-level insights with Service flow). Dynatrace automatically detects that your application is running on Heroku as well as services related to you Heroku application.

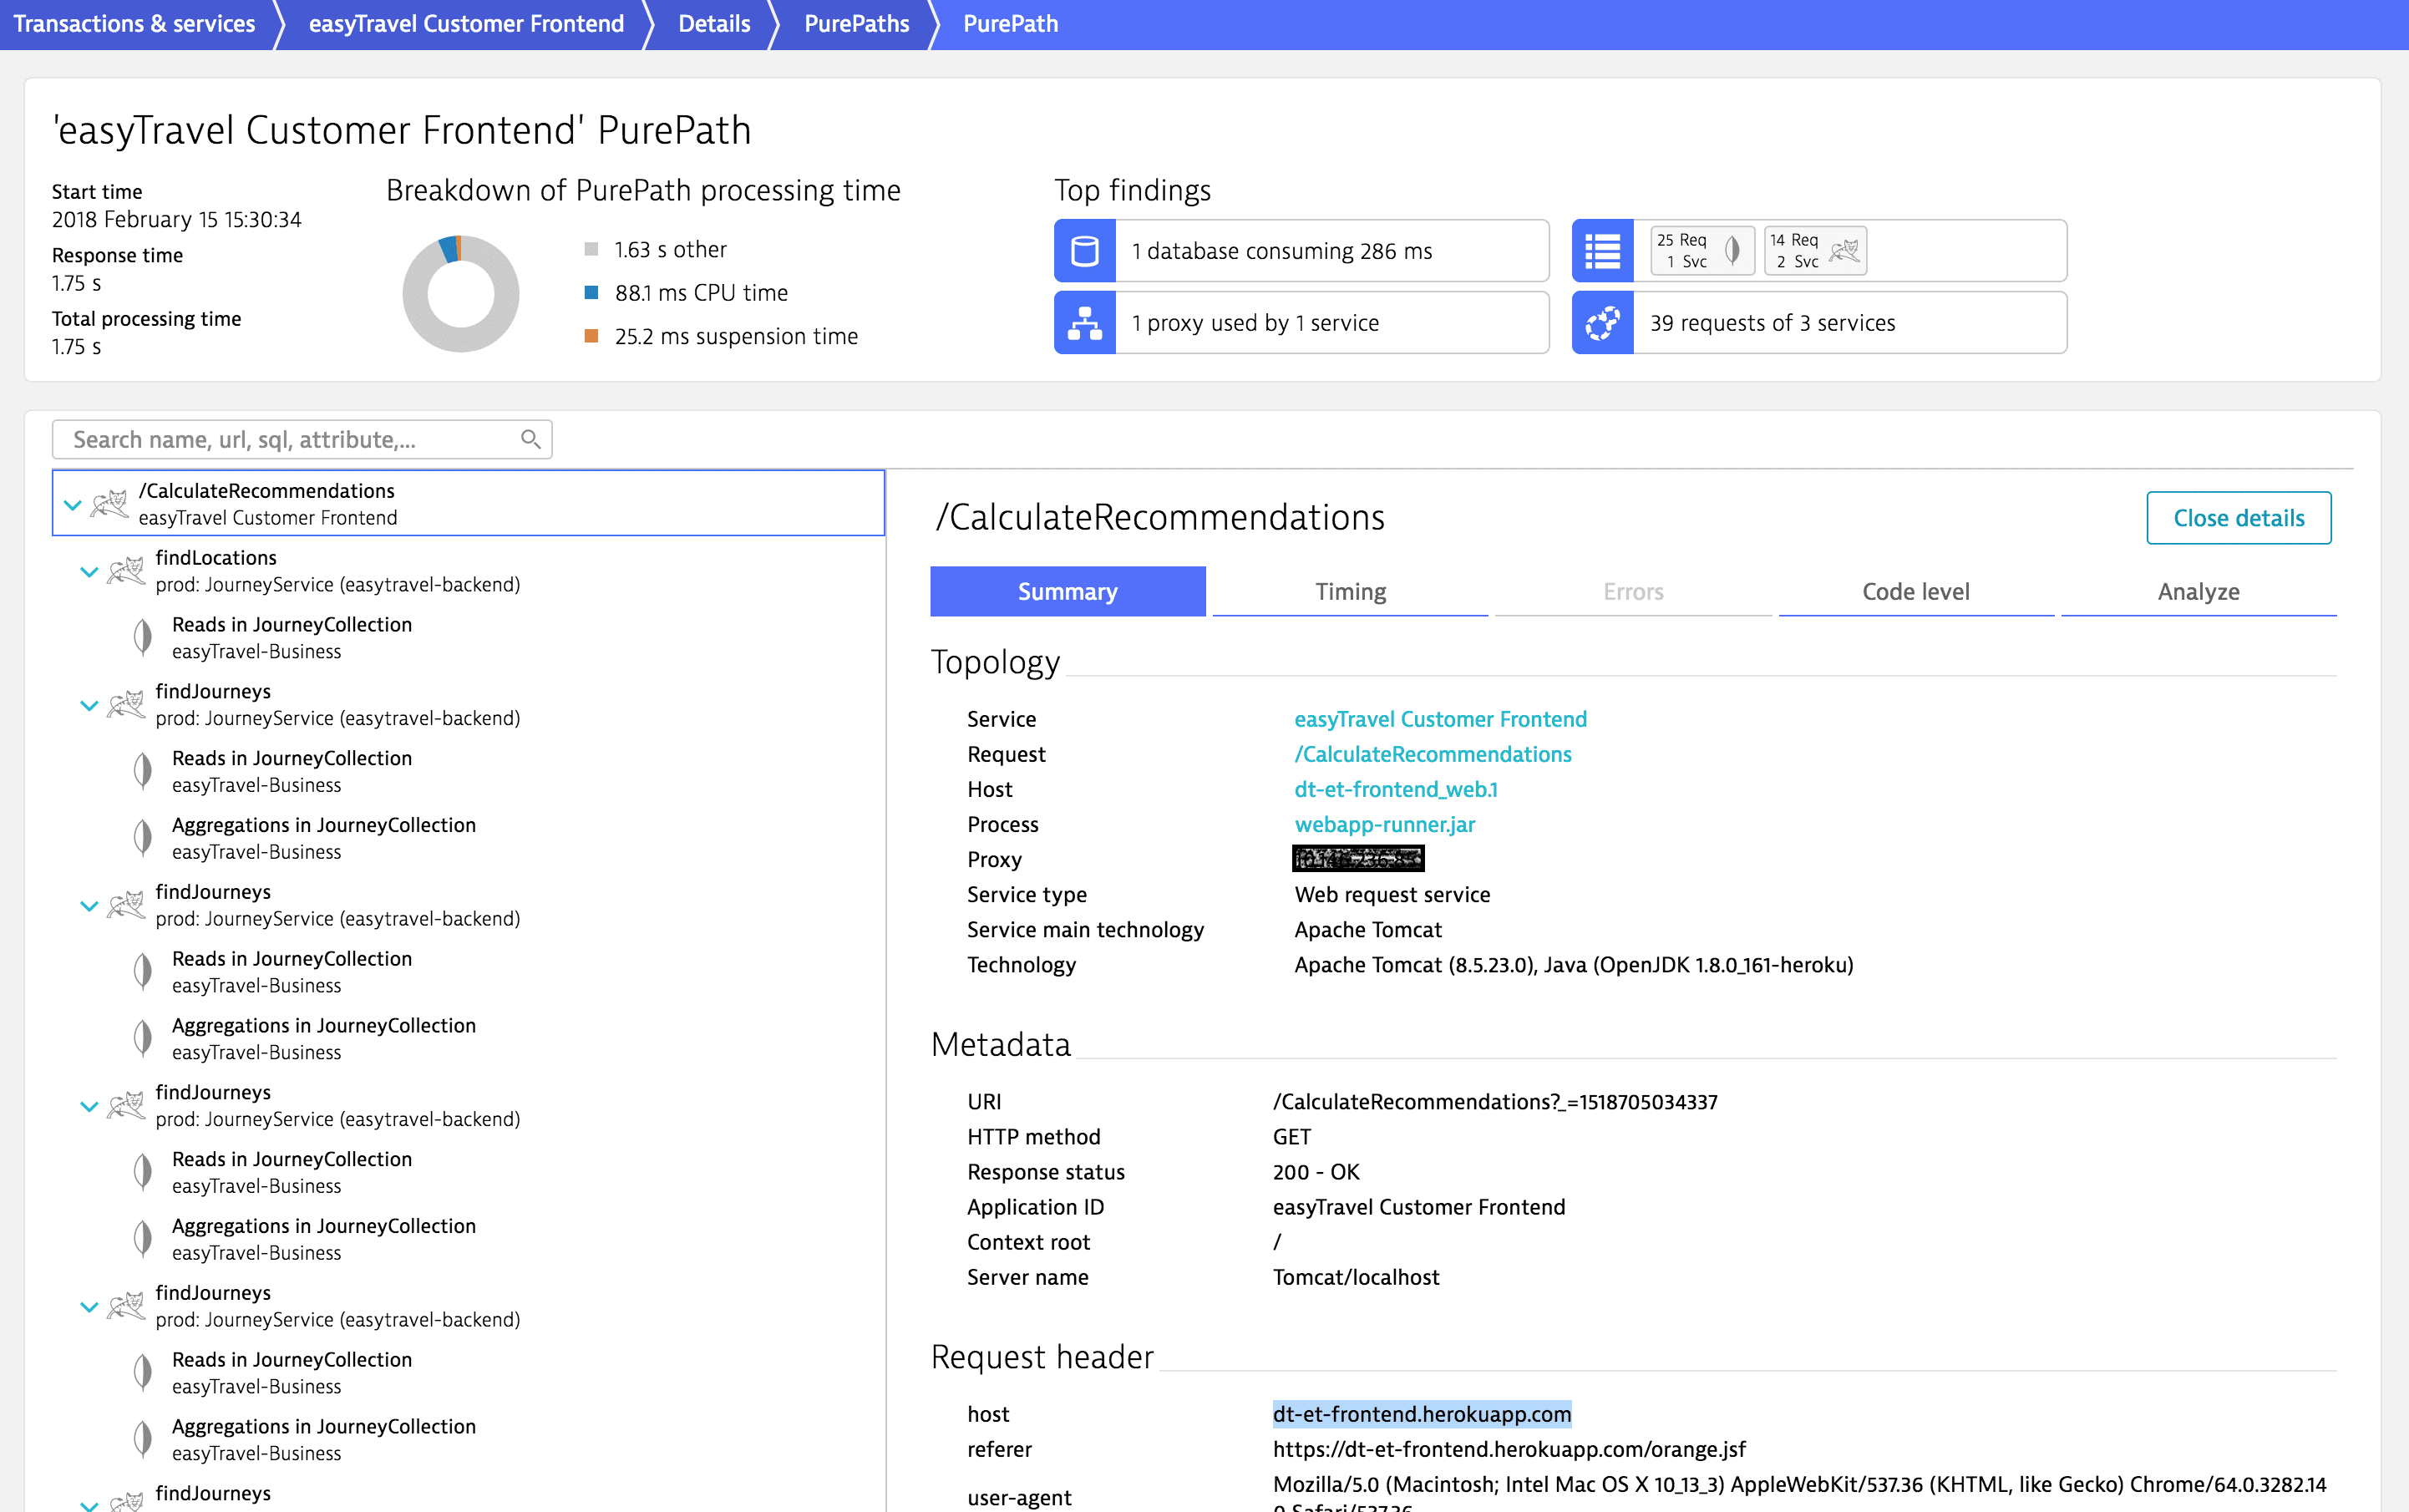
Dynatrace automatically initiates deep application monitoring for your Heroku applications and provides code-level visibility into your applications’ services. Dynatrace Service flow allows you to track how requests to services provided by your Heroku application are propagated through a system. Service tracing also helps to identify performance bottlenecks and failed requests in the service-to-service communication chain. With Dynatrace, it’s never been easier to pinpoint the root cause of poor performance in heterogeneous microservices stacks.

Tag your Heroku applications
You can use the Dynatrace powerful tagging mechanism to automatically organize and filter all monitored Heroku application components. Dynatrace allows you to apply tags to processes and hosts based on environment variables.
heroku config:set DT_TAGS=owner=team-easytravel