Monitor container groups
- Overview
- 3-min read
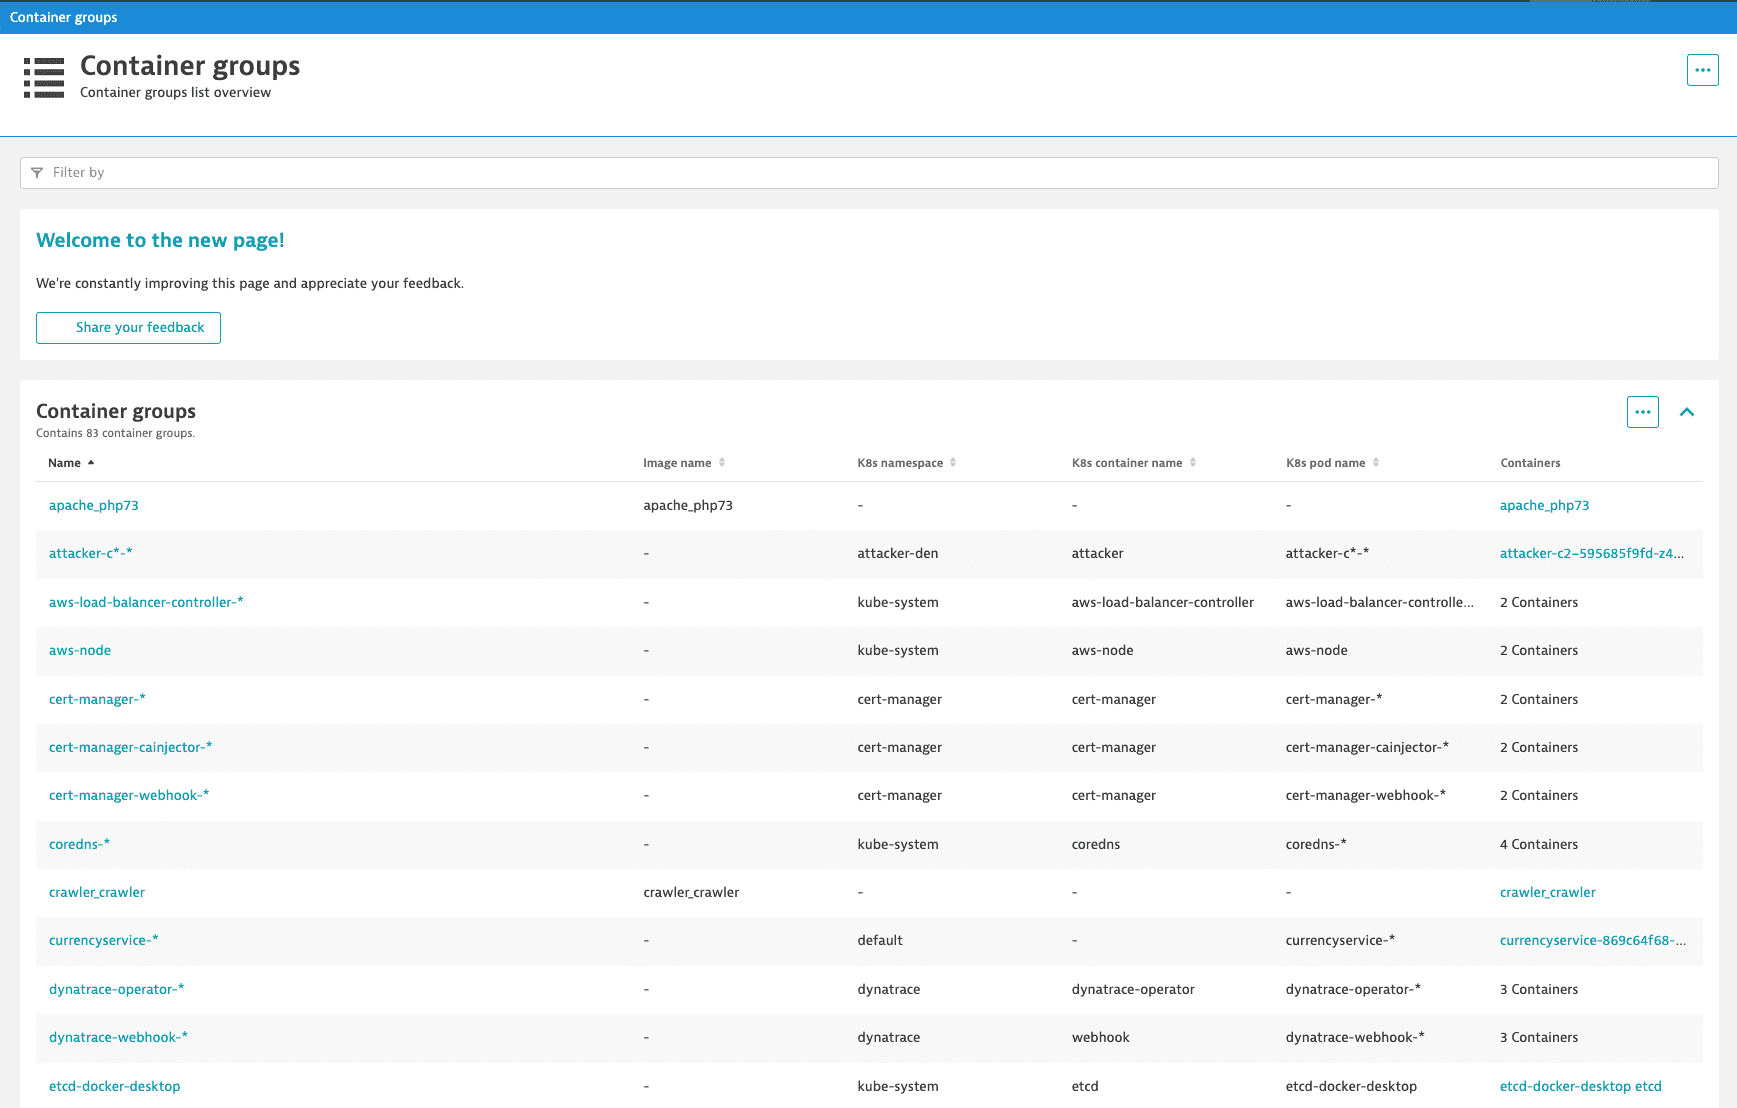
The Container groups overview page allows you to list all the containers in your environment and filter them by the process group, container group, or Kubernetes properties.
-
Go to Containers to list all container groups in your environment.

The Container groups table shows the properties of individual container groups. You can filter this table by:
- Name: the container group name.
- Image name: the image name assigned to the specific Docker container group. Docker containers only
- K8s namespace: the Kubernetes namespace to which the containers are assigned. Kubernetes containers only
- K8s container name: the name of the Kubernetes container. Kubernetes containers only
- K8s pod name: the full name of the Kubernetes pod to which the container belongs. Kubernetes containers only
-
Select a container group from the table to go to the container group overview page.

Container analysis
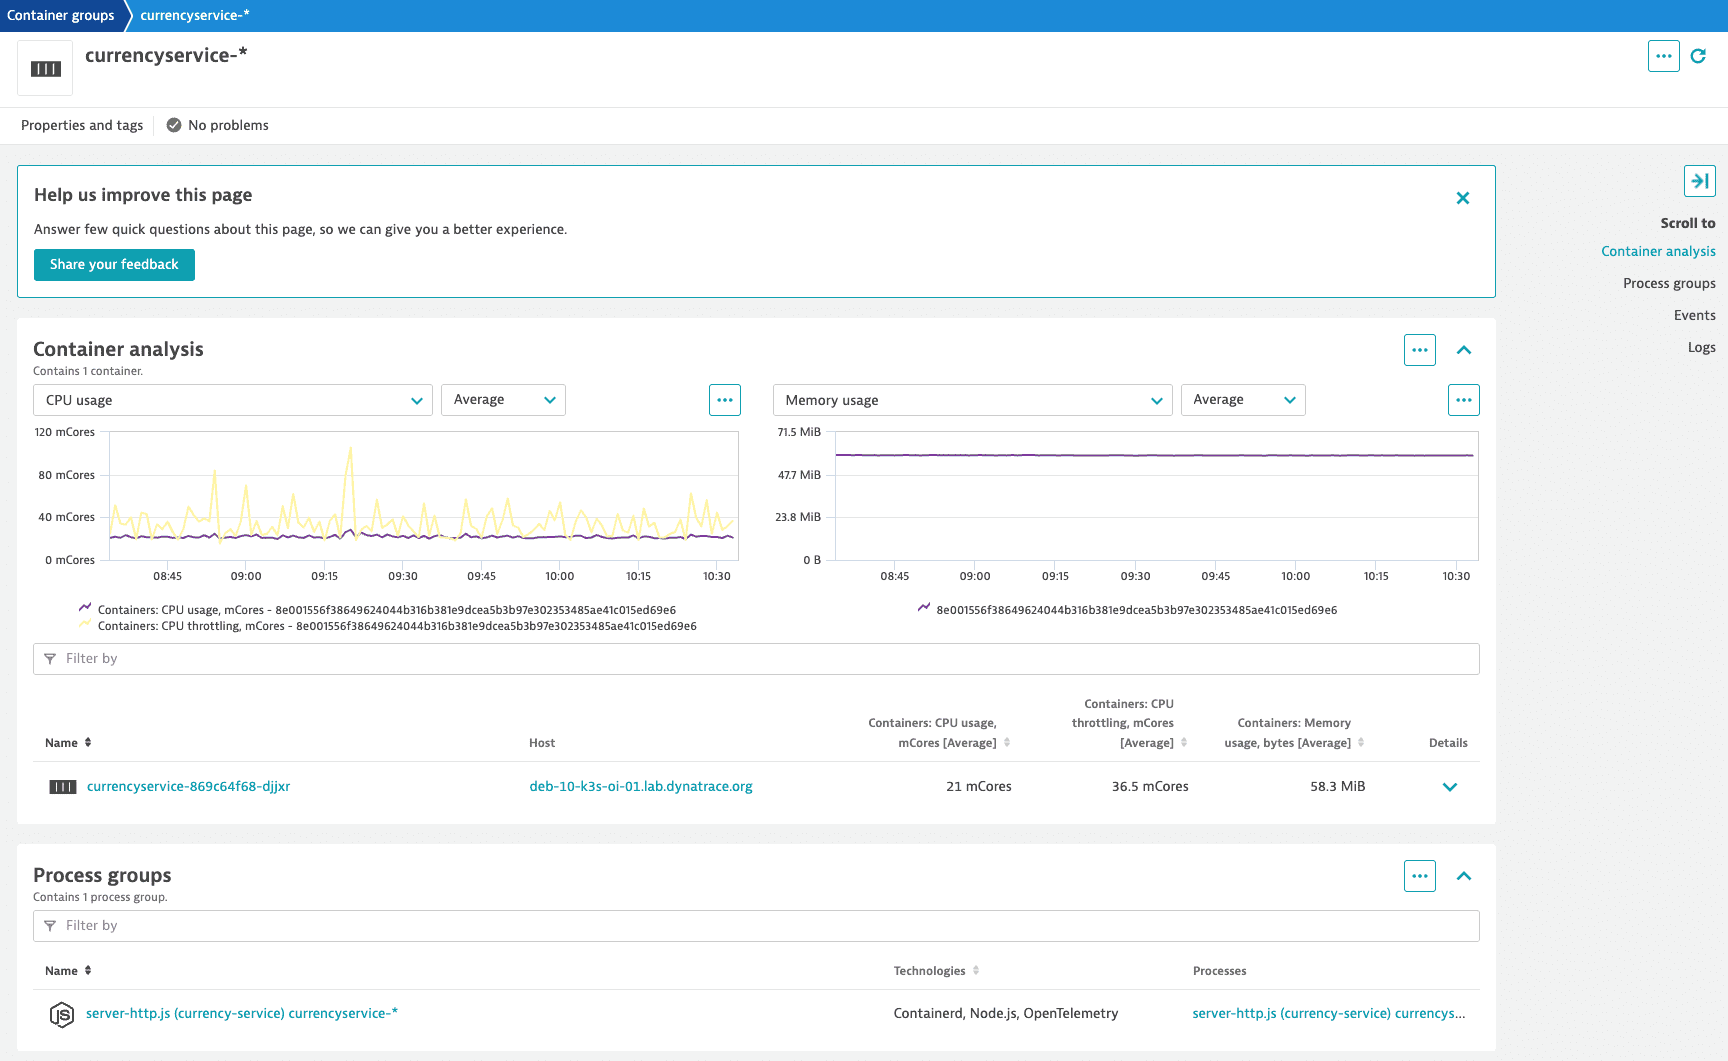
To get a better understanding of container behavior, go to the Container analysis section. You’ll see all the containers assigned to the selected container group.
Provided metrics include:
- CPU usage, mCores: CPU usage per container in millicores.
- CPU throttling, mCores: CPU throttling per container in millicores.
- Memory usage, bytes: resident set size (Linux) or private working set size (Windows) per container in bytes.
Select the container to access the container overview page, where you can view the details and available metrics for the selected container.
Leverage these charts
Select in the upper-right corner of a chart to:
- Show in Data Explorer—Opens Data Explorer for the associated query, so you can view the associated query, explore the data more in-depth, adjust the chart settings, and pin the chart to your own dashboard.
- Create metric event—Opens the Metric events for the selected metric.
- Pin to dashboard—Pins a copy of the selected chart to any classic dashboard you can edit. For example, if certain hosts are particularly important to your business, create a dashboard designated to monitoring only those hosts, and then pin charts from their host overview pages to that dashboard, all with almost no typing. For details, see Pin tiles to your dashboard.
Process groups
The Process groups section shows all process groups for the selected container group. Select a process group from the table to go to the dedicated overview page. For more information, see Overview of all technologies running in your environment.
Events
The Events tile charts the distribution of events, such as service deployments, process crash details, and memory dumps. Expand the tile to list events.
Logs
The log viewer timeline is interactive, allowing a global timeline selection. Use it to identify issues around a specific log event and see how it relates to the container performance.
Leverage these charts
Select in the upper-right corner of a chart to:
- Go to Log Viewer—Opens the Log Viewer page filtered by the selected container group.
- Create metric—Opens the Log metrics page with the Query value set to the selected container group.